Application of the time-dependent charge asymmetry method for longitudinal position determination in prototype proportional chambers for the ANDA experiment.
Abstract
The ANDA collaboration intends to build a state-of-the-art detector to study the physics of antiproton annihilation in the charm mass region at the future FAIR facility at GSI, Darmstadt. One major part of the ANDA detector is the straw tube tracker. It will consist of about 6000 individual straws grouped in 11 double layers and filled with an +10 % gas mixture. The required radial spatial resolution is about m. Two different methods are considered for longitudinal coordinate measurements - skewed double layers and a novel method based on the time-dependent charge asymmetry. The latter method is presented in this article.
keywords:
PANDA, FAIR, straw tube, charge division.PACS:
25.43.+t , 29.40.Cs , 29.40.Gx, ,
1 Introduction
A new state-of-the-art general-purpose detector is proposed by the ANDA collaboration [1]. It will be installed at the High Energy Storage Ring, HESR, one of the main components of the international FAIR facility at GSI, Darmstadt. The detector is designed to take advantage of the extraordinary physics potential which becomes available by utilizing high-intensity, phase-space-cooled antiproton beams with momenta between 1 and 15 GeV/c.
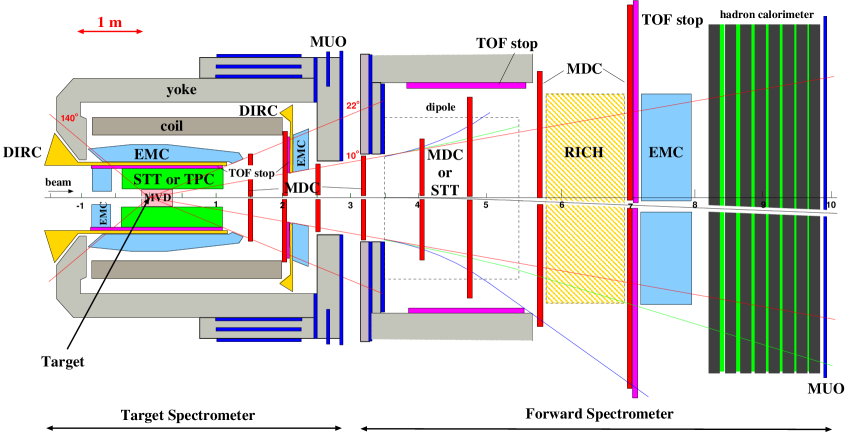
Due to the fixed target kinematics, the detector has an asymmetric shape and consist of two parts - the target spectrometer and the forward spectrometer, see Figure 1.
The Central Tracker of the Target Spectrometer consists of two main parts: the Micro-Vertex Detector (MVD) and the Straw Tube Tracker (STT).
2 Straw Tube Tracker
The STT consists of 11 cylindrical double layers of straws at radial distances of between 15 cm and 42 cm from the beam and with an overall length of 150 cm111The exact parameters of the STT are under investigation. For more information see [1].. The geometrical center of the STT is shifted 35 cm downstream with respect to the target position to provide better acceptance in the forward hemisphere.
The individual straw tubes have diameters of 6 mm for the five innermost double layers, and 8 mm for the outer layers. The gas mixture chosen for the straw tracker is +10 %. The relatively small tube diameters and the chosen gas provide maximum drift times comparable with the average time between events (100 ns).
Every other double layer can be skewed with respect to the beam axis by an angle ranging from to to obtain the coordinate of the track along the beam direction with about 4 mm precision. However, the skew angle causes the stereolayers to form a hyperboloidal shape, which makes the track reconstruction and mechanical design more complicated. As an alternative, it is proposed to use the charge-division technique instead of skewed layers, thereby simplifying the overall STT design and allowing the straws to be glued together thus forming a self-supporting construction, and significantly reducing the amount of passive material needed for structural reasons.
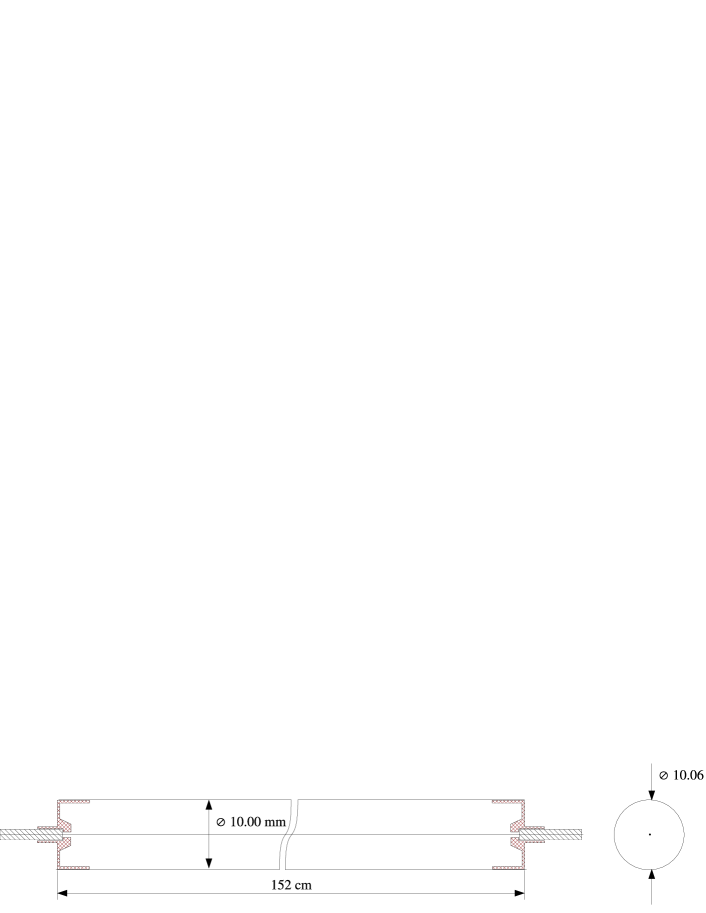
The straw tubes used for testing the charge division principle are made of two thin Mylar© strips m in thickness and 16 mm in width that are wound helically with a half-overlap and glued together. Including 6 m glue, the total straw tube wall thickness is m. The straw tubes were supplied by an industrial manufacturer [2]. The inner part of the inner strip is metallized and the inner diameter of the straw tube is 10 mm. The anode wire is made of W/Re alloy and is 20m in diameter. The longitudinal and transverse cross sections of the straw tube are shown in Figure 2.
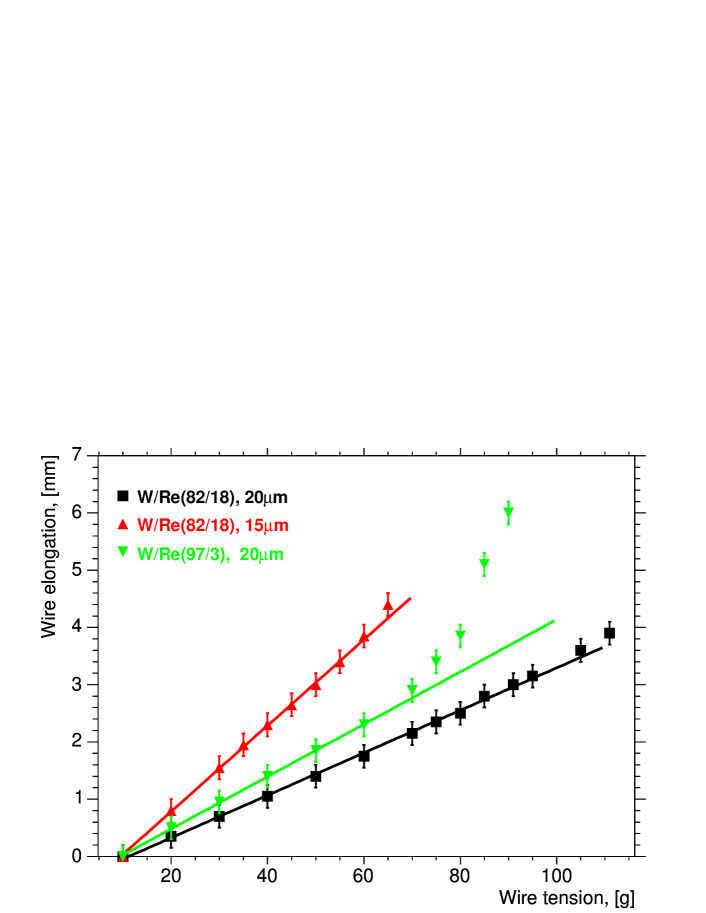
Wires with different Re concentrations were tested. As can be seen in Figure 3, wires with a higher percentage of Re have better mechanical properties. The region of plastic deformation for the 20-m diameter wire with 3% Re already starts at a tension of about 65 g, while for wire of the same diameter with 18% Re no plastic deformation is observed up to a wire tension of 110 g. For the 1.52-m-long straw the required anode wire tensions are 32 g and 58 g for the 15- and 20-m diameter wires, respectively, in order to achieve a gravitational sag of the wires of less than 30m. It is preferable to make use of wires with an increased percentage of Re in order to have an adequate safety margin.
3 Test Setup
The straw tube performance was studied using collimated radioactive sources. An 55Fe source was used to study the ultimate spatial resolution limitations of the method and a 90Sr source was used to test the charge division performance with realistic detector response. The experimental setup is shown schematically in Figure 4.
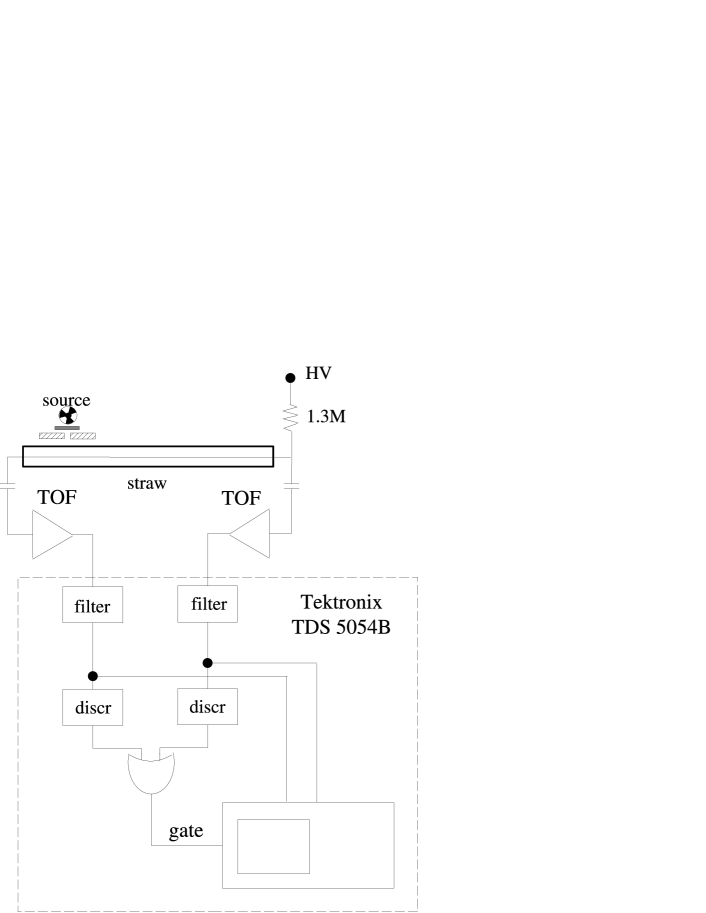
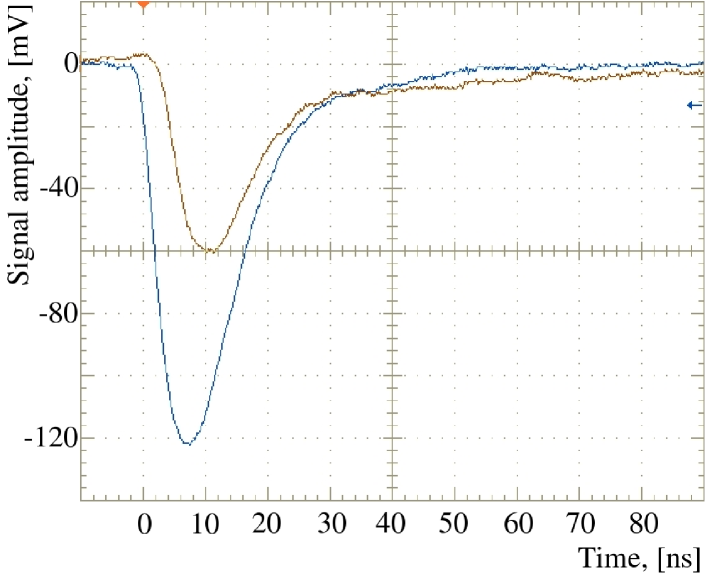
The signals at the both ends of the straw are read out by COSY-TOF experiment [3] type preamplifiers, attached directly to the anode wire feedthroughs. The amplifier outputs were connected to the Tektronix© 5054B oscilloscope, which was used for the data acquisition. In order to cut high-frequency noise the bandwidth of the oscilloscope was reduced to 20MHz, thus increasing the signal rise time from 3-4 ns to 10-15 ns (see Figure 5). The pulse decay time was about 40 ns. These preamplifiers are optimized for the drift time measurement and it can therefore be expected that optimizing the shaping characteristics of the preamplifiers should further improve the results presented below.
These signals were parametrized by the following equation
| (1) |
where the parameter is a scaling factor and the values of the other parameters were obtained from a fit to measured signals: , , and .
4 Linear Charge Asymmetry
The linear charge asymmetry due to charge sharing between the tube ends can be expressed as follows:
| (2) |
where is the actual position of the source along the straw tube with , is the real tube length, and are the charges collected on the left and right ends of the straw, respectively.
The effective tube length can be defined as follows:
| (3) |
Finally, the reconstructed longitudinal coordinate can be calculated in the following way:
| (4) |
The actual values of and depend on the ratio of the wire resistance to the input impedance of the preamplifiers, which were determined from calibration measurements.
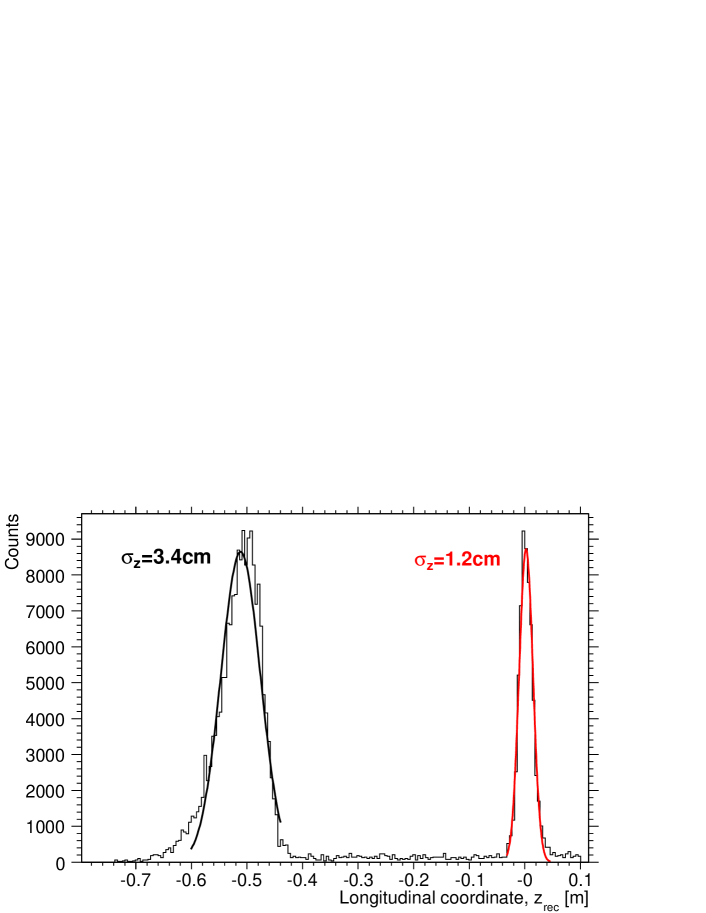
It should be noted that the definition of implicitly assumes that the input impedances of the preamplifiers and their relative gain are identical. To determine the amplifier characteristics, the collimated 55Fe source was placed exactly at the center (i.e. ) of the 1.05-m-long straw tube with the anode wire made of W/Re (97/3) alloy with a resistance of . The fitted mean value of the reconstructed position distribution was found to be cm compared to the expected value . After correcting the input impedances and gains of the preamplifiers, the mean value was reduced to mm, as shown by the right peak in Figure 6. The source was then placed at cm with respect to the tube center. The reconstructed source position was cm. The maximum observed deviation of was 2 mm, which is significantly smaller than the typical spatial resolution of about 1 to 3 cm (cf. Figure 6). This small deviation from the linear behavior is included as a systematic error below. Therefore, the longitudinal resolution (defined as the standard deviation of the Gaussian fit to the measured position distribution) is determined to be cm or % of the length in the center and cm or % at the end of the tube.
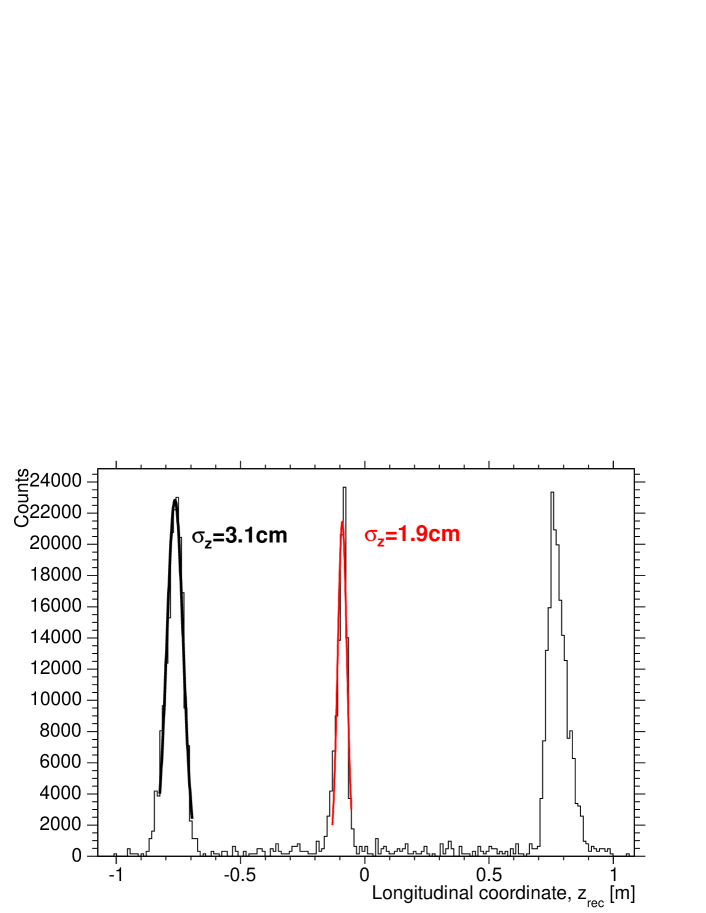
A 1.52-m-long straw tube with an anode wire made of W/Re (82/18) alloy was used for the further tests. This wire has a specific resistance of . The total resistance of the 1.52-m wire was 600. The increased resistance leads to a higher signal asymmetry and thus to a better relative spatial resolution. The 55Fe source was placed at three locations: cm and -8.0 cm. Figure 7 shows the spectrum after applying the calibration procedure. Longitudinal resolutions of cm (1.3%) and cm (2.1%) were determined near the tube center and at the end, respectively.
When using the charge division technique, the longitudinal spatial resolution improves when the signal asymmetry is increased because the resolution is dominated by noise. The noise can be separated into series and parallel components [4]. Parallel-noise components, such as RF-pickup or noisy power supplies, induce correlated signals of the same sign at both ends of the straw tube. Series noise induces either anticorrelated or uncorrelated signals in the preamplifiers, e.g. thermal noises in the anode wire and preamplifiers, respectively. Pure incoherent series noise will result in a constant spatial resolution along the anode wire. Pure anticorrelated series noise will have the poorest resolution in the center of the wire, and pure parallel noise will have the best resolution in the center of the wire.
5 Time-Dependent Charge Asymmetry
The time-dependent charge asymmetry is a novel method to determine the longitudinal coordinate, and it differs from the linear charge asymmetry by taking into account not only the signal charges but also the differences in the arrival times of the signals, allowing for a significant increase of the asymmetry magnitude up to the maximum value of 1.
Technically, this is done by integrating both signals in a narrow gate starting after the arrival of the first signal, as shown in Figure 8.
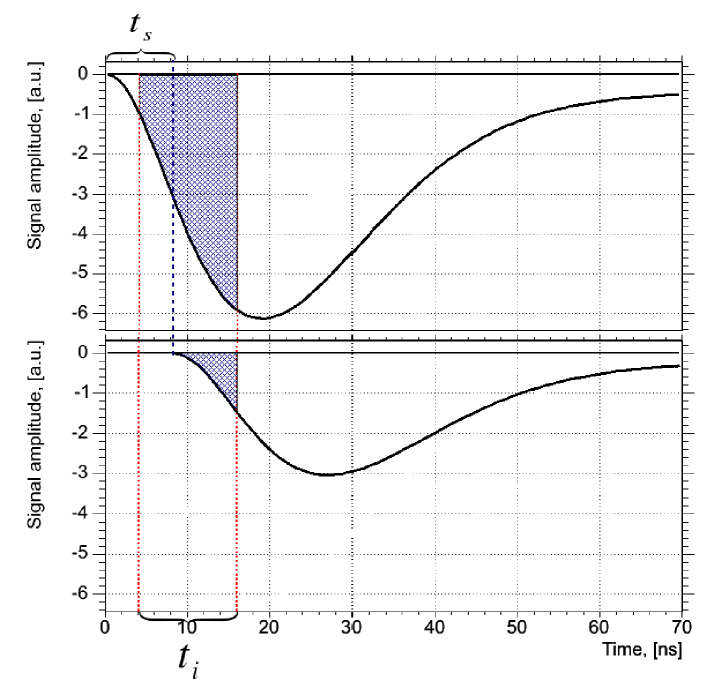
The signal from the far end of the tube is shifted by due to the longer propagation time. Both signals are integrated during the time . As can be clearly seen from Figure 8, a larger fraction is integrated for the signal arriving first. It should be noted that must be larger than the maximum , otherwise the correlation between the coordinate and asymmetry becomes ambiguous.
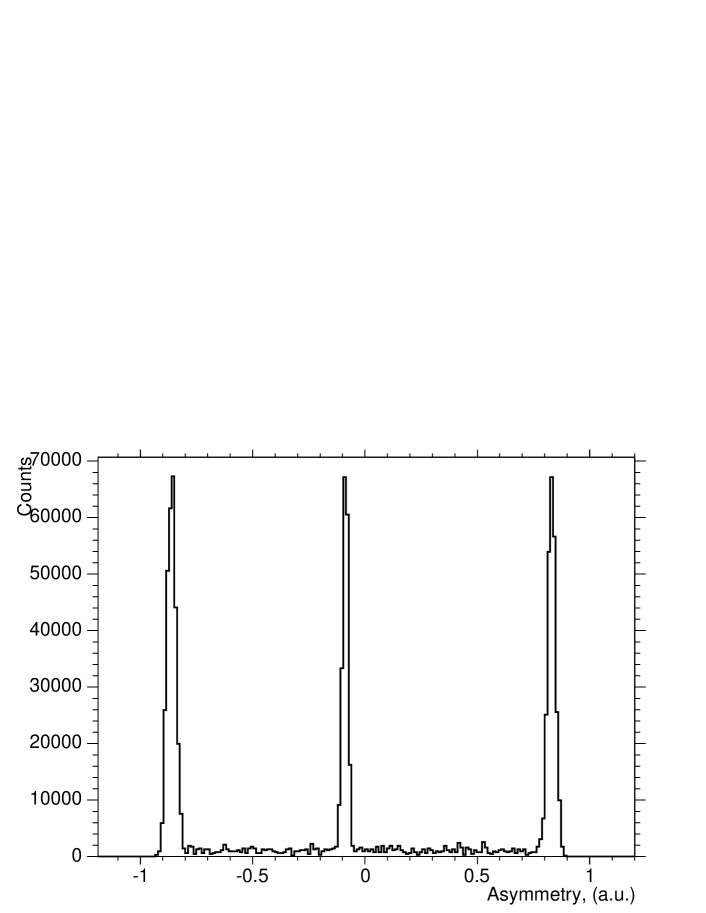
A plot of the time-dependent asymmetry for the -m straw tube with the W/Re (82/18) wire is shown in Figure 9 for an 55Fe source located in three places (cm, -8.0 cm). From this figure it can be seen that the amplitude of the time-dependent asymmetry is much higher than for the linear asymmetry, where the maximum amplitude only reaches values of about for this straw tube.
Conversion of the time-dependent asymmetry into the longitudinal position, however, requires attention because the dependence between the asymmetry and the position is no longer linear, as illustrated in Figure 10.
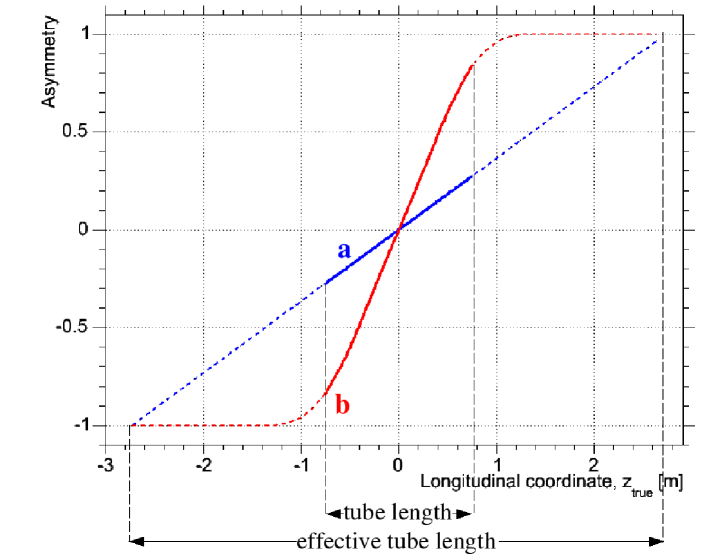
The time-dependent asymmetry shown in this figure (curve (b)) was computed numerically by the following method. Equation 1 was used to represent the shape of the signals from the straw tube. The amplitudes of the signals at each end of the tube were determined for an arbitrary position of the source using the linear charge asymmetry (curve (a) in Figure 10) for an effective tube length of 546 cm. The arrival time difference was calculated for each point using the signal propagation speed along the straw tube, which was measured to be cm/ns. Charges obtained by integration of these signals during the integration time were inserted into Equation 2. The best resolution was obtained for equals 10 ns.
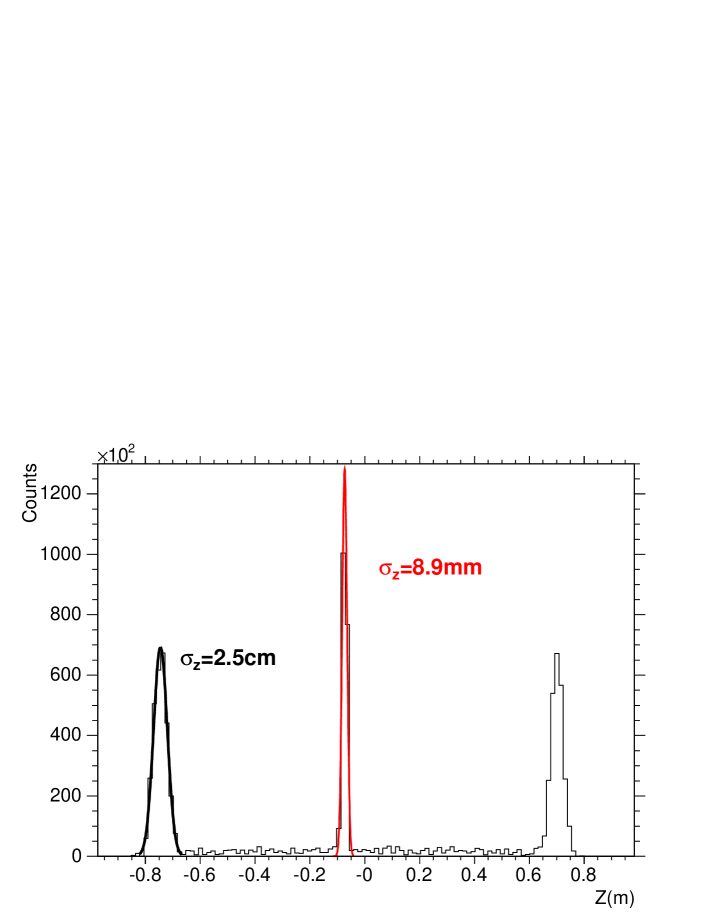
The curve obtained for the time-dependent charge asymmetry was used to convert the measured charge asymmetry (see Figure 9) into the longitudinal position shown in Figure 11. Longitudinal position resolutions of cm (0.6%) and cm (2.0%) were determined at the tube center and end, respectively. The systematic error increases towards the ends of the tube compared to the region near the tube center because of the non-linear dependence of on the measured asymmetry.
Overall, the longitudinal position resolution is significantly improved compared to the linear charge asymmetry (cf. Figure 7).
The longitudinal position resolution is improved in those regions where the slope of the time-dependent asymmetry as a function of is steeper than the slope of the linear method. Since the functional dependence of the asymmetry on is non-linear (see Figure 10), the improvement in the position resolution varies along the length of the straw tube. This is illustrated graphically in Figure 12, which shows the ratio of the slopes for the time-dependent and the linear asymmetries.
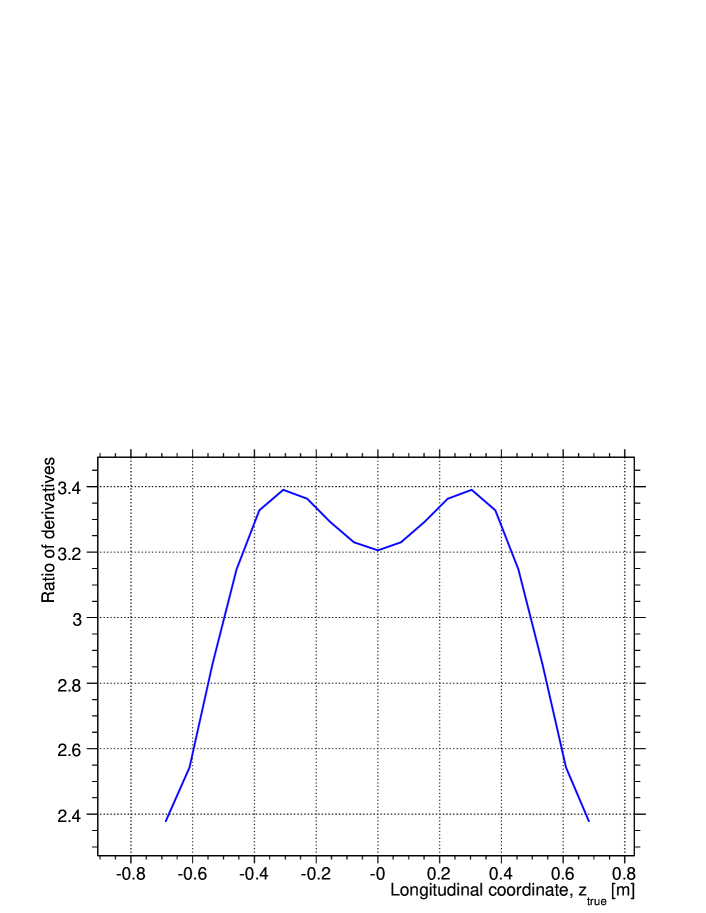
The time-dependent asymmetry gives a better position resolution in the region where this ratio is greater than 1. Ratio of the derivatives increases for decreasing integration time, thereby improving the longitudinal position resolution. However, at the same time both the non-linearity and the relative preamplifier noise increase, thereby worsening the resolution. Thus, the integration time is determined by optimizing the longitudinal position resolution of the straw tube.
6 Test with Source
To study the applicability of this method to a realistic detector response, a collimated radioactive source was used to produce signals from minimum ionizing particles (MIPs). The average number of electrons arriving at the same moment at the anode wire is much smaller for MIP tracks compared to the clusters of ionization produced by the source. Therefore, the average signal amplitude from the straw tube is significantly smaller. In addition, the signal fluctuations are much higher due to the nature of the MIP ionization. This leads to a deterioration of the relative errors of the signal charge determination. To compensate these effects and improve the signal-to-noise ratio, the integration time should be increased. In this case, the position resolution was optimized with 20 ns.
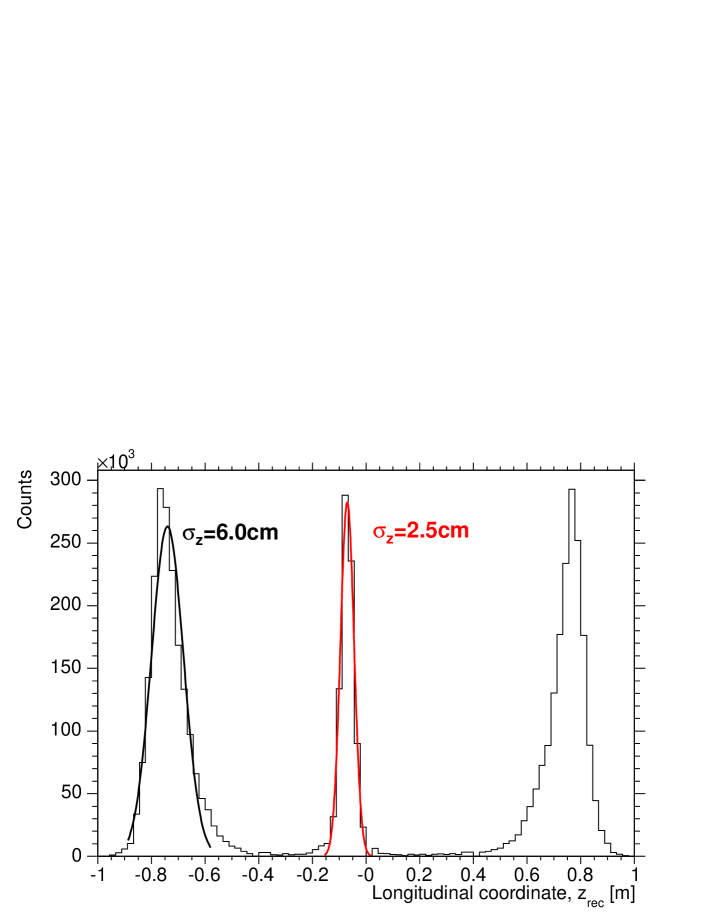
Figure 13 shows the distribution when the straw tube is irradiated at cm and -8.0 cm. The observed resolutions for near the center and at the end were found to be cm (1.8%) and cm (4.0%), respectively.
7 Summary
Prototype straw tube detectors for the upcoming ANDA experiment have been assembled and tested. The longitudinal position resolution of a tube was investigated using both the linear charge division and the time-dependent asymmetry techniques. By adding the time information to the standard charge division method a significant improvement in the precision of the position reconstruction along the straw tube was demonstrated.
The longitudinal position resolution in the center and at the end of the -m straw tube, irradiated by the 55Fe radioactive source, was determined as cm (1.2% of the tube length) and cm (2.0%), respectively, with a maximum deviation from linearity of about 0.8 cm (0.5%) using the asymmetry of the fully integrated signal charges at both ends of the straw tube. By additionally using in the relative signal arrival time information, it was possible to improve the resolution and the linearity to 0.89 cm (0.6%) and 0.2 mm (0.1%) near the tube center and to 2.5 cm (1.7%) and 1.0 cm (0.7%) at the tube end, respectively. The resolution with a source is poorer because of the smaller signals and larger fluctuations for the minimum ionizing particles. The longitudinal position resolution in the tube center is cm (1.7%) deteriorating to cm (4.2%) at the end of the tube. The maximum deviation from linearity was about 1.2 cm (0.8%).
In addition to the improved resolution, the time-dependent charge asymmetry has the advantage that very short integration times can be used with fast shaping amplifiers, thus permitting higher rate capabilities. Also, an acceptable position resolution can be achieved even for anode wires with relatively small resistance.
It is expected that the results obtained here can be improved since the preamplifiers used were optimized for time resolution in order to determine the transverse coordinate. Further studies are ongoing to optimize the signal shaping parameters of the preamplifier for both the timing and charge integration performance.
The results obtained show good prospects for using time information to improve the precision of the charge division measurement.
References
- [1] M. Kotulla et al., PANDA Technical Progress Report, Darmstadt 2005, http://www.ep1.rub.de/~panda/archive/public/panda_tpr.pdf
- [2] Lamina Dielectrics Company, UK. http://www.laminadielectrics.com
- [3] P. Wintz et al., in AIP conf. Proc., volume 698, page 789, 2004.
- [4] A. Pullia et al., IEEE Trans. Nucl. Sci. 49,3269, 2002.