Search for Low Mass Exotic Baryons in One Pion Electroproduction Data Measured at JLAB
Abstract
This paper aims to give further evidence for the existence of low mass exotic baryons. Narrow structures in baryonic missing mass or baryonic invariant mass were previously observed during the last ten years. Since their existence is sometimes questionable, the structure functions of one pion electroproduction cross sections, measured at JLAB, are studied to add informations on the possible existence of these narrow exotic baryonic resonances.
pacs:
25.30.Dh, 14.20.Gk, 13.60.Rj, 13.40.-fI Introduction
This paper is dedicated to a reanalysis of existing data on one pion electroproduction cross sections measured at JLAB.
Although observed in several reactions and in different kinematical conditions,
the narrow low mass baryonic structures are sometimes considered with skepticism. Indeed a few dedicated experiments were not able to observe them. This result will be discussed below. In order to disentangle that situation, it is necessary to study new
data
obtained with a fairly good resolution. The one pion electroproduction cross sections,
measured at JLAB, are, in principle, appropriate for such study. This study is significant since these
structures - if any - will be exotic.
Several reasons plead in favor of their exoticism:
- their widths, typically of the order of FWHM10 to 20 MeV are much smaller
than the widths of PDG (Particle Data Group) or resonances,
- the first resonances have a mass lower than the pion production threshold mass,
- there is no room for these resonances, in the mass range discussed here, within the
many-quark models for baryons if we consider only configurations caps .
In the second section, the results for narrow low mass baryonic
structures, mainly observed in SPES3 (Saturne), are recalled. Their
masses are compared to a careful scrutiny of many different data,
obtained by different collaborations, for different physical studies, with
hadronic as well as leptonic probes. The cross sections of the structure functions,
from backward
electroproduction on protons, measured by the Hall A Collaboration lave2
are considered in sections III.A. Data on the structure functions
from the epe’n reaction, measured by the CLAS Collaboration egiy
in Hall B,
are discussed in section III.B. The results of the present analysis are discussed in section IV, and the paper is concluded in section V.
As mentioned above, narrow structures were observed more often in experiments using incident hadrons than with incident leptons. In the spectra of the reaction epe’X0 studied jiang at JLAB (Hall A), no significant signal was observed in the range 0.97M1.06 GeV. In a high-resolution experiment studied at MAMI kohl , no narrow nucleon resonance below pion threshold was observed in the H(e,e’)X or D(e,e’p)X reactions. No low-lying exotic baryons (at masses M=1004 and 1044 MeV) were observed at TRIUMF zoln in a double radiative pionic capture on hydrogen. These three dedicated experiments looked at narrow baryonic structures with masses below the pion production mass. The absence of signal in these experiments using incident leptons, can be related to the fact that these narrow structures may have a small coupling to nucleon, their excitation being favored for reactions involving two baryons (for example excitation through intermediate dibaryons).
The lack of observation of narrow baryonic structures below pion production mass, constitutes a further reason to look at data obtained with incident leptons, concerning the mass range above pion production threshold.
II Recall of already published data showing the existence of narrow low mass baryons
Previous experiments, performed at SPES3 (Saturne), thanks to good resolution and high statistics, exhibit narrow structures in different hadronic masses. Only results concerning baryons will be discussed here. Two reactions:
| (1) |
and
| (2) |
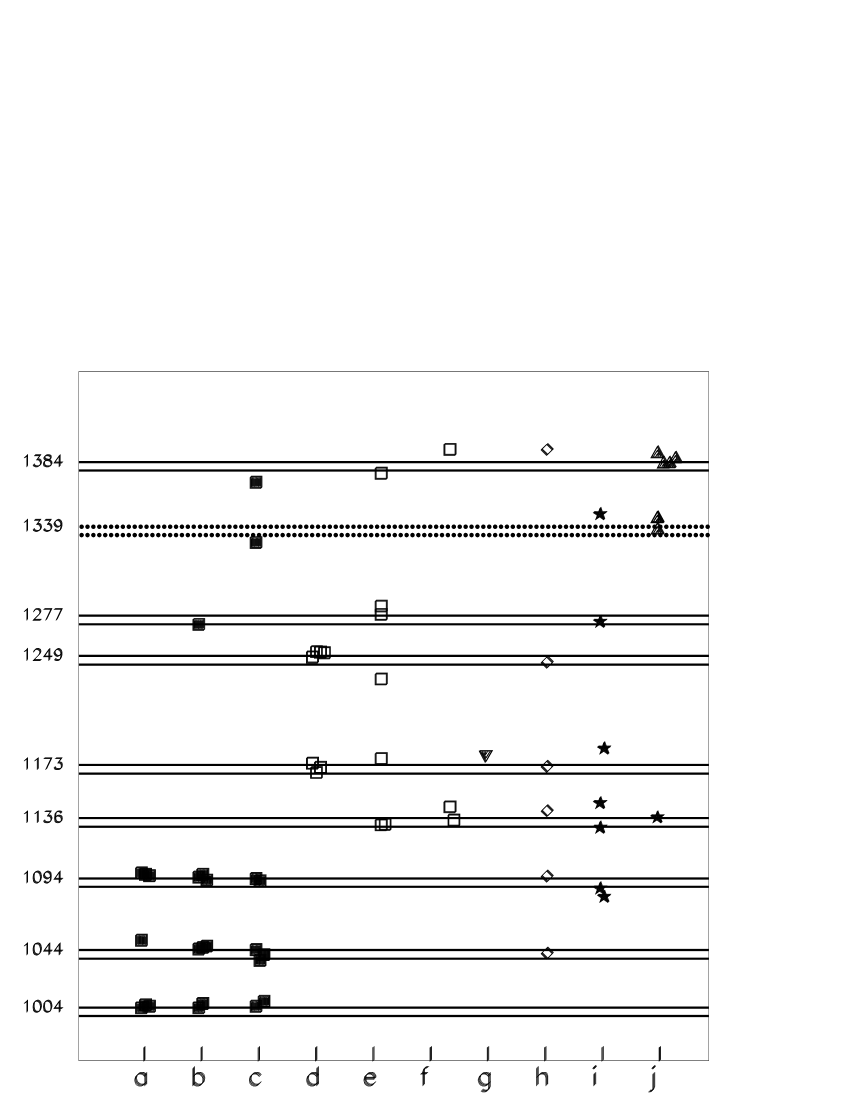
were studied. Structures were observed in the missing mass MX of reaction (2) bor1 and in the invariant mass MpX of reaction (1) and in the invariant masses M and M of reaction (2) bor2 . The observation in different conditions (reaction, incident energy, spectrometer angle, or observable) at the same mass (within 3 MeV) was considered a confirmation of their existence. This is summarized in Fig. 1 of Ref. bor2 in the mass range 1.0M1.4 GeV. In the figure, columns (a) to (f) correspond to different variables or incident energies of reaction (2), columns (g) and (h) correspond to reaction dpppX at two different incident energies bor2 , column (i) describes data from np reaction studied at MAMI zab and column (j) to data from pn reaction studied at Bonn dann . The narrow structures masses observed are: 1004, 1044, 1094, 1136, 1173, 1249, 1273, 1339, and 1384 MeV.
Additional signatures of narrow baryonic structures, were observed either in dedicated experiments or extracted from cross sections obtained and published by different authors studying other problems. They are quoted in bor1 and bor2 and will not be recalled here.
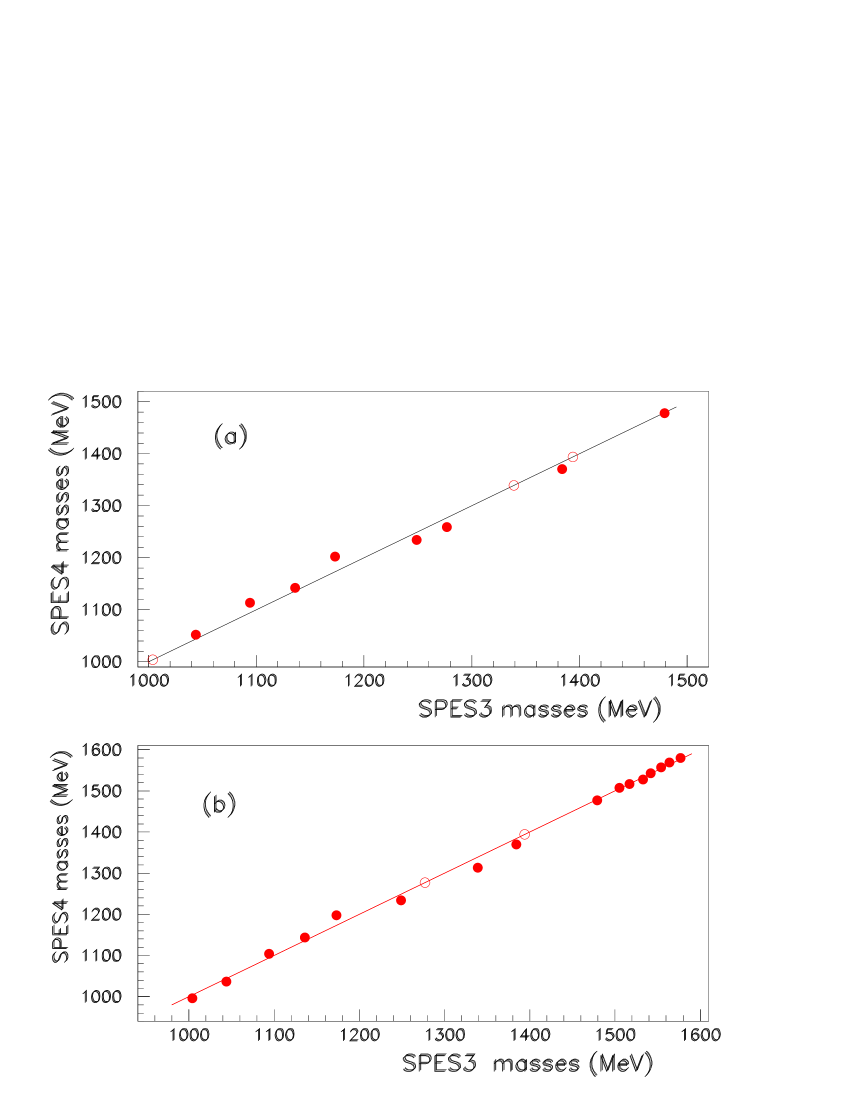
Precise spectra of the p(,’)X reaction were obtained at SPES4 (Saturne) in order to study the radial excitation of the nucleon in the P11(1440 MeV) Roper resonance. The measurements were done using a Tα=4.2 GeV incident beam. The spectrum at =0.80 was published in mor1 and the spectrum at =20 was published in mor2 . A first large peak around M1130 MeV (240 MeV), was associated to the projectile excitation, and a second large peak around M1345 MeV (510 MeV), was associated to the target excitation. Above them lie narrow peaks bor3 , characterized by a large number of standard deviations, since the highest channel at =0.80 contains approximately 2.5104 events (see Fig. 2 and 3 ). These structures were not discussed by the authors. A detailed discussion of the spectrometer and of the detection performances was given in bor3 and will not be repeated here as well as the checks performed and the final precision obtained. Figs. 2 and 3 show the spectra. Table 1 gives the correspondance among the letters naming the structures, their masses and the masses of the corresponding structures extracted from SPES3 data. Such correspondance is illustrated in Fig. 4.
Finally we list, in the mass range studied here: 1.1 M 1.56 GeV, eight narrow masses at M=1136, 1173, 1249, 1273, 1339, 1384, 1480, and 1540 MeV. A well separated structure at M=1479 MeV was extracted from ppppX and pppp reactions bor2 . Several other structures were extracted in the same work, at larger masses, but with a too small separation to be seen in the two lower resolution experiments of one pion electroproduction on proton, considered in the present work.
III Analysis of one pion electroproduction structure function cross sections measured at JLAB
The reactions and have been measured at different kinematical conditions.
The differential cross sections are expressed by the following equation guich :
| (3) |
The , , , and structure
functions are bilinear combinations of the helicity amplitudes, depending
only on the variables Q2, W, and . is the transverse part of
the cross section, is the longitudinal part of the cross section, and
and are interference parts.
is the polar angle between initial and final protons, in the CM system defined
by the final proton and missing particle .
=[1+2(1+)tan is the polarization
parameter or the virtual photon polarization. =Ei - Ef is the energy transfer.
Q2=4 EiEfsin/2= is the
four momentum transfer squared. M is the proton mass and
W=[M2 + 2M - Q is the mass of the hadronic system. The structure functions
are plotted versus W. is the azimuthal angle between the leptonic and the
hadronic planes.
The structure functions , , and the linear combination were obtained by fitting the dependence of
the cross section to a function of the form:
| (4) |
They are described
theoretically by the phenomenological MAID model maid .
The MAID model uses an effective Lagrangian approach to calculate the Born
background, including and meson calculations. The
background is unitarized in the K-matrix approximation. The resonant
amplitudes are determined by fitting the world pion production data.
The MAID2003 model is a fit to predominantly p channel.
The MAID calculations describe the main shapes of the structure functions, especially at small angles.
We compute MAID using all baryonic resonances from (1232) up to (1950) maid , although the last ones lie outside the range of study. The calculation holds background, resonances and interferences between both.
MAID contains the experimental phase shifts and includes most of the known physics, in electroproduction processes. Therefore, in order to enhance the physics which is not contained in MAID, we build the difference between the experimental spectra and the MAID results. The figures show that such difference exhibits narrow structures located at similar masses. Then, we fit the results of the subtraction of data from MAID. Interferences
between these small eventual structures, and the background and broad resonances exist.
Since the amplitudes of broad PDG resonances (and Born background) vary little in the smaller range of each narrow resonance, the extracted position of these narrow resonances should be not much affected by these
interference terms. Such effect exist in all experiments since these resonances lie always above other physics and background. However it was observed, see Fig. 1, that the masses observed were quite stable.
The fits shown are obtained using gaussians and masses given in previous section, namely
those extracted from previous experiments. No attempt is done to adjust any mass. The
width also is taken,
arbitrarily, to be =24 MeV, in both reactions, without any attempt to adjust it.
The experimental statistical errors are kept as errors for the data minus MAID values. In some cases, the large error bars prevent to give firm confidence on the peak extractions which
were only done in view of consistency.
In these experiments, the masses below pion production cannot be observed. Also the
structure at M=1094 MeV is missing since the data start at M=1110 MeV.
When and structure functions are
interference terms, with possible positive and negative values, the third structure function:
is positive, since obtained by the square of
amplitudes. This is the case for data and for MAID results. However the difference between both
involve interference terms between ”classical amplitudes”, described by MAID, and new
amplitudes from narrow baryons which existence is discussed. Therefore, after the
difference, the result of this structure function
can be negative. We suppose that the amplitudes of the Born background and broad
resonances vary slowly in the range of narrow resonances. This justifies, as already pointed out, the statement that
our procedure should exhibit narrow peaks, if any, close to their genuine masses.
III.1 The pp reaction
The backward cross sections of the structure functions of the pp reaction were measured by the Hall A Collaboration lave2 at four angles and at Q2=1 GeV2.
III.1.1 The structure function
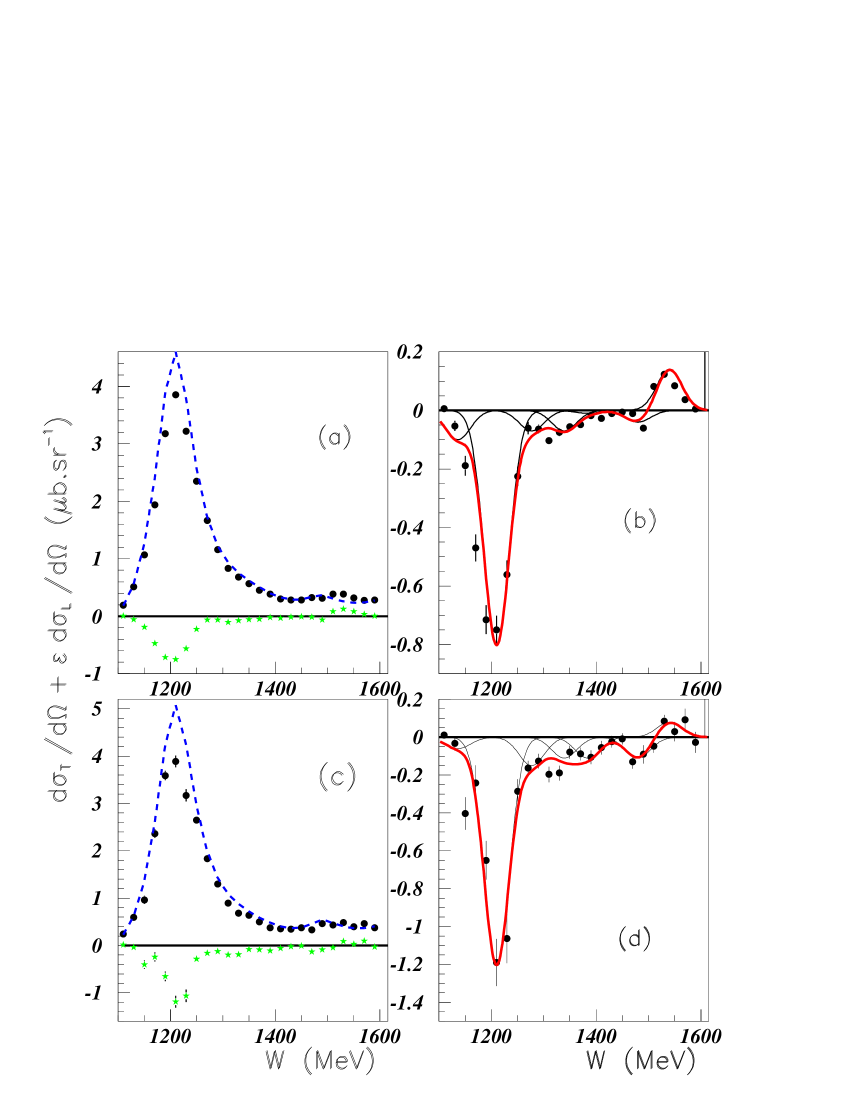
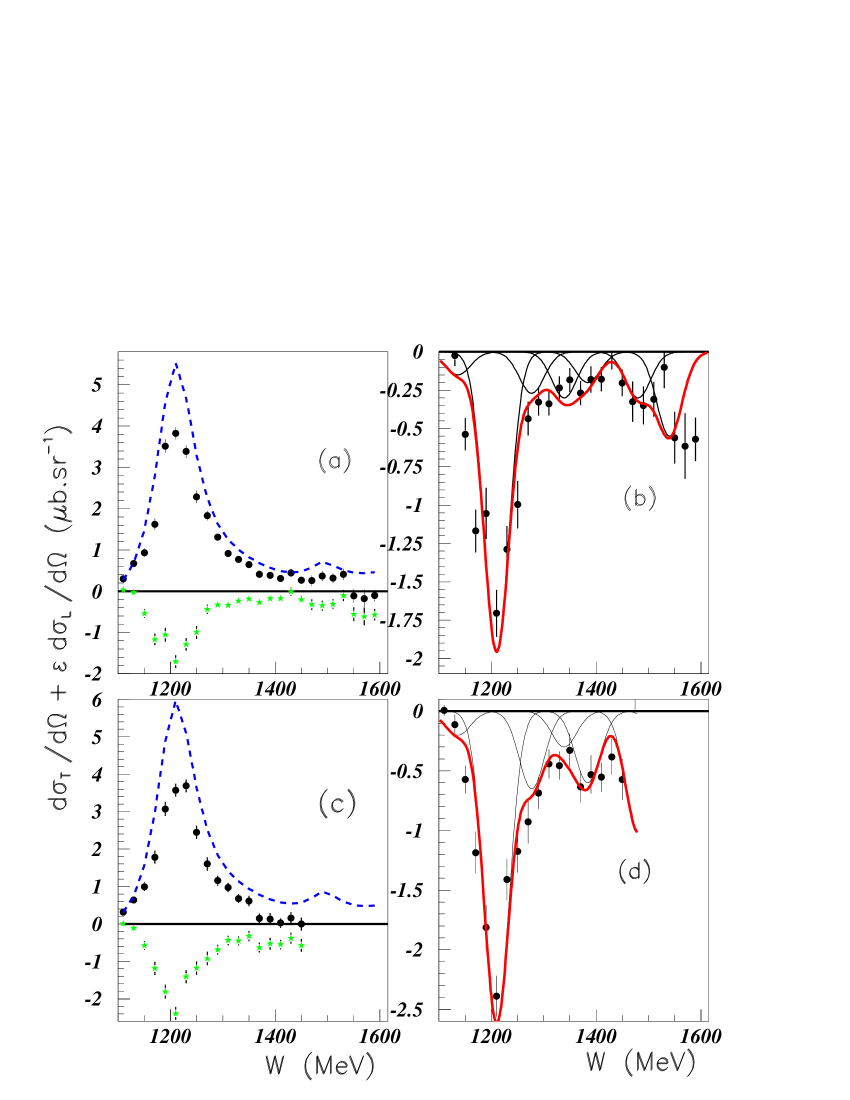
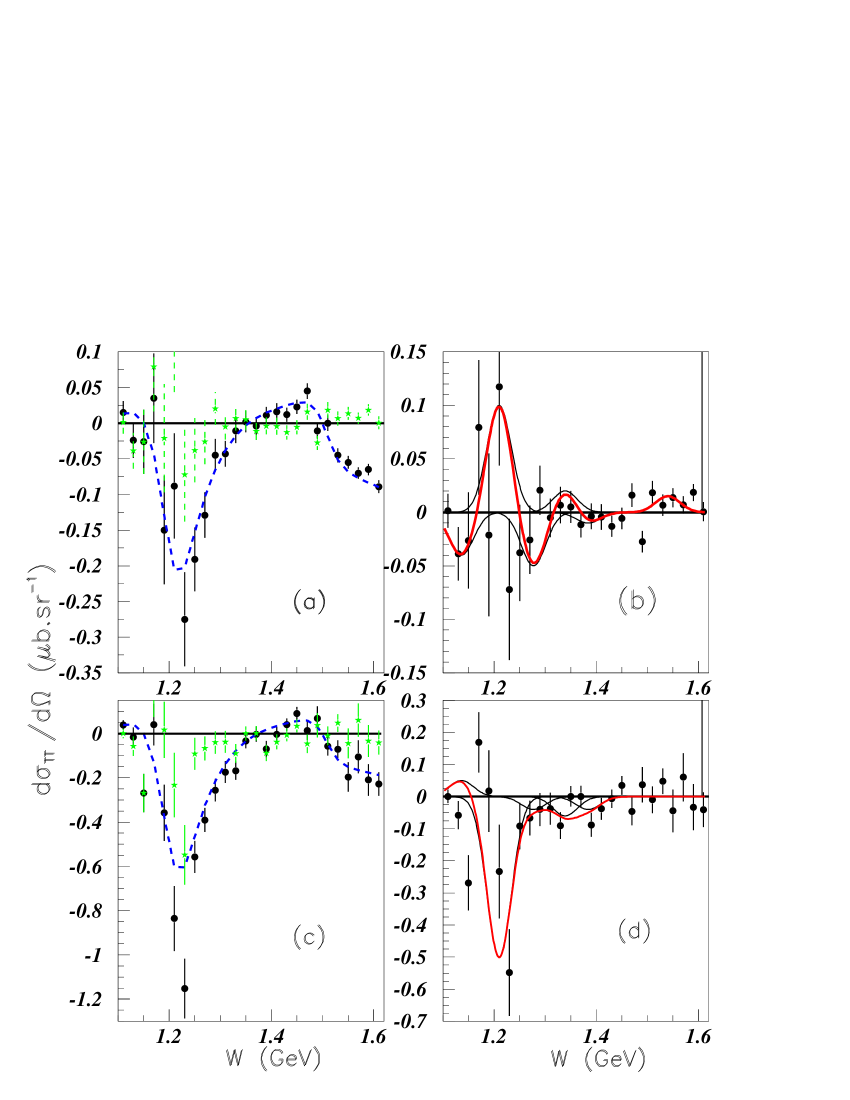
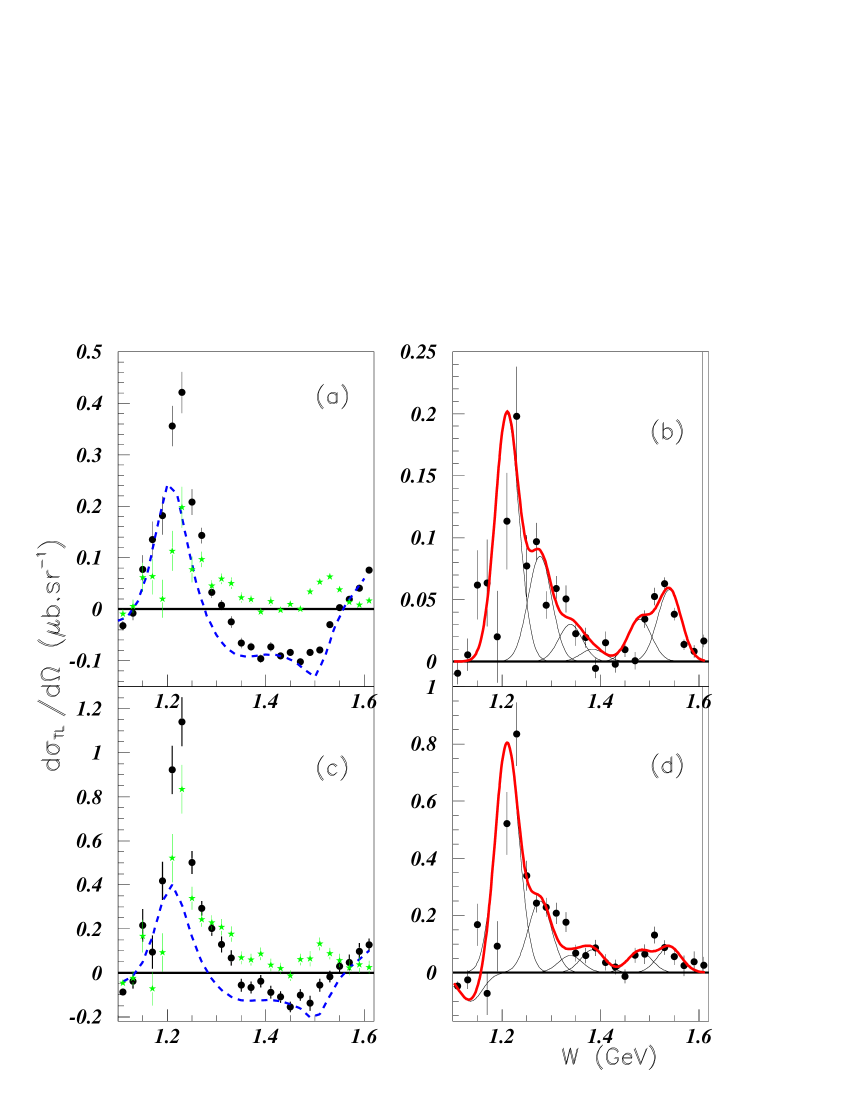
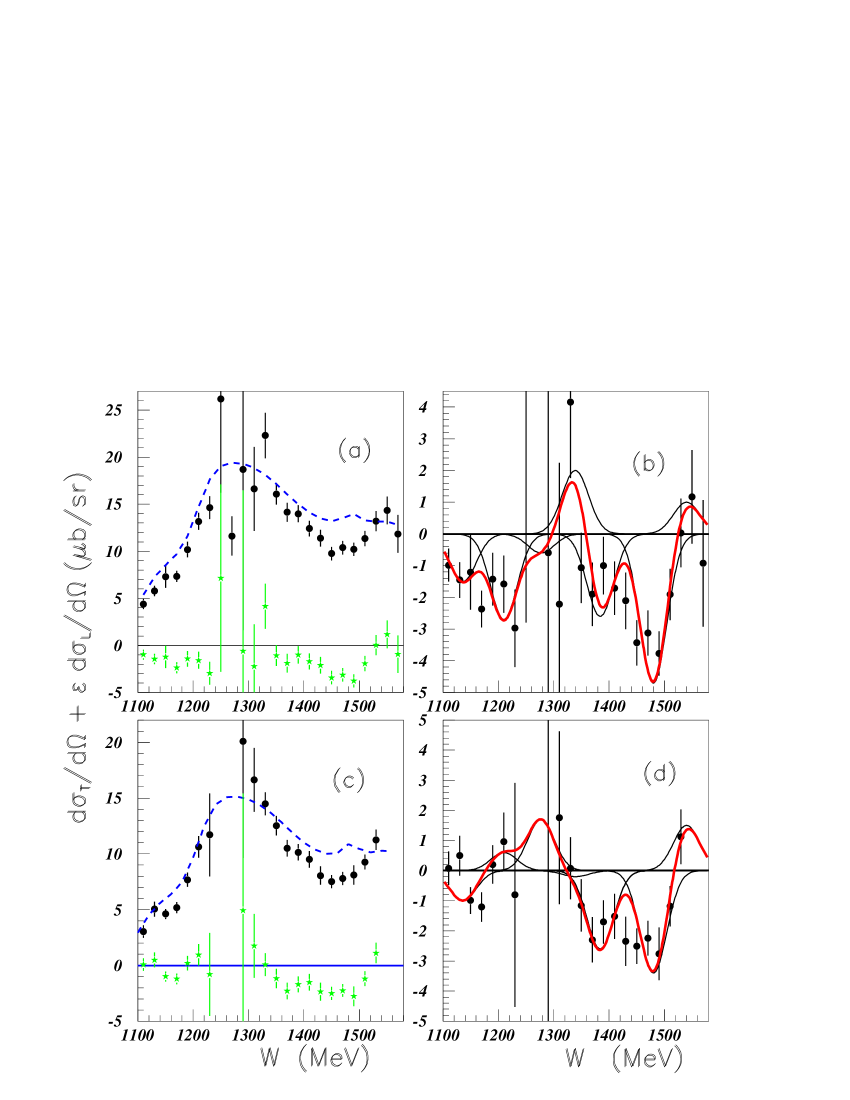
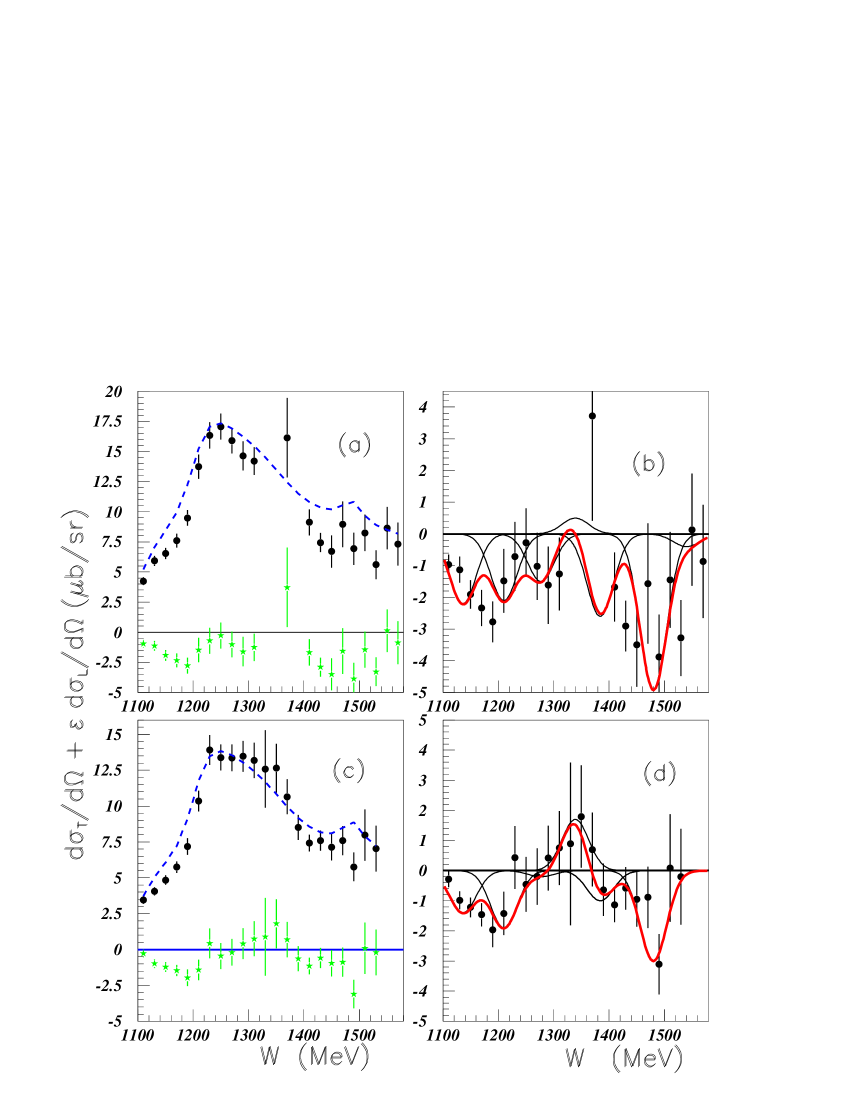
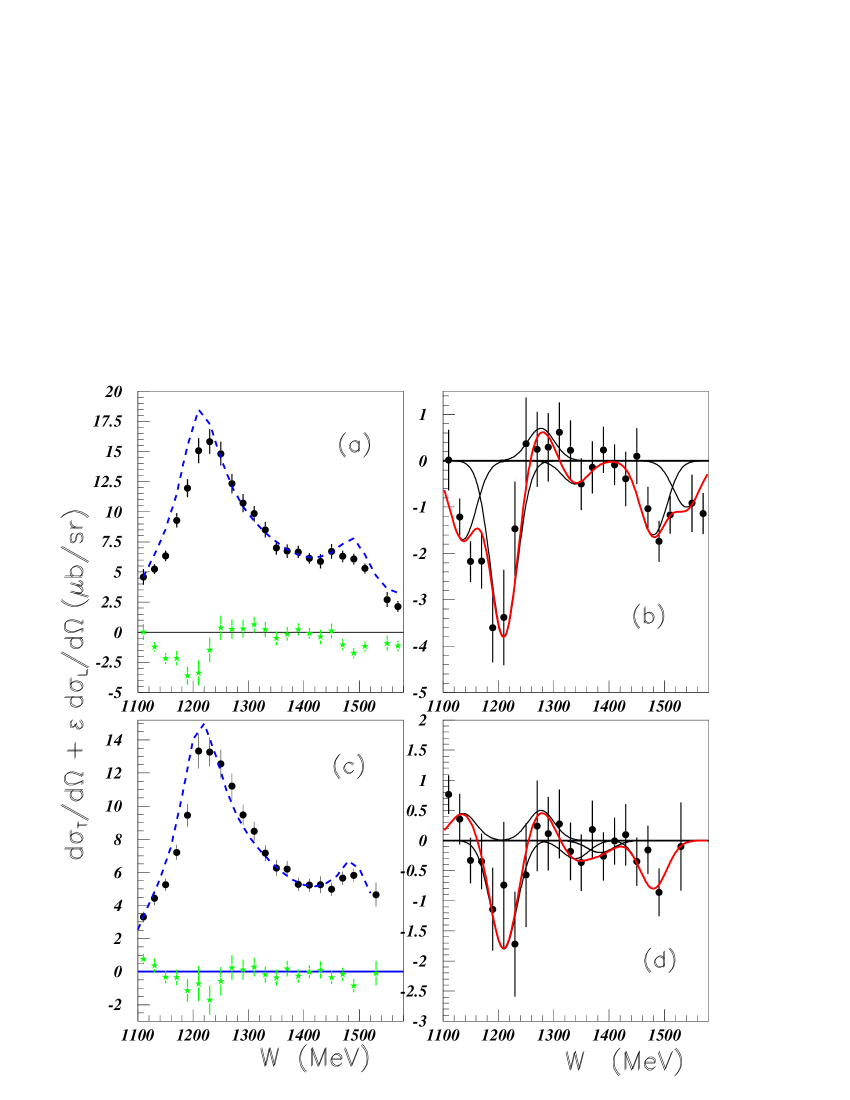
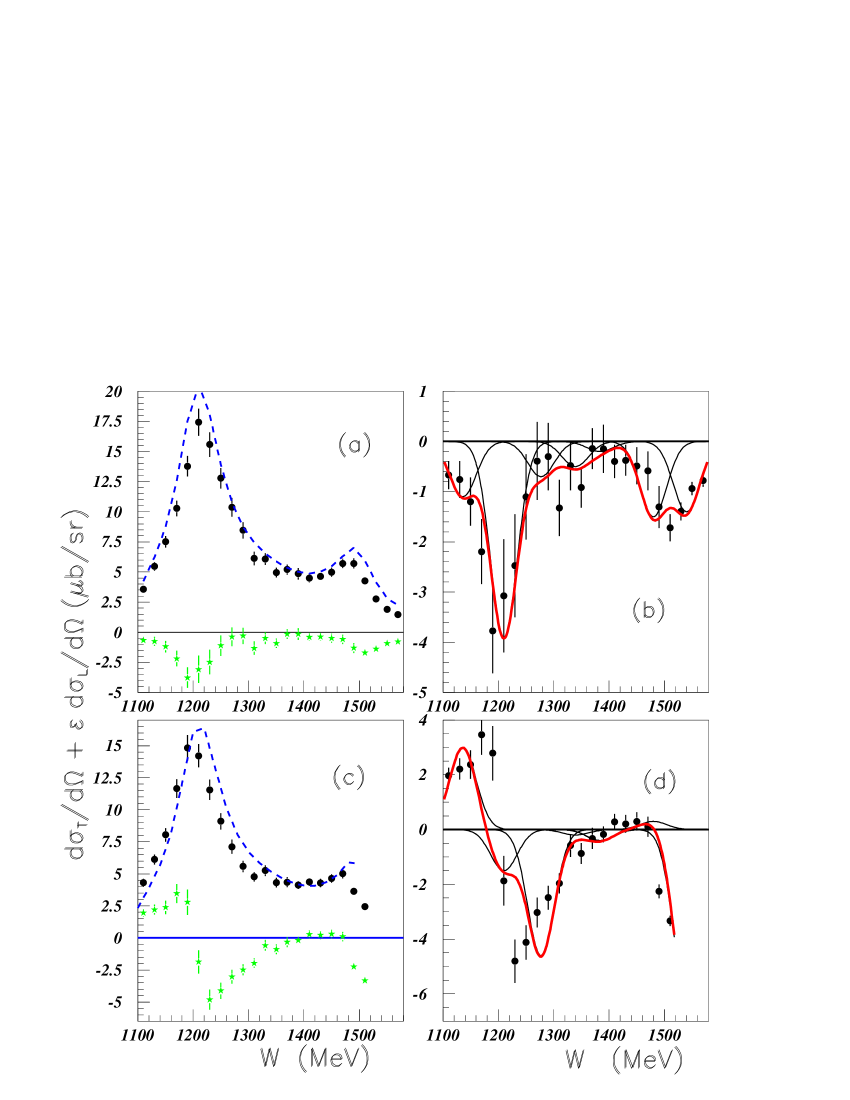
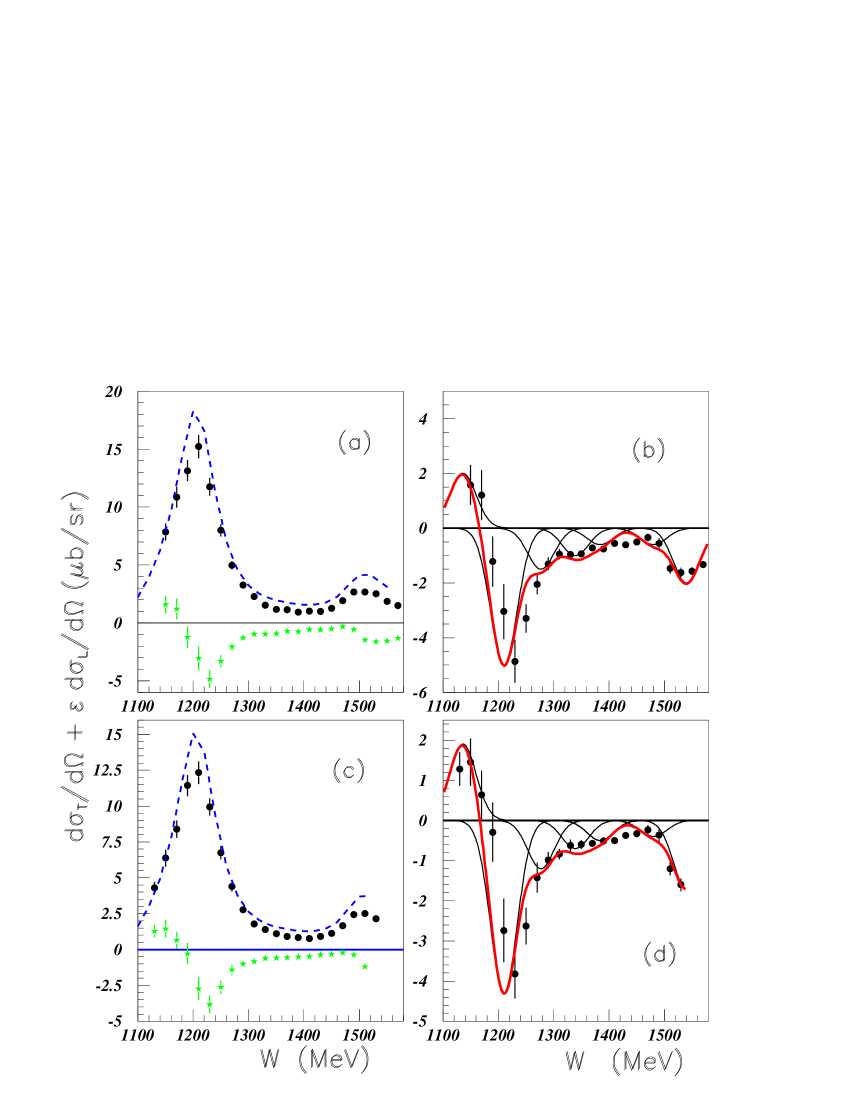
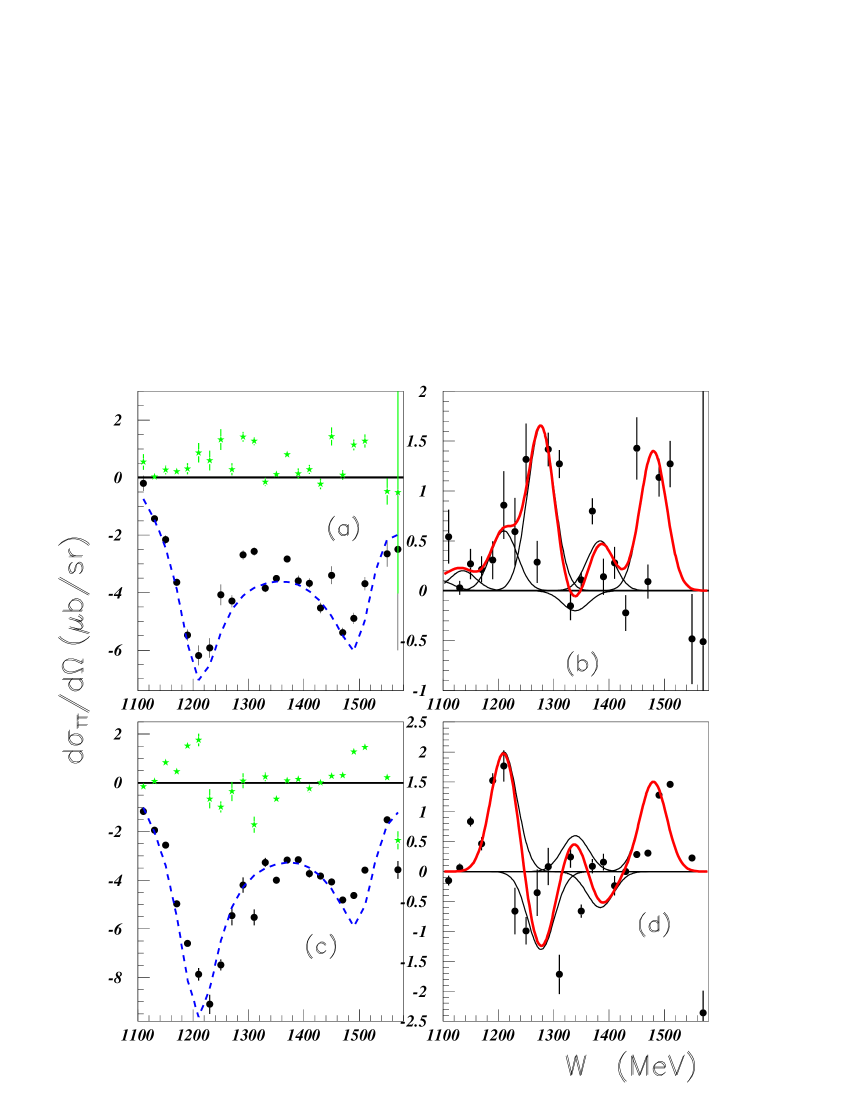
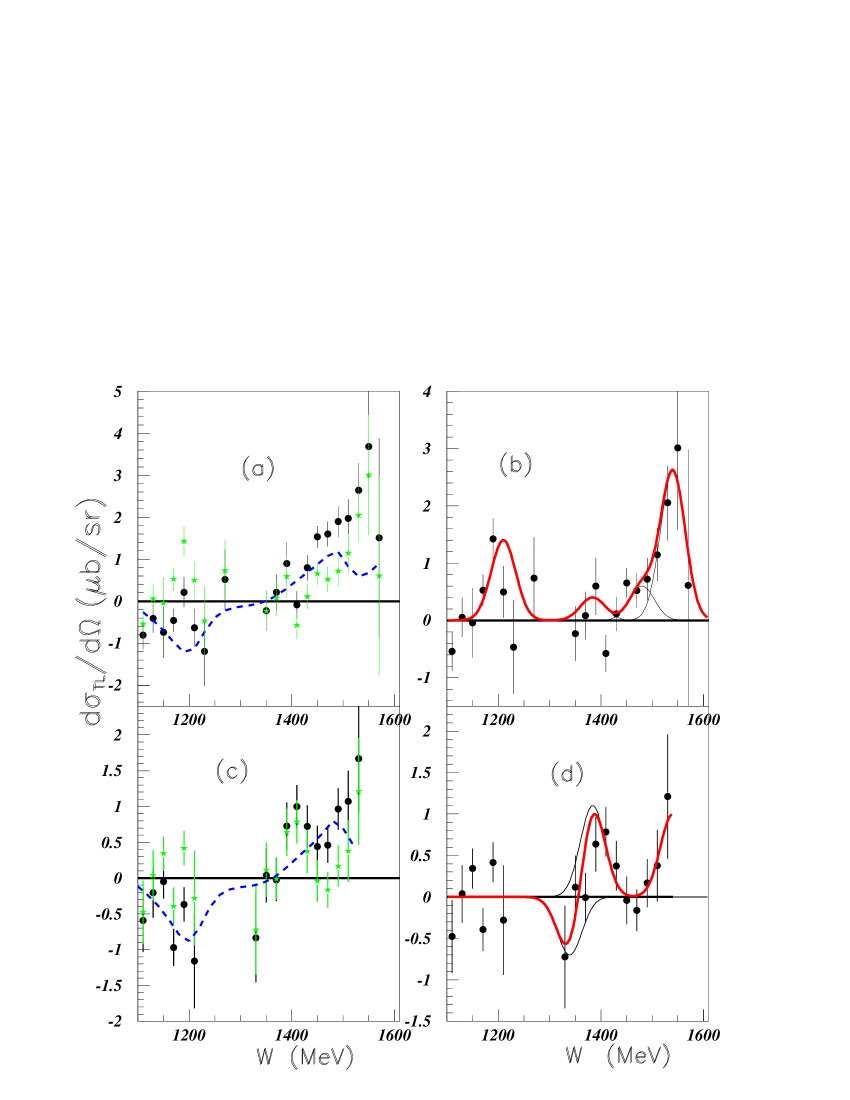
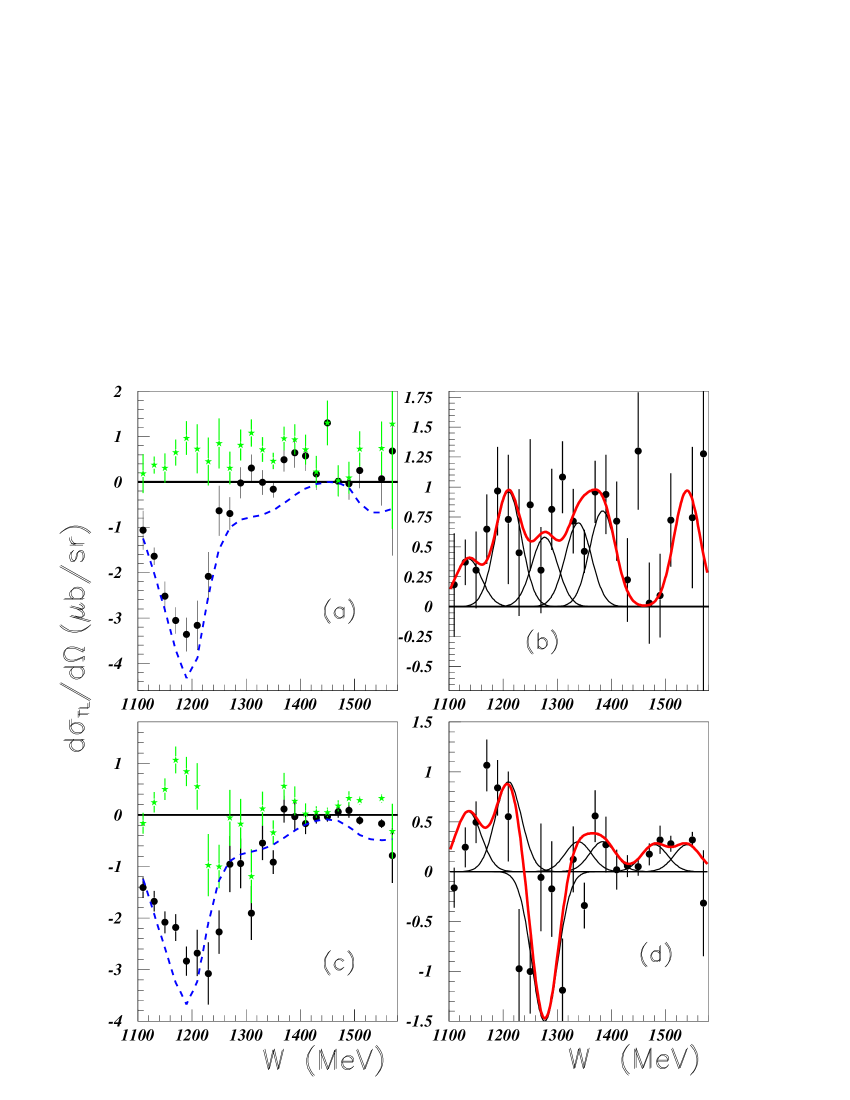
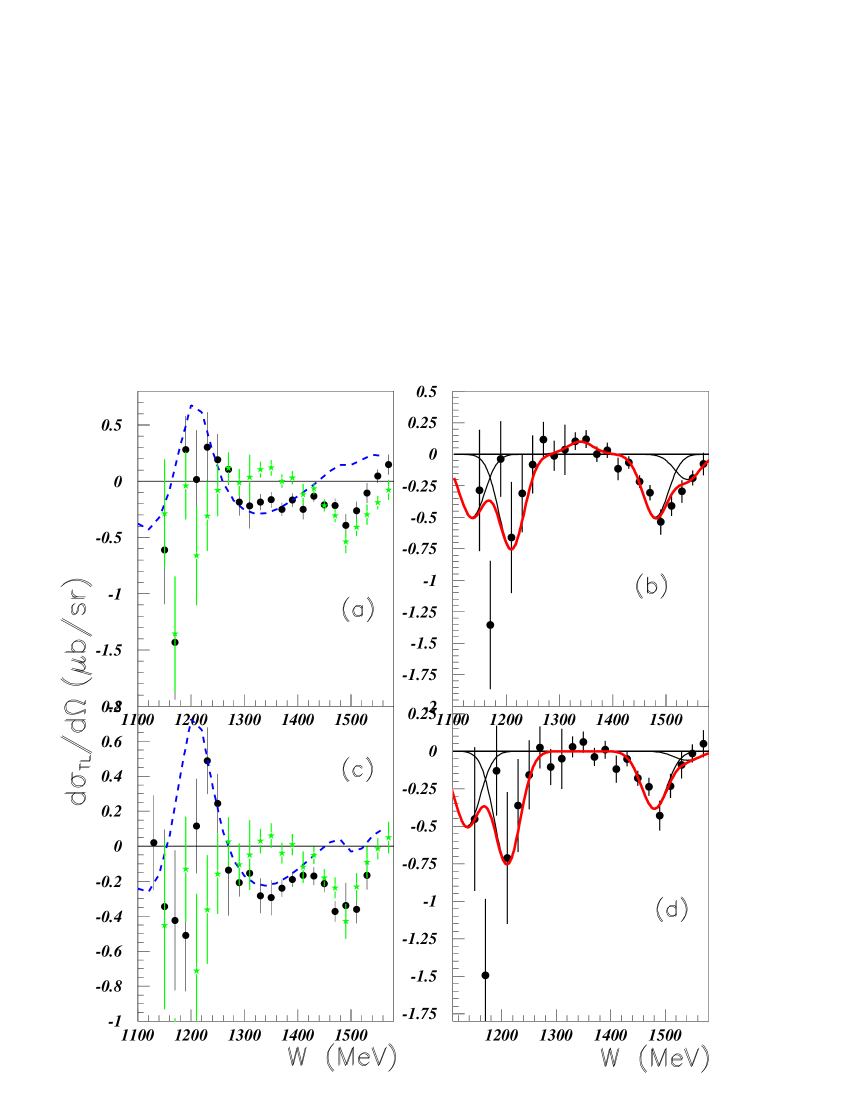
Fig. 5 shows the structure function at =167.160 in inserts (a) and (b) and at =157.670 in inserts (c) and (d). Inserts (a) and (c) show the data (full circles) the MAID results (dashed curves) and the difference (full stars). Inserts (b) and (d) show the previous difference (full circles), the peaks for individual masses and the total spectrum obtained with assumption of no interference. At both angles a large peak is observed at a somewhat larger mass (M1200 MeV instead M=1173 MeV). A narrow structure at M1540 MeV is well defined in insert (b). Fig. 6 shows the corresponding results for =155.050 in inserts (a) and (b) and at =145.590 in inserts (c) and (d). We observe that the quality of the fit with MAID, at backward angles, gets spoiled when the angles decrease.
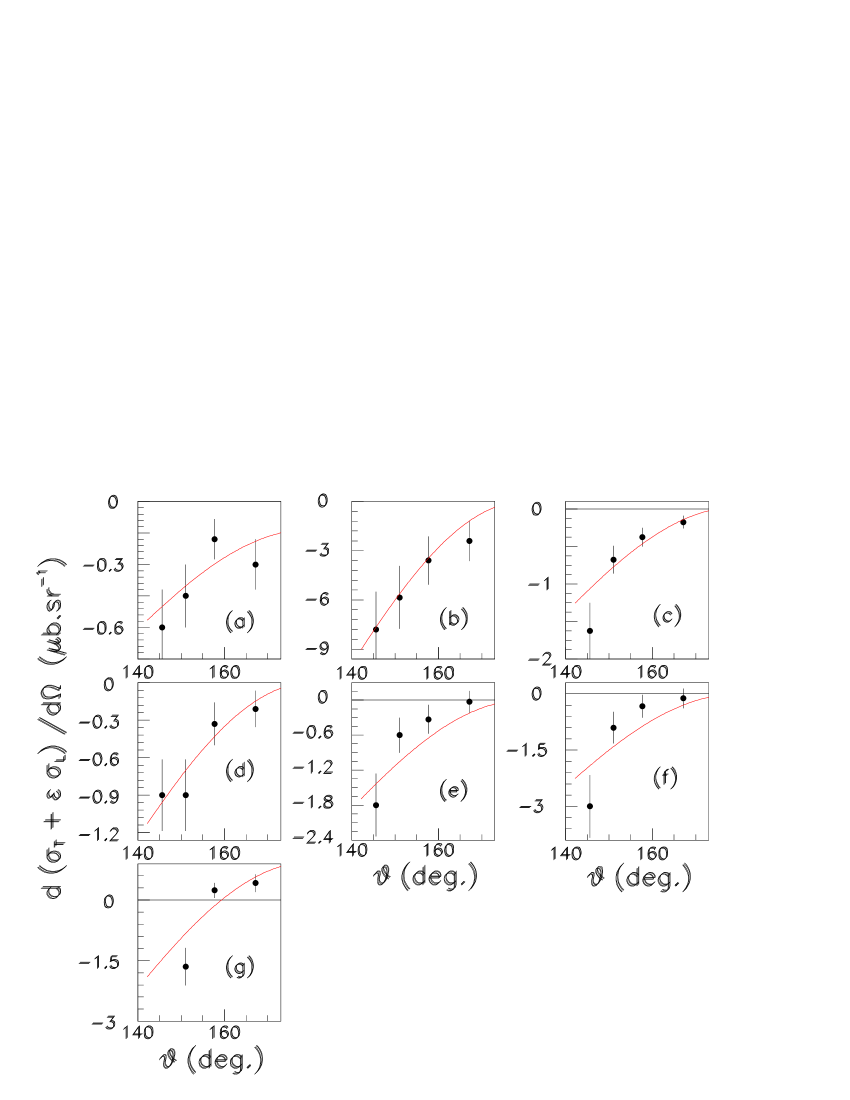
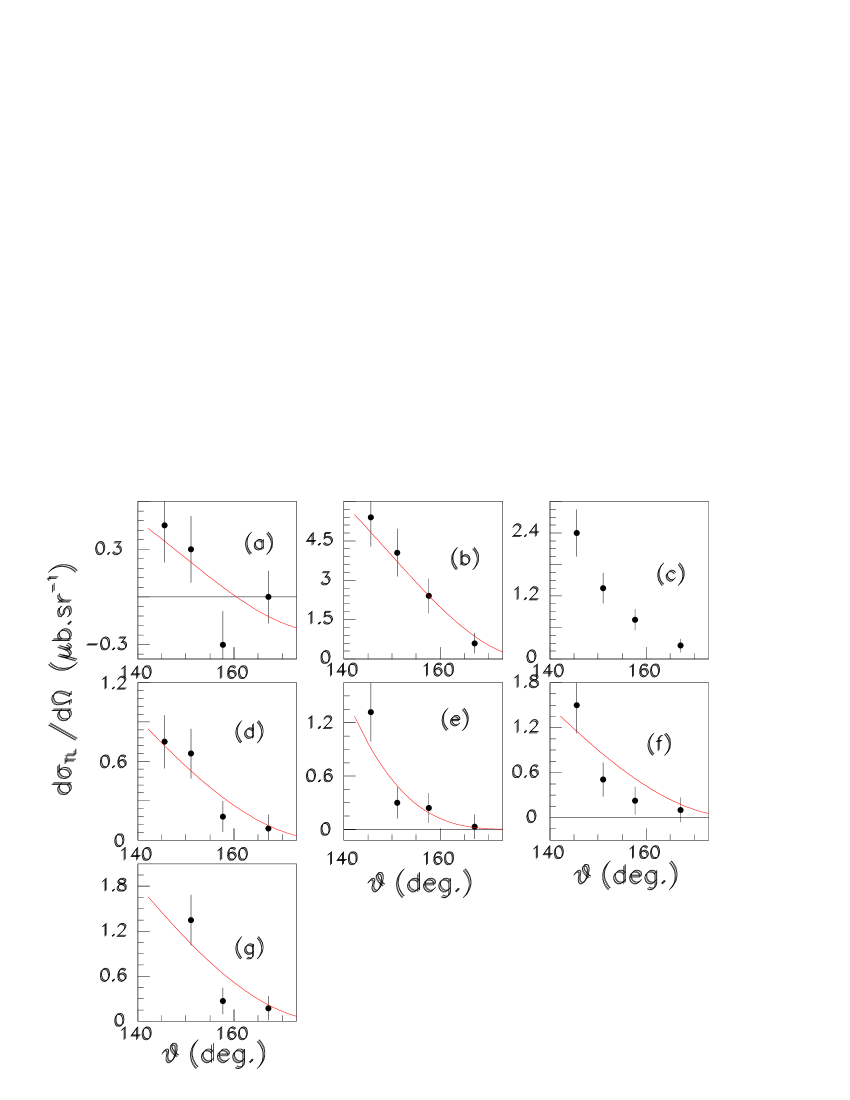
Fig. 7 shows the angular variation versus of the yield of the seven narrow masses as extracted from Figs. 5 and 6. The error bars here are arbitrarily put to 20 of the height of each peak, increased by 10 of the highest peak in order to get a reasonable error for small peaks. We observe a smooth and continuous variation of the observed yields. The curves are a tentative fit of the points by the function
| (5) |
In the small angular range covered by the experiment, all seven peaks show a similar behavior. We do not attempt to draw conclusions on the spin and parity of the narrow resonances from the present, restricted angular distributions.
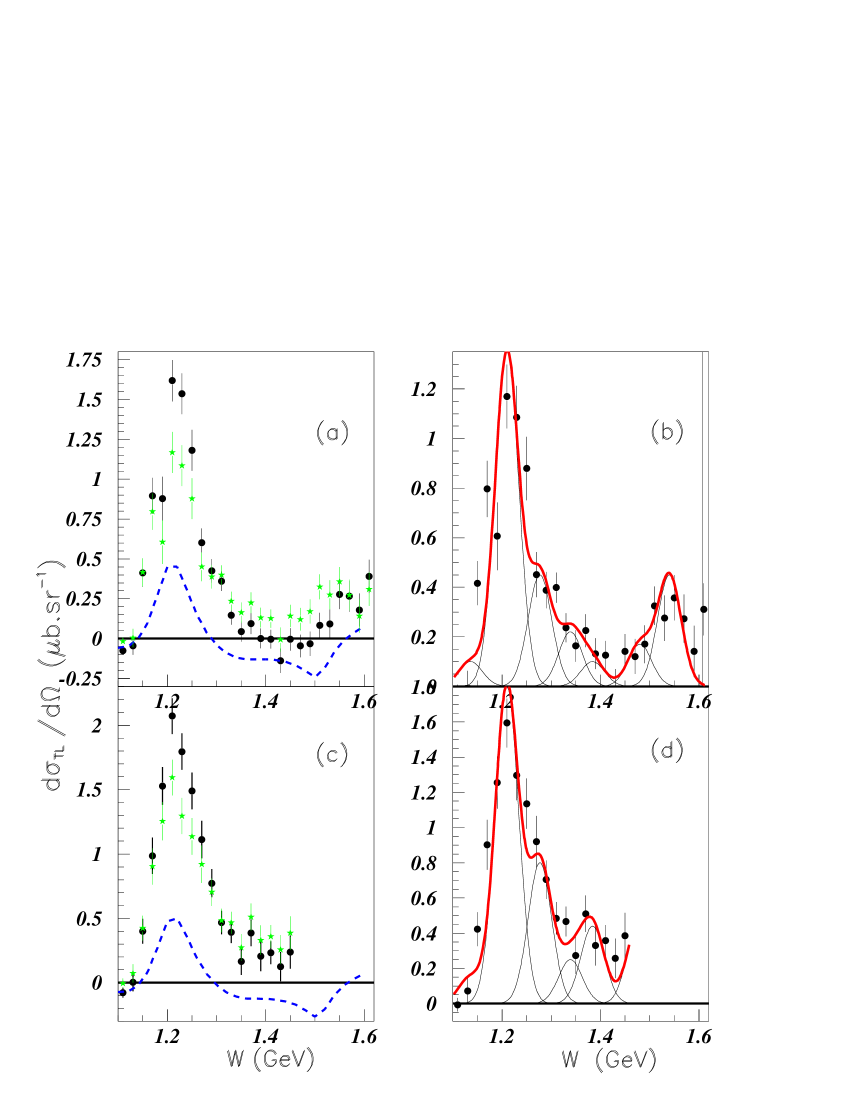
III.1.2 The structure function
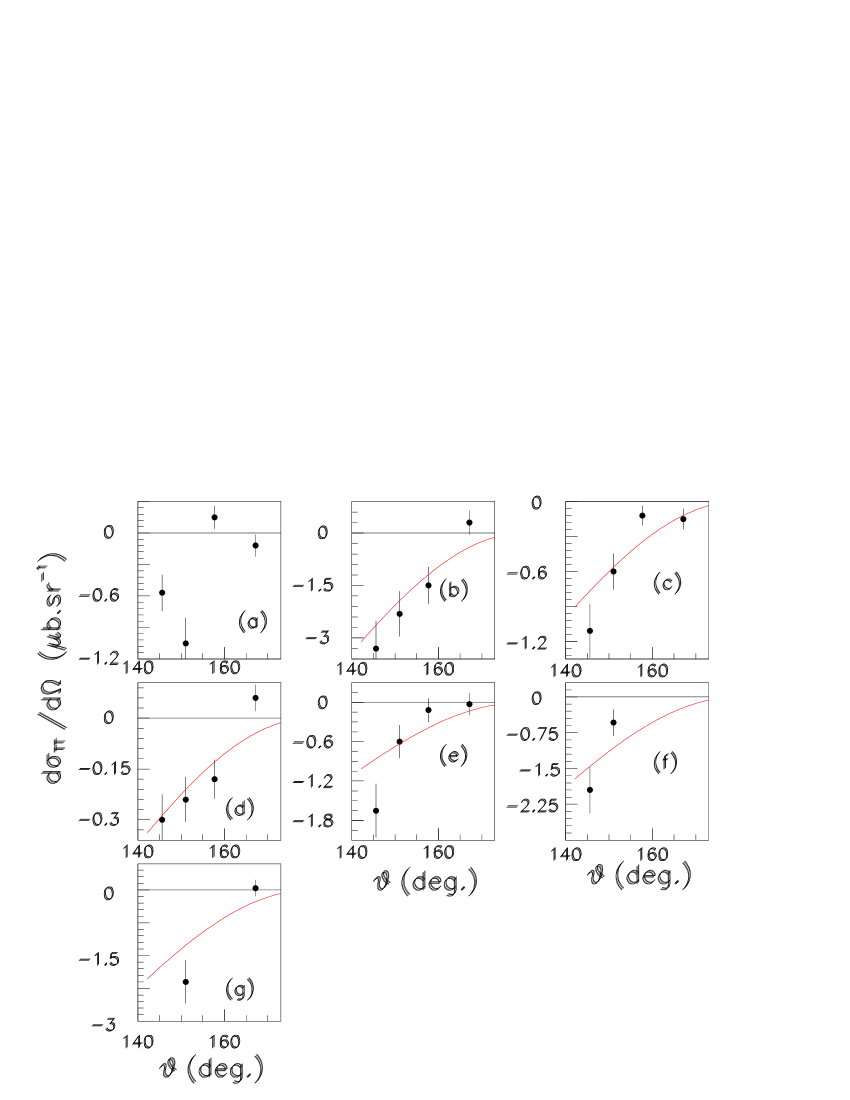
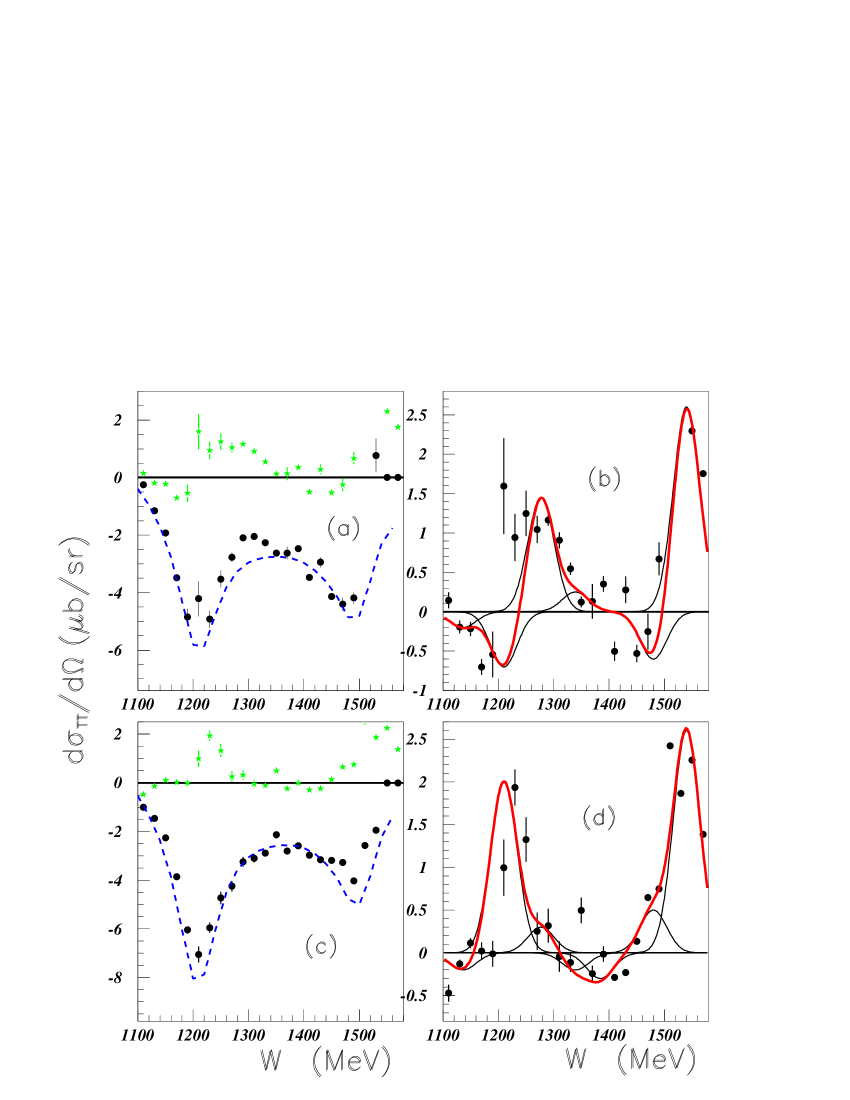
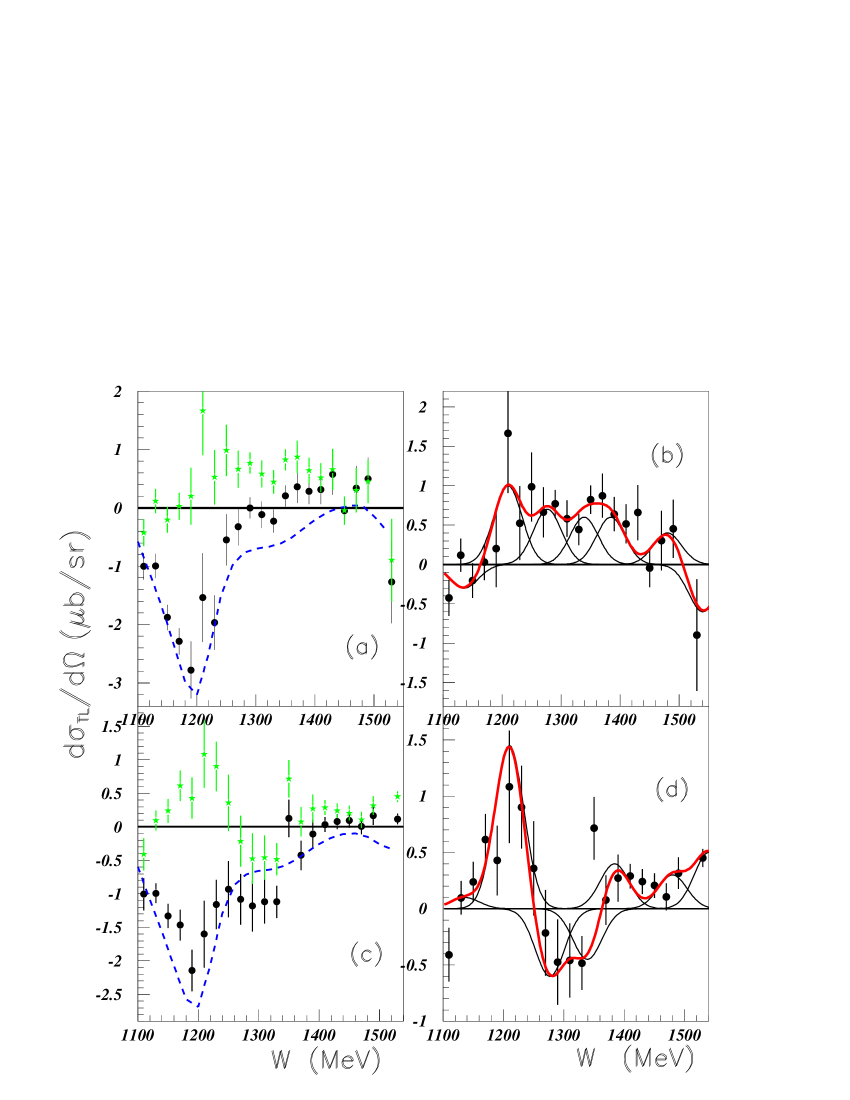
Fig. 8 shows the results for the structure function at =167.160 in inserts (a) and (b), and at =157.670 in inserts (c) and (d). Here also the data, the MAID results, the difference between both, and the fits of the peaks are defined as previously for the structure function. Fig. 9 shows the results for the structure function at =151.050 in inserts (a) and (b), and at =145.590 in inserts (c) and (d). Fig. 10 shows the angular variation of the seven structure functions corresponding to the seven peaks studied. In all inserts the yield for the largest angle is close to zero. A rather good continuity is observed, except in insert (a) which corresponds to M=1136 MeV narrow structure peak. The same function as previously, Eq (5), is used for the fits.
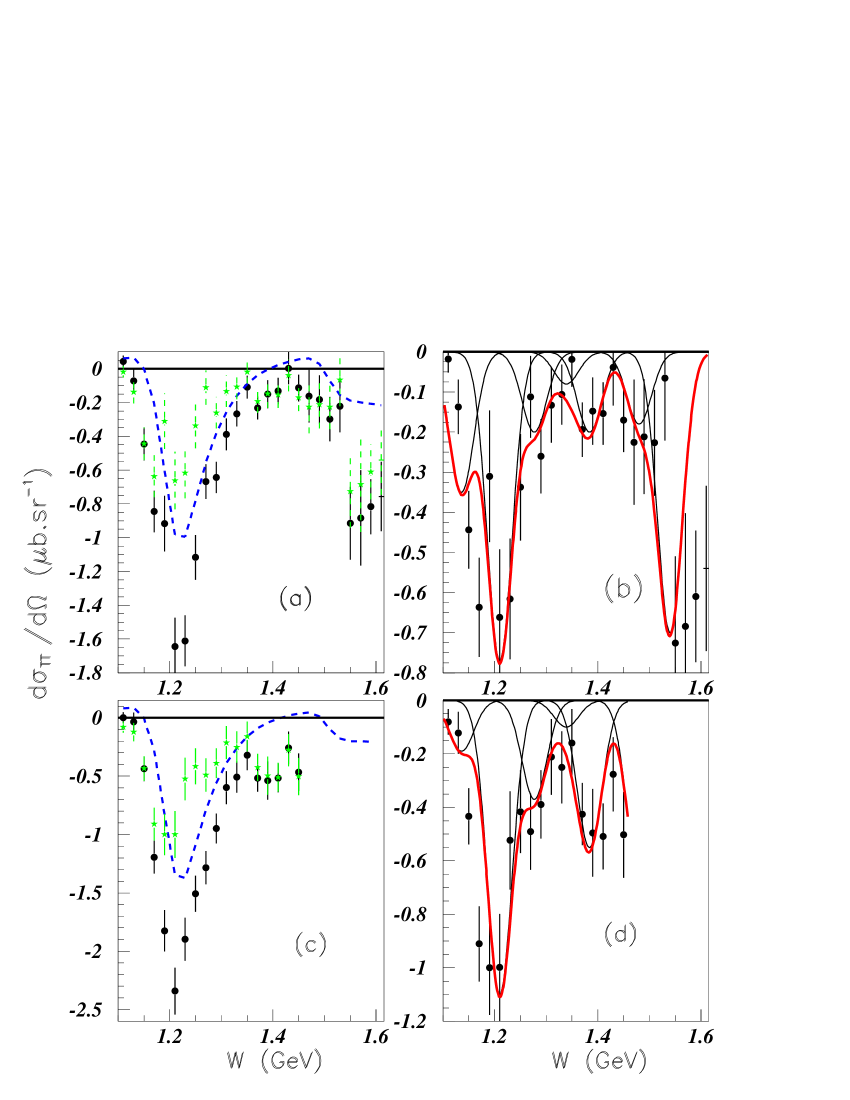
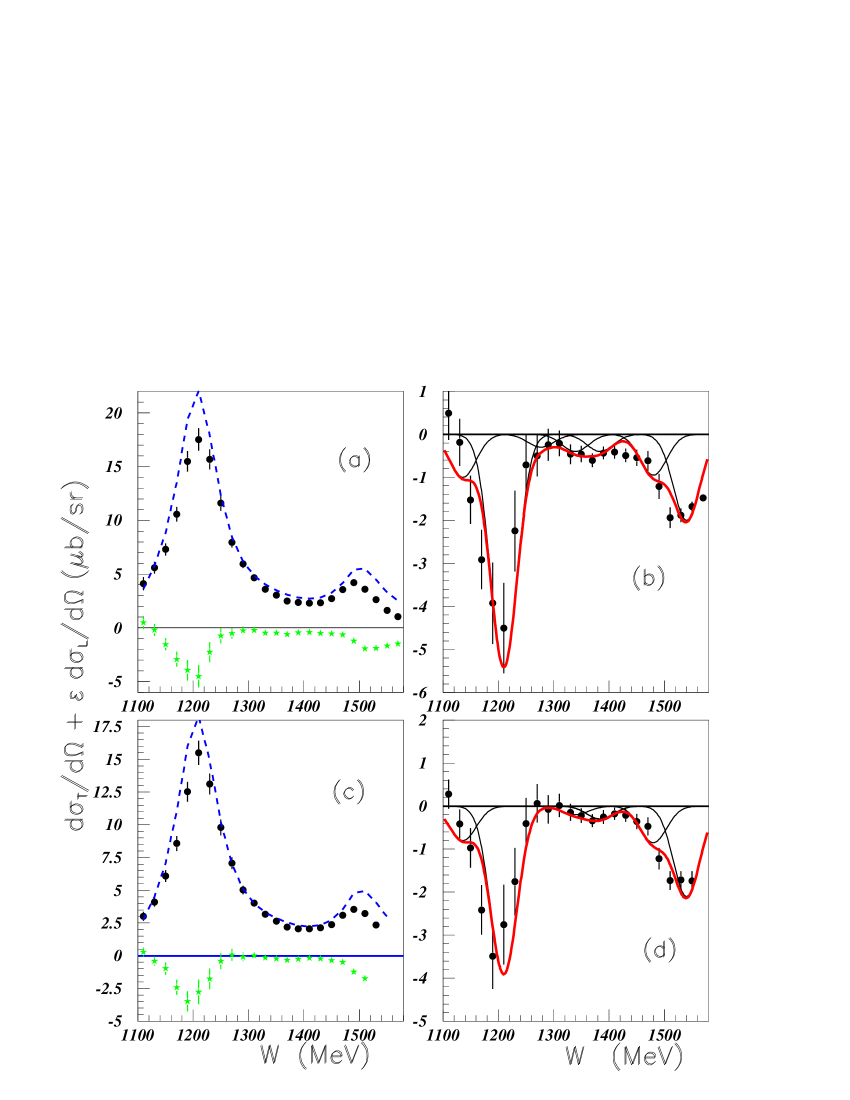
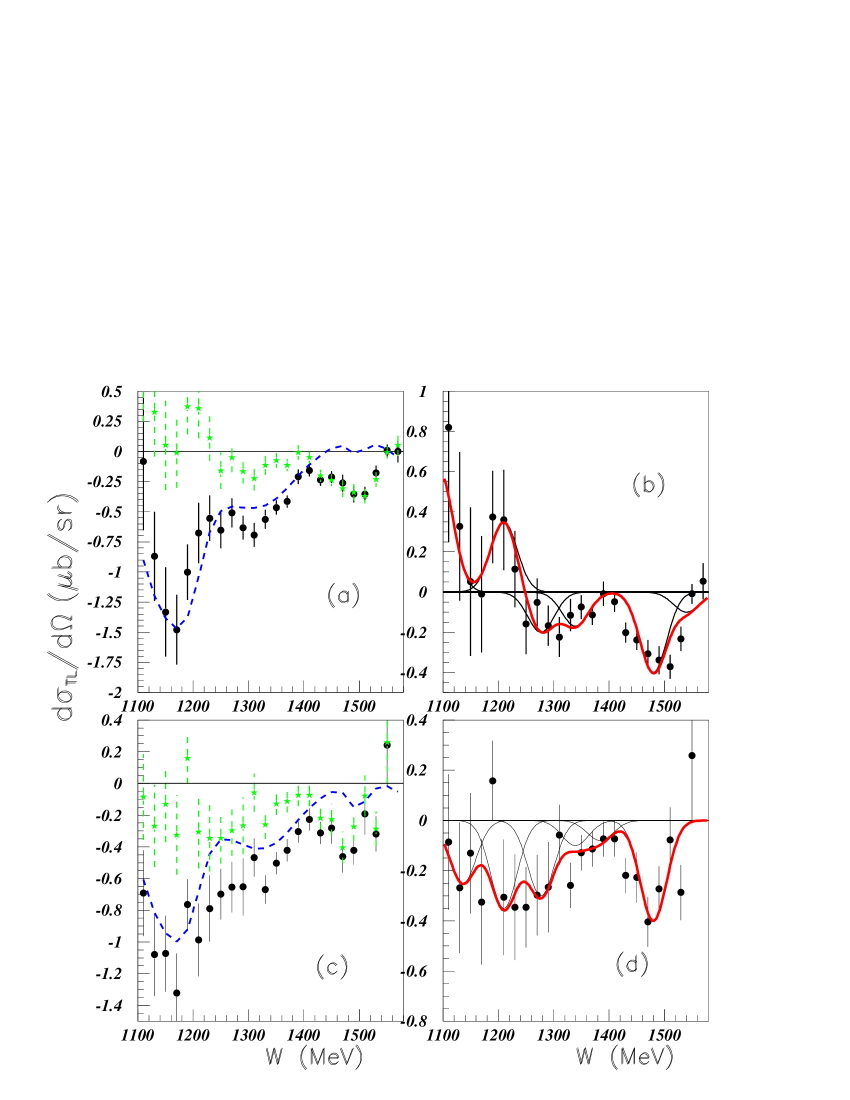
III.1.3 The structure function
Fig. 11 shows the results for the structure function at =167.160 in inserts (a) and (b), and at =157.670 in inserts (c) and (d). Fig. 12 shows the results for the structure function at =151.050 in inserts (a) and (b), and at =145.590 in inserts (c) and (d). In this structure function, the fit with MAID is poor at all angles; at the smallest angle =145.590, the peak at M=1210 MeV reaches only 25 of its experimental value. Fig. 13 shows the angular variation of the seven structure functions, corresponding to the seven peaks studied. We observe the continuous behavior of the other distributions, again fitted with the same function versus . Here again, the small angular range prevents to give strong importance to these fits which are merely an indication of similar shapes between all peaks.
III.2 The pn reaction
The reaction was measured at JLAB in Hall B, by the CLAS Collaboration egiy . These data are less precise than those discussed above from Hall A. The cross sections of the three structure functions were extracted at four values of four momentum transfers: Q2=0.3, 0.4, 0.5, and 0.6 GeV2, and at ten angles =7.50, 22.50, 37.50, 52.50, 67.50, 82.50, 97.50, 112.50, 127.50, and 142.50. We analyze here the difference between data and MAID calculations for two Q2 values Q2=0.3 and 0.4 GeV2, and six center of mass angles =7.50, 22.50, 52.50, 67.50, 97.50, and 127.50. The data at =142.50 are very imprecise. No data are available at Q2=0.6 GeV2 for the hadronic system mass W larger than W=1.4 GeV. As previously discussed, the figures illustrate the experimental structure functions, the MAID results and their differences on the left side, whereas, on the right side these differences are plotted with the corresponding fits.
III.2.1 The structure functions
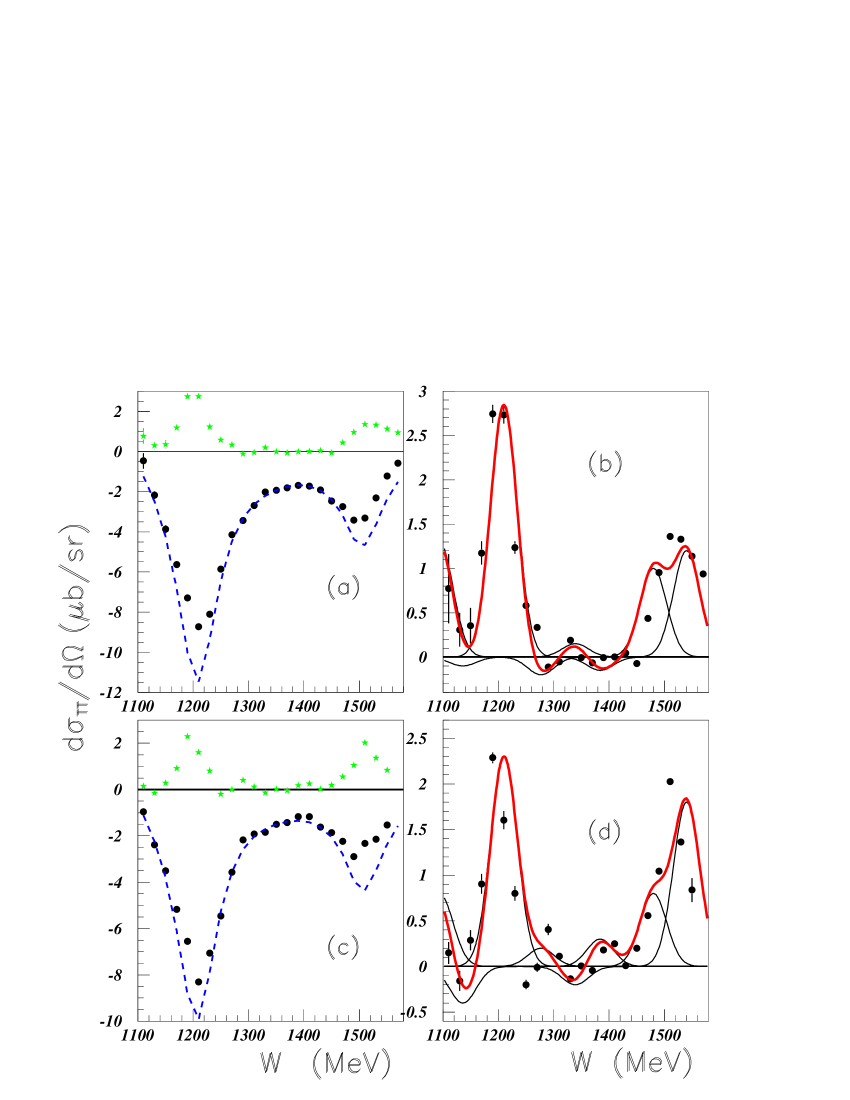
Fig. 14 exhibits the structure functions at =7.50 and Q2=0.3 GeV2 in inserts (a) and (b), and at =7.50 and Q2=0.4 GeV2 in inserts (c) and (d). For this structure function, and at such small angle, MAID describes fairly well the data up to W=1350 MeV, however a difference remains which can be fitted reasonably well with the same masses as before. The next figures Fig. 15, Fig. 16, Fig. 17, Fig. 18, and Fig. 19, correspond respectively to the same analysis but different angles =22.50, 52.50, 67.50, 97.50, and 127.50. Some masses, i.e. at M=1173 MeV, 1210 MeV and 1480 MeV are better defined than the others. Here again the cross sections at Q2=0.3 GeV2 and Q2=0.4 GeV2 are not very different. Fig. 20 shows the angular variations of the seven structure functions, corresponding to the seven narrow structure masses studied. The error bars are again defined as explained above for the first reaction. Full circles correspond to Q2=0.3 GeV2 and empty circles correspond to Q2=0.4 GeV2. The data corresponding to both four-momentum transfers are close, most of the time. Full curves correspond to tentative fits with the function defined above, Eq. 5; in one case, insert (a), the fit is obtained with an odd function of , namely .
III.2.2 The structure functions
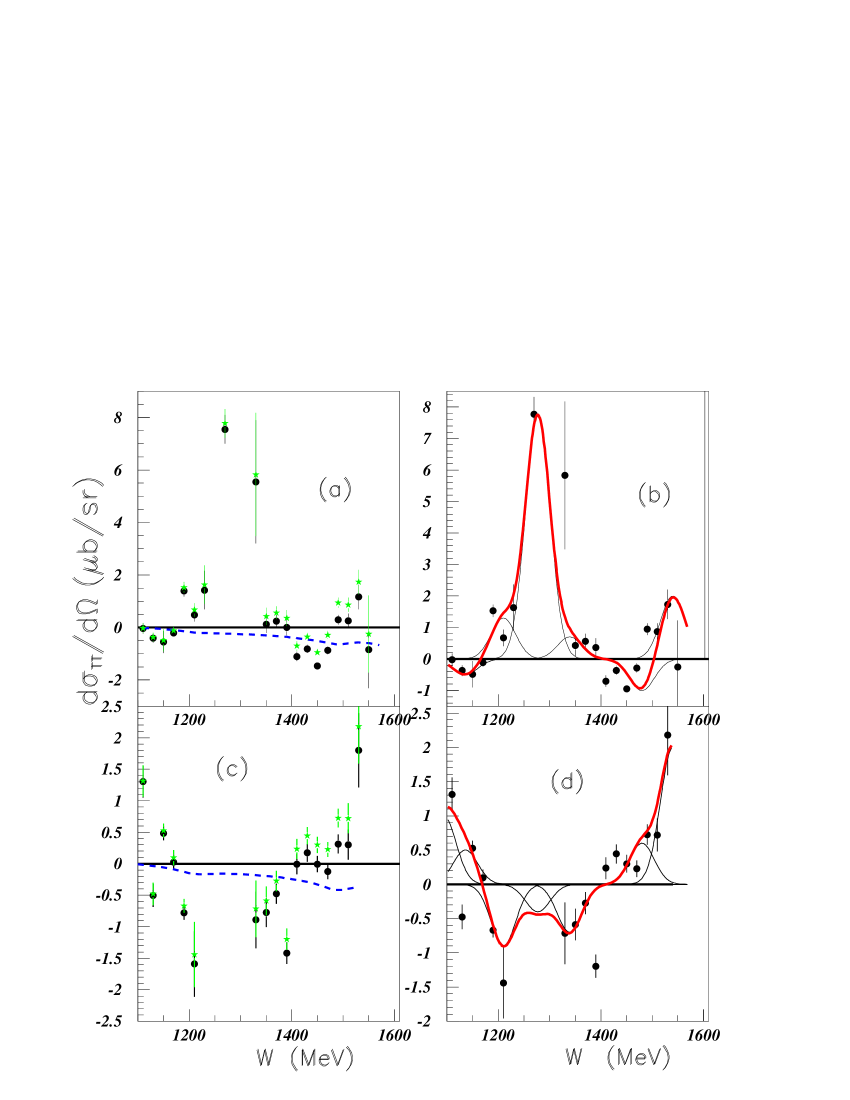
Fig. 21 shows the results for structure function at =7.50, in inserts (a) and (b) for Q2=0.3 GeV2 and in inserts (c) and (d) for Q2=0.4 GeV2 data.
At this angle, there is no precise experimental data in the mass range 1230M1340 MeV.
The description by MAID fails totally to describe the data. The results for =22.50 are shown in Fig. 22, inserts (c) and (d) for Q2=0.3 GeV2 and in Fig. 23, inserts (c) and (d)
for Q2=0.4 GeV2 data. Fig. 24 show the results of the structure function
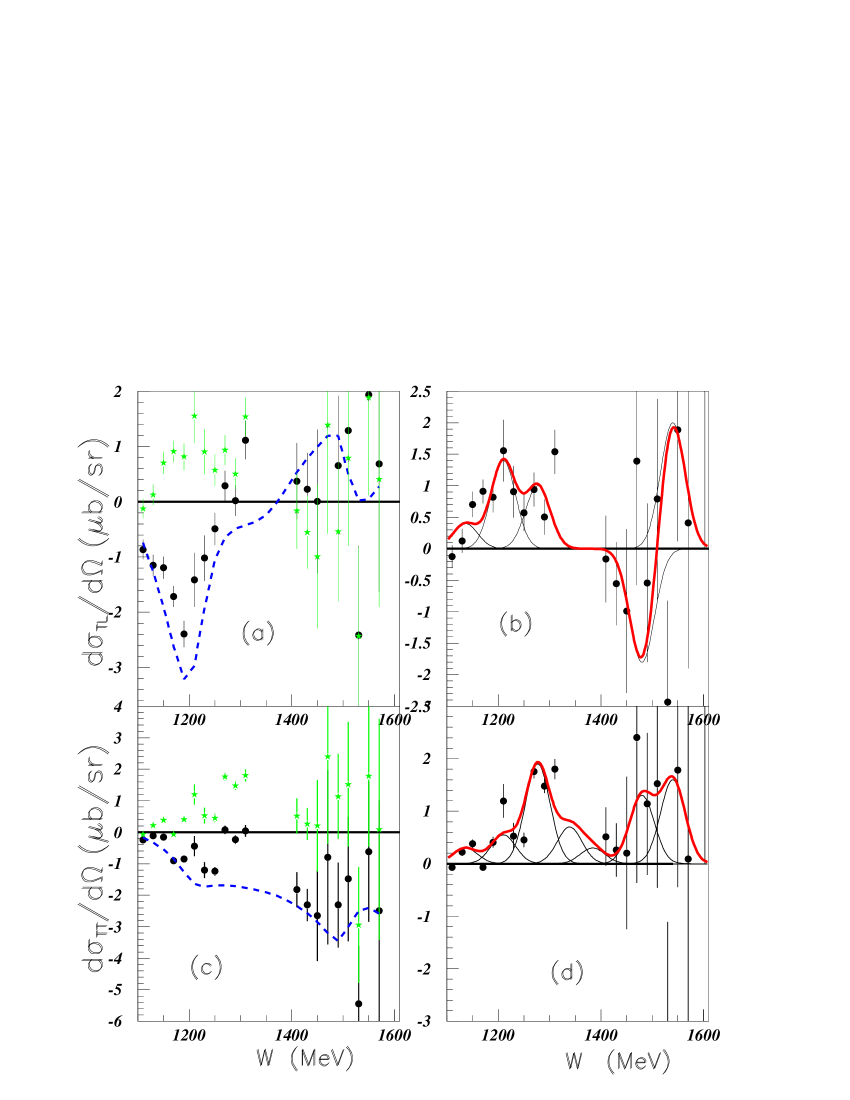
at Q2=0.3 GeV2. Inserts (a) and (b) show the results obtained at =52.50, and inserts (c) and (d) show the results at =67.50. Fig. 25 shows the results identical to those from Fig. 24, but for Q2=0.4 GeV2. Fig. 26 shows the results for
structure function at =97.50 at Q2=0.3 GeV2 in inserts (a) and (b) and at Q2=0.4 GeV2 in inserts (c) and (d). The error bars decrease with increasing angles, and consequently the structure’s definitions are good. Fig. 27 shows the
structure function at =127.50 at Q2=0.3 GeV2 in inserts (a) and (b) and at Q2=0.4 GeV2 in inserts (c) and (d).
Fig. 28 shows the angular variation of the structure function with an attempt to fit the data with a low order polynomial of .
The full circles correspond to Q2=0.3 GeV2, and the empty circles correspond to Q2=0.4 GeV2.
We observe that in several inserts, corresponding to different narrow mass structures,
the fitted curves describe very satisfactorily most of the data.
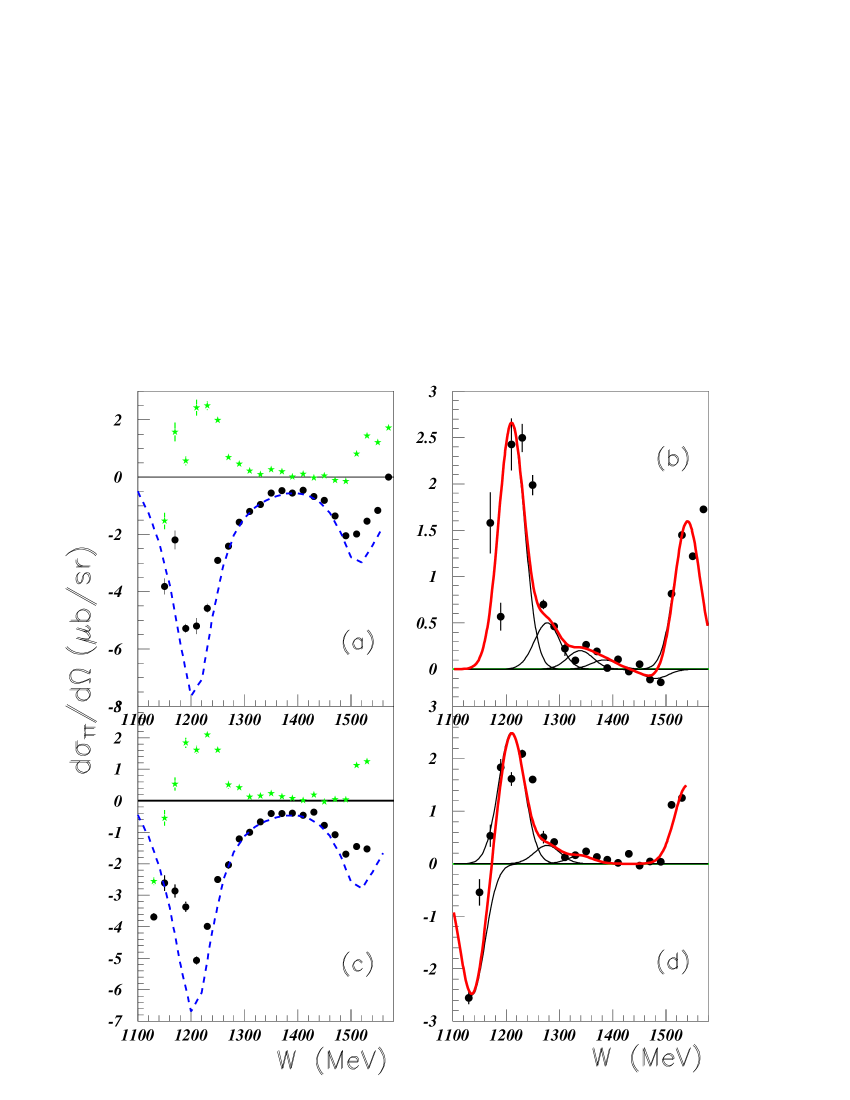
III.2.3 The structure functions
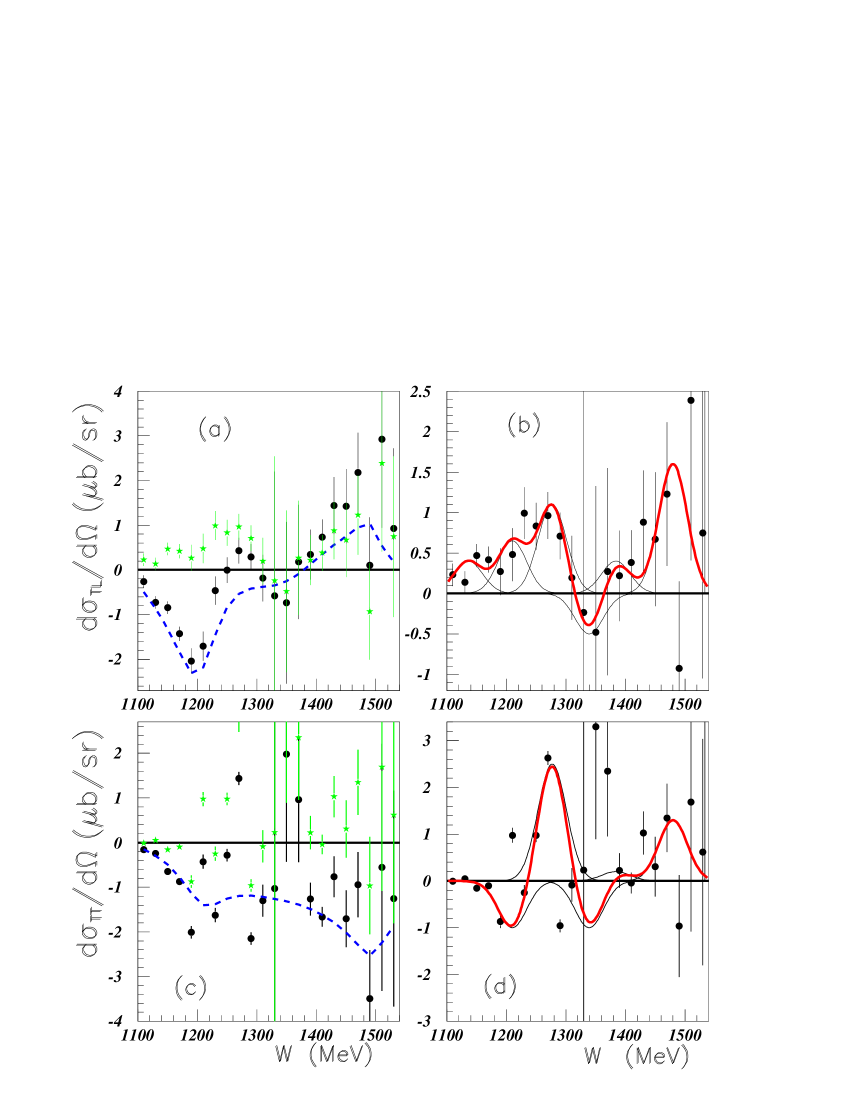
Fig. 29 shows the cross-section of the structure function at =7.50.
Inserts (a) and (b) correspond to Q2=0.3 GeV2, inserts (c) and (d) correspond to Q2=0.4 GeV2. Here also, as it was the case at the same angle for the
structure function, there is no precise experimental data in the mass range around
M1300 MeV. The results at 22.50 are shown in Fig. 22 inserts (a) and (b) for
Q2=0.3 GeV2, and in Fig. 23 inserts (a) and (b) for Q2=0.4 GeV2.
Fig. 30 shows the results for Q2=0.3 GeV2 =52.50 in inserts (a) and (b),
and =67.50 in inserts (c) and (d). The peak’s extraction from insert (b) is meaningless,
it is only shown for sake of consistency. Fig. 31 shows the results corresponding to the same
angles but for Q2=0.4 GeV2. Here again the =52.50 data do not allow to extract peaks. Fig. 32 shows the results for =97.50 Q2=0.3 GeV2 in inserts (a) and (b), and Q2=0.4 GeV2 in inserts (c) and (d). Fig. 33 shows the
results for =127.50 Q2=0.3 GeV2 in inserts (a) and (b), and Q2=0.4 GeV2 in inserts (c) and (d).
Fig. 34 shows the angular variations of the structure function. The insert (a) (M=1136 MeV) is fitted with an odd function, ; the insert (b) (M=1210 MeV) is fitted with the function . The other curves are fits to the points with a low order polynomial of
.
IV Discussion
Whereas clear peaks are observed in both sides of the mass range studied here, this is not always the case in the mass range M1.4 GeV. No attempt to get a better adjustment by shifting the masses, is done on the fits shown above. Most of the extracted structure function surfaces, exhibit a smooth angular variation. This result justifies, a posteriori, the attempt to associate the difference between structure functions and MAID, with the existence of narrow baryonic structures.
One argument not to attribute the differences described above to deficiencies in MAID, lies in the smallness of the widths of the residual peaks. Indeed, we expect that an eventually poor description of the data by MAID would result in broader effects.
IV.1 Possible isospin values for the narrow structures
Both reactions were studied at complementary angles, roughly in the range 01400 for the n reaction and 1401700 for the p reaction. However in both reaction, the four momentum transfer is different. We observe small variations of the cross section between Q2=0.3 GeV2 and Q2=0.4 GeV2, but an extrapolation up to Q2=1 GeV2 may not be justified. Both reactions are related by isospin Clebsh-Gordan coefficients. If we neglect the variation of the structure function due to different Q2 values, the intermediate resonance with isospin 1/2, will favor by a factor of two, and the intermediate resonance with isospin 3/2 will favor p by a factor of two. Figs. 20, 28, and 34 show the angular variations of the structure functions, respectively , , and , with the results of both reactions. The results from the reaction at backward angles are drawn with stars. Both reactions display cross sections with smooth behavior for several inserts. A continuous curve reproducing the behavior for both reactions, may be considered as an indication of the excitation of isospin 3/2 resonance. In this case, the increase by a factor of two, due to isospin, could be compensated by a reduction by a similar factor due to the increase in from 0.3-0.4 GeV2 up to 1 GeV2.
In order to tentatively suggest isospins for the narrow structures, we apply the following rule: when the structure function of the reaction and the structure function of the reaction follow the same line, we propose an isospin value of 3/2 for the baryonic structure; when the structure function of the first reaction is much smaller than the one of the second reaction, we suggest an isospin 1/2. Table 2 shows the possible isospin attributions. We observe that the structures at W=1136 MeV (insert (a)), should have isospin T=1/2, since all three structure functions predict such value. Isospin T=3/2 is predicted twice for M=1210 MeV, M=1277 MeV, and M=1480 MeV. Isospin T=1/2 is predicted twice for M=1339 MeV, M=1384 MeV, and M=1540 MeV. Therefore narrow structures at M=1210 MeV and M=1277 MeV could be ”substructures” of the broad PDG resonance; just as the narrow structure at M=1480 MeV could be a ”substructure” of the broad PDG resonance which total width is estimated pdg to be as large as 350 MeV. The narrow structures at M=1339 MeV, M=1384 MeV, and M=1540 MeV could be parts of the which total width is also estimated pdg to be as large as 350 MeV, and (or) part of the broad PDG baryonic resonance.
IV.2 Possible spin values for the narrow structures
The curves which fit the angular distributions drawn in Figs. 20, 28, and 34 are obtained, besides a few exceptions, using low order polynomials of . Due to the relative imprecision of the data, and their rather reduced number, the fits presented are not conclusive. It is not possible to identify the angular distributions with theoretical angular distributions peierls gasio which are given for cross-sections and not for structure functions. Moreover the theoretical angular distributions may be more complicated for increasing J values of the narrow baryonic resonances spins. Indeed these angular distributions are polynomials of , of the order 2J-1.
The angular distributions of the structure function differ from one narrow structure mass to another. Since the data of the M=1277 MeV structure (insert (c)) scatter too much, the fitted curve may be meaningless. The experimental distributions of the other inserts are continuous.
The angular distributions of the structure function show a smooth behavior for the inserts (a), (b), (c), (e), and (g).
We observe that the distributions of the structure functions have the same shape for the masses corresponding to inserts (c), (d), (e), and (f), namely that they all are proportional to (where stands for ) with different translations. The data are continuous for the inserts (a), (b), (d), (e), and (g).
Concluding this discussion, we observe that no spin attribution can be made, and only the comparison between and electroproduction, may eventually allow to suggest isospin values.
V Conclusion
The paper presents a contribution to the study of narrow exotic low mass baryons. Above pion production threshold, several narrow baryonic structures could be extracted from experiments using incident leptons. Several results of this kind were presented in bor2 and were not recalled here. The two discussed experiments, namely one pion electroproduction on proton, were performed with another aim; their results were then not obtained with an appropriate resolution.
We have shown that the description of the measurements with MAID was sometimes more qualitative than quantitative. The difference between data and results from MAID calculations, exhibits narrow peaks, better defined in both sides of the studied range. We have shown that the entire range can be described by structures at the masses extracted from previous experiments performed with hadrons and previous analysis. We conclude that these data, although they do not contain by themselves an unambiguous signature, they nevertheless increase the confidence in the genuine existence of these narrow baryonic structures. The comparison between both electroproduction reactions, allowed us to suggest possible isospins for these narrow baryonic structures.
Thanks are due to H. Fonvieille for her interest and critical remarks.
References
- (1) S.Capstick and W.Roberts, Prog. Part. Nucl. Phys.45, 08241 (2000).
- (2) G. Laveissière et al., The Hall A Collaboration, Phys. Rev. C69, 045203 (2004).
- (3) H. Egiyan et al., Phys. Rev. C73, 025204 (2006).
- (4) X.Jiang et al. Phys. Rev. C67, 028201 (2003).
- (5) M.Kohl et al., arXiv:nucl-ex/0304013 (2003).
- (6) P.A.Zolnierczuk et al., arXiv:nucl-ex/0403046 (2004).
- (7) B. Tatischeff et al., Phys. Rev. Lett. 79, 601 (1997).
- (8) B. Tatischeff et al., Eur. Phys. J. A 17, 245 (2003); ibid Surveys in High Energy Physics, 19, 55 (2004); ibid Phys. Rev. C72, 034004 (2005).
- (9) A. Zabrodin et al., Phys. Rev. C60, 055201 (1999).
- (10) H.W. Dannhausen, E.J. Durwen, H.M. Fisher, M. Leneke, W. Niehaus, and F. Takasaki, Eur. Phys. J. A11, 441 (2001).
- (11) H.P. Morsch et al., Phys. Rev. Lett. 69, 1336 (1992); H.P. Morsch and P. Zupranski, Phys. Rev. C61, 024002 (1999).
- (12) H.P. Morsch, Proceedings of the Dixieme Journee Thematique de l’IPN d’Orsay (1995).
- (13) B.Tatischeff, arXiv:nucl-ex/0404042
- (14) P.A. Guichon, G.Q. Liu and A.W. Thomas, Nucl. Phys. A551, 606 (1995).
- (15) D. Drechsel, S.S. Kamalov, and L. Tiator, Nucl. Phys. A645, 145 (1999).
- (16) Particle Data Group, Phys. Lett. B592, 1 (2004).
- (17) R.F. Peierls, Phys. Rev. 118, 325 (1960).
- (18) S. Gasiorowicz, Elementary Particle Physics, John Wiley and Sons, Inc. editors, (1966).


| SPES3 mass | 1004 | 1044 | 1094 | 1136 | 1173 | 1249 | 1277 | 1339 | 1384 | 1479 | ||
| pic marker | (a) | (b) | (c) | (d) | (e) | (f) | (g) | (h) | (i) | (j) | (k) | (l) |
| SPES4 mass 0.80 | 1052 | 1113 | 1142 | 1202 | 1234 | 1259 | 1370 | 1394 | 1478 | |||
| SPES4 mass 20 | 996 | 1036 | 1104 | 1144 | 1198 | 1234 | 1313 | 1370 | 1477 | |||
| SPES3 mass | 1505 | 1517 | 1533 | 1542 | (1554) | 1564 | 1577 | |||||
| pic marker | (m) | (n) | (o) | (p) | (q) | (r) | (s) | |||||
| SPES4 mass 20 | 1507 | 1517 | 1530 | 1544 | 1557 | 1569 | 1580 |
| insert | (a) | (b) | (c) | (d) | (e) | (f) | (g) |
|---|---|---|---|---|---|---|---|
| 1/2 | 3/2 | 3/2 | 1/2 | 1/2 | 1/2 | 3/2 | |
| 1/2 | 3/2 | 1/2 | 1/2 | 1/2 | 3/2 | 1/2 | |
| 1/2 | 1/2 | 3/2 | 3/2 | 3/2 | 3/2 | 1/2 |