Precision study of the He system using the He reaction
Abstract
The differential and total cross sections for the reaction have been measured in a high precision high statistics COSY–ANKE experiment near threshold using a continuous beam energy ramp up to an excess energy of 11.3 MeV with essentially 100% acceptance. The kinematics allowed the mean value of to be determined to about 9 keV. Evidence is found for the effects of higher partial waves for MeV. The very rapid rise of the total cross section to its maximum value within MeV of threshold implies a very large He scattering length and hence the presence of a quasi–bound state extremely close to threshold.
pacs:
13.60.Le, 14.40.Aq, 25.45.-z,The low energy He system has been investigated in both the reactions Berger ; Mayer as well as in photoproduction Pfeiffer . The anomalous energy dependence found there suggests that the strong He final state interaction (fsi) might lead to the formation of a new state of matter in the form of an He quasi–bound state Wilkin for nuclei much lighter than originally postulated Liu . This question is far from being settled and further high quality data are required to inform the debate.
The SPESII measurements Mayer show that the absolute square of the production amplitude falls by a factor of three between threshold and an excess energy of about 6 MeV and the conclusion drawn was that the He scattering length is very large. However, in order to distinguish between the effects of the real and imaginary parts of , one needs data with a good knowledge of the absolute value of and with a very small energy spread. These conditions are hard to meet in the interesting near–threshold region when using a liquid hydrogen target and an extracted proton beam because of the energy losses in the target. On the other hand, they can be overcome by using a thin windowless gas target placed inside a storage ring, and we have taken advantage of these features in a measurement of the reaction near threshold.
The experiment was performed with a hydrogen cluster–jet target target using the ANKE spectrometer ANKE placed at an internal station of the COoler SYnchrotron COSY–Jülich. During each of the beam cycles of 277 seconds, the deuteron beam energy was ramped slowly and linearly in time, from an excess energy of MeV to MeV. The 3He produced were detected in the ANKE forward detection system, which consists of two multi-wire proportional chambers, one drift chamber and three layers of scintillation hodoscopes. The geometrical acceptance for the 3He of interest was %, so that systematic uncertainties from acceptance corrections are negligible. The tracks of charged particles could be traced back through the precisely known magnetic field to the known interaction point, leading to a momentum reconstruction for registered particles. The luminosity required to determine cross sections was found by simultaneously measuring elastic scattering, with the scattered deuterons being registered in the forward detector and the proton reconstructed from the missing mass. Data in this region show that changes little with beam energy, though the dependence on the four–momentum transfer in our available range of (GeV/c)2 is very strong dpelastic . It is therefore the systematic uncertainty in the measurement of the deuteron scattering angle that dominates the error of about % in the luminosity determination. However, it must be stressed that the relative luminosity over the ramp is known much better and its effects are included in the point–by–point errors.
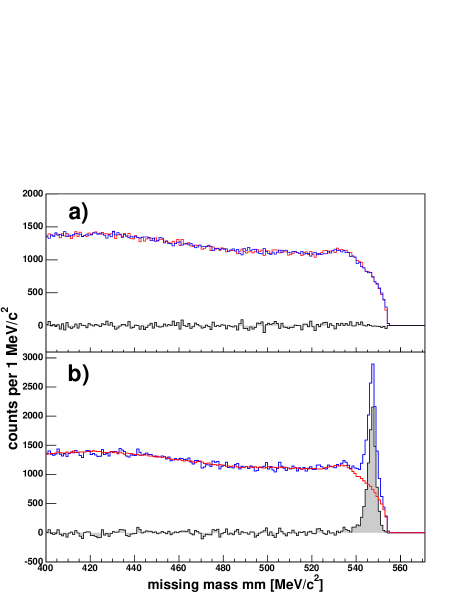
The 3He were selected by the method, with the meson being subsequently identified through a peak in the missing–mass distribution Ola . The distribution for the interval MeV is presented in Fig. 1b. In order to extract the total number of events, the background below the peak, originating mainly from multi–pion production, has to be subtracted. For this purpose, measurements performed below the threshold were analyzed as if they were made above Ola . The reliability of this approach is made clear in Fig. 1a, where events obtained at MeV and MeV were both analyzed assuming a value of MeV. After correcting for luminosity, the two distributions coincide perfectly and their difference is consistent with zero. This technique is applied above threshold in Fig. 1b, where the distribution corresponding to all the measurements with MeV has been subtracted from the MeV missing–mass spectrum. All that remains in the difference spectrum is an meson peak with a width of sitting on a vanishingly small background.
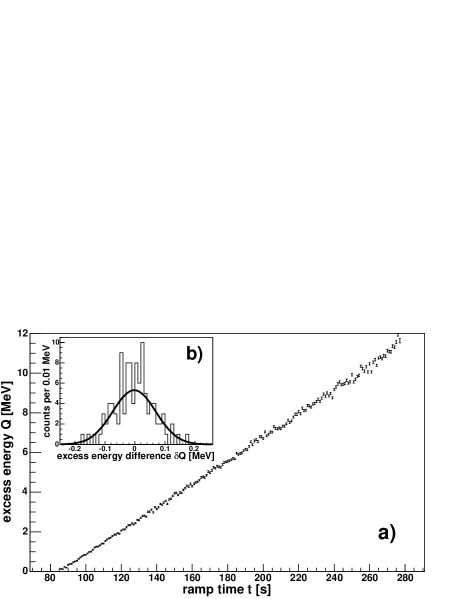
The excess energy at a particular time during the ramp was reconstructed by studying the size of the 3He momentum locus in the c.m. frame and comparing it with analytic formulae and simulations. The consistency of the excess energy determination with the expected linear variation of the beam energy with ramp time is demonstrated in Fig. 2a. The deviations from the linear fit presented in panel 2b are consistent with a statistical distribution of width keV. The mean value could therefore be determined to 9 keV and this becomes even more precise as one approaches threshold. Since, due to the uncertainty in the orbit length, the absolute beam momentum is not known to better than about 3 MeV/c, this excellent measurement of cannot be translated into an accurate value of the mass.
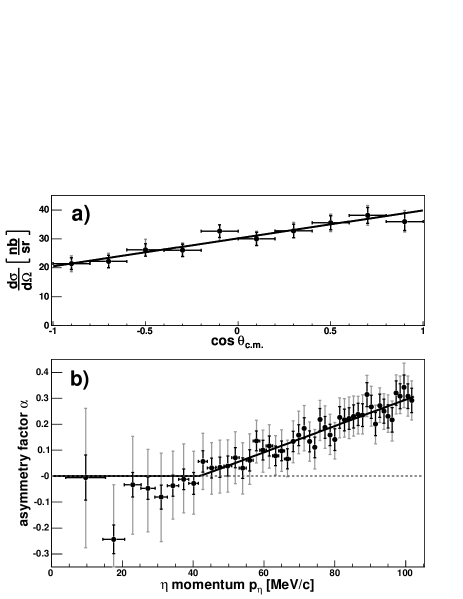
In order to determine the differential cross section for each excess energy bin, missing–mass distributions were analyzed for different 3He c.m. production angles in a similar manner to that shown in Fig. 1. The asymmetry in the angular distribution of Fig. 3a implies that there are higher partial wave contributions even in this very near–threshold region. Defining an asymmetry parameter through , it is seen from Fig. 3b that above an c.m. momentum of 40 MeV/c (MeV), is positive and increases monotonically with but with a magnitude much larger than that found at SPESII Mayer . At low momentum, both data sets show a tendency for to go negative but the systematic uncertainties here are large. The slope of the cross section at has the same sign as that found at higher excess energies, though the data there do not remain linear over the whole angular range GEM ; Jozef ; Adam .
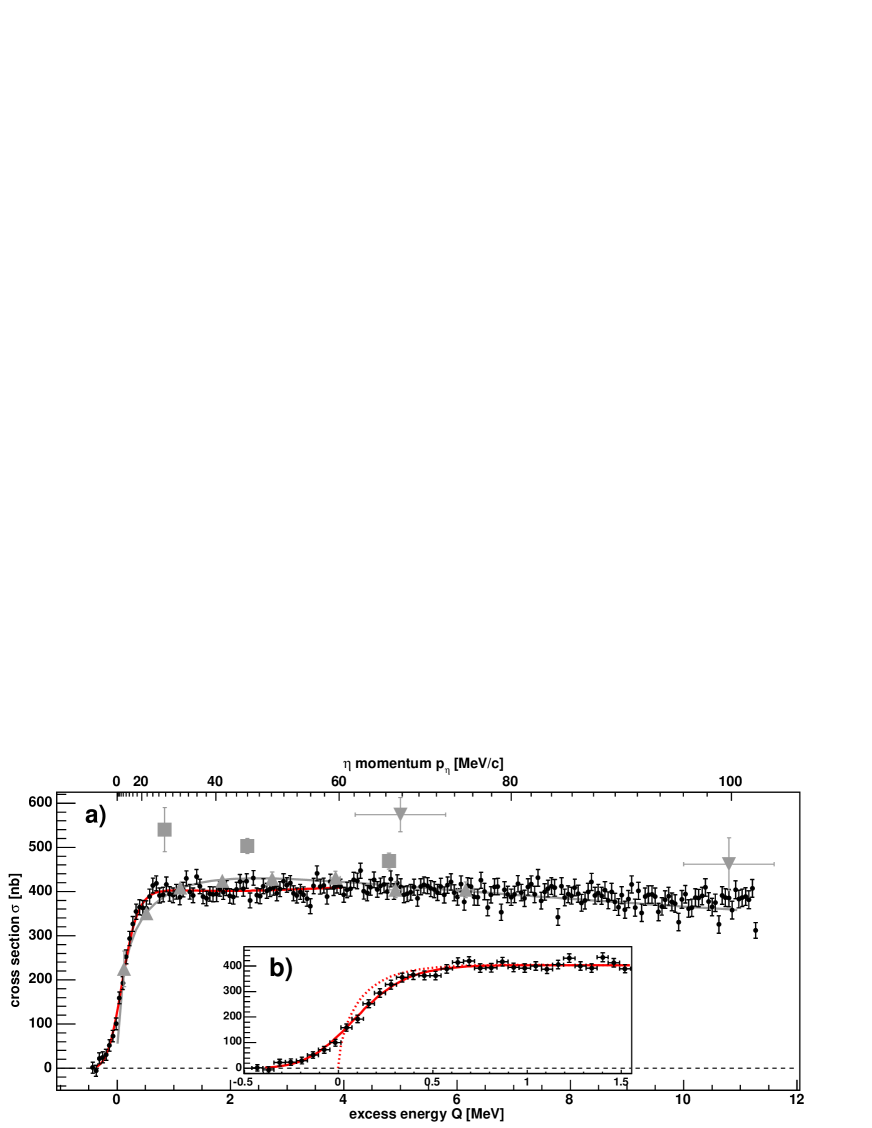
The total cross sections obtained at 195 bins in excess energy are displayed in Fig. 4. The minimal relative systematic errors resulting from the measurement of the excitation function in a single experiment form a robust data set for any phenomenological analysis. Our data are broadly compatible with those of SPESII Mayer and any global difference is within our overall normalization uncertainty. However, in contrast to our data presented in Fig. 4b, the SPESII results do not define firmly the energy dependence in the near–threshold region. The total cross section reaches its maximum value within 0.5 MeV of threshold and hardly decreases after that. This behavior is in complete contrast to phase–space expectations and indicates a very strong final state interaction Wilkin .
The angular average of the amplitude–squared is derived from the total cross section through
| (1) |
where is the initial c.m. momentum. In the presence of a strong final state interaction, the –wave amplitude can be approximated in terms of the complex He scattering length () and effective range ()
| (2) |
where is assumed to be slowly varying.
The shape of the production below the nominal threshold shown in Fig. 4 is a very sensitive measure of the momentum width of the COSY beam, and this resolution has to be taken into account in any phenomenological analysis. The excitation function visible in the experiment is the convolution of the true one with a smearing function , taken to be Gaussian, which is then grouped in finite bins of :
| (3) |
where the luminosity is assumed constant over each bin of a typical MeV width. The fitting process shows that the resolution in is keV. If this arises purely from the momentum spread of the beam it would correspond to . The effect of the smearing in is illustrated in Fig. 4b, where the unsmeared parametrization, , is shown by the dotted curve.
The gray line in Fig. 4a shows the published fit of Eq. (2) to the SPESII results Mayer without the effective range term and without smearing over the effective beam energy. Although this parametrizes these data very well, it underestimates the rapid rise from threshold in our more extensive data set. In fact any fit of Eq. (2), smeared according to Eq. (3), to the present data that neglects the effective range fails to satisfy simultaneously the data in the proximity of threshold (MeV) and at the higher energies (MeV). This effect becomes visible here for the first time because of the quality and extent of the data. This lack of a successful fit with the simple scattering length formula might be caused by contributions from higher partial waves or by effective range effects.
The presence of higher partial waves is obvious from the angular distributions of Fig. 3 but, if the asymmetry is due to – interference, this could be explained by a mere 3% –wave contribution. The identification of the higher partial waves requires experiments with a polarized deuteron beam which will be performed Rausmann .
The inclusion of the effective range term results in a significantly better description of the data, as can be seen from the solid line in Fig. 4a. To minimize the effects of the higher partial waves, only the ANKE data up to an excess energy of MeV have been considered in the fit, whose results are summarized in Table 1.
| Scattering length (fm) | Effective range (fm) |
|---|---|
In order to affect the cross section variation over a scale of less than 1 MeV, there must be a pole of the production amplitude in the complex plane that is typically only 1 MeV away from . Using the parameters of Table 1 in Eq. (2), the nearby pole position is found to be MeV/c. In the energy plane, the pole is at MeV, where is the He reduced mass. Though the errors are strongly correlated, as they are for the scattering length and effective range, the pole position is stable to within a fraction of an MeV.
In summary, we have performed measurements of the differential and total cross sections for the reaction near threshold where the spectrometer acceptance is close to 100%. The use of a beam whose energy varies linearly with time ensured that point–to–point systematic errors were under control. It also allowed us to determine the mean value of the excess energy with unparalleled accuracy. It was shown that the large physics background could be eliminated essentially completely through the subtraction of data taken below threshold. Although there is a 15% uncertainty in the luminosity, and hence in the values of the cross sections, this is a global feature that affects all our data in the same way and so will not change any of our principal conclusions.
It is remarkable that already for MeV the angular distributions are no longer isotropic and this must be an important clue to the dynamics. Effects of waves might become clearer when data are available on the angular dependence of the deuteron analyzing powers Rausmann . Extra information will also become available from an unpolarized COSY-11 measurement Smyrski .
The consistent set of total cross section measurements with high statistics at closely spaced values of should allow theoretical models to be tested in a rigorous manner. The very rapid rise and levelling–off indicates the existence of a pole in the production amplitude within one MeV of . Simple fits, using an effective range approximation for the final state interaction, suggest that the scattering length has an enormous real part that largely masks any effects arising from the imaginary part. The steep variation of with may bring the results closer to those of photoproduction of the He state Pfeiffer .
Acknowledgements.
Our experiment was only possible because of the high quality of the ramped deuteron beam and for this we are indebted to the COSY accelerator crew. We would also like to thank Ch. Hanhart for many valuable discussions. The support from FFE grants of the Jülich Research Center is gratefully acknowledged.References
- (1) J. Berger et al., Phys. Rev. Lett. 61, 919 (1988).
- (2) B. Mayer et al., Phys. Rev. C 53, 2068 (1996).
- (3) M. Pfeiffer et al., Phys. Rev. Lett. 92, 252001 (2004)
- (4) C. Wilkin, Phys. Rev. C 47, R938 (1993).
- (5) R.S. Bhalerao and L.C. Liu, Phys. Rev. Lett. 54, 865 (1985).
- (6) A. Khoukaz et al., Eur. Phys. J. D 5, 275 (1999).
- (7) S. Barsov et al., Nucl. Instr. Meth. A 462, 364 (2001).
-
(8)
F. Irom et al., Phys. Rev. C 28, 2380 (1983);
G.W. Bennett et al., Phys. Rev. Lett. 19, 387 (1967);
N. Katayama et al. Nucl. Phys. A 438, 685 (1985). - (9) A. Wrońska et al., Eur. Phys. J. A 26, 421 (2005).
- (10) M. Betigeri et al., Phys. Lett. B 472, 267 (2000).
- (11) R. Bilger et al., Phys. Rev. C 65, 044608 (2002).
- (12) H.-H. Adam et al., Phys. Rev. C 75, 014004 (2007).
- (13) T. Rausmann and A. Khoukaz, COSY proposal #157 (2006); www.fz-juelich.de/ikp/anke/en/proposals.shtml.
- (14) J. Smyrski et al., Acta Physica Slovaca 56, 213 (2006).