Measurement of the Enhanced Screening Effect of the d+d Reactions in Metals
Abstract
The investigation of the d+d fusion reactions in metallic environments at sub-Coulomb energies demands especially adapted techniques beyond standard procedures in nuclear physics. The measurements which were performed with an electrostatic accelerator at different self-implanted metallic target materials show an enhancement of the reaction cross-section compared to the gas target experiments. The resulting electron screening energy values are about one order of magnitude larger relative to the gas target experiments and exceed significantly the theoretical predictions. The measurements on deuterium inside metals are heavily affected by the interference of two peculiarities of this system: the possibly very high mobility of deuterium in solids and the formation of surface contamination layers under ion beam irradiation in high vacuum systems. Thorough investigations of these processes show their crucial influence on the interpretation of the experimental raw data. The differential data acquisition and analysis method employed to it is outlined. Non observance of these problems by using standard procedures results in fatal errors for the extraction of the screening energies.
keywords:
low energy nuclear reactions , deuteron fusion , electron screening , target instability , ion beam induced chemical reactions , data acquisition and analysis , target surface contamination layersPACS:
25.45.-z , 25.60.Pj , 07.05.Fb , 07.05.Kf , 68.43.-h1 Introduction
A lasting topic in nuclear astrophysics is the screening of the nuclear Coulomb potential due to the atomic electrons in laboratory nuclear physics experiments which alterate the experimental reaction cross-sections at low energies relative to the bare nucleus [1]. In contrast to the laboratory experiments performed on gas targets, the screening effect in astrophysical plasmas is mainly evoked by free electrons and leads in the case of strong coupling to an enhancement of nuclear reaction rates in the interior of stars by many orders of magnitude [2, 3]. Indeed, the conditions of the stellar plasma are hardly accessible for laboratory experiments. Nevertheless the knowledge of the progression of nuclear reactions inside a plasma is crucial for the quantitative understanding of stellar processes. We therefore investigated the d+d fusion reactions in metallic environments where the electron gas can serve as a model for a cold, dense, and strongly coupled plasma. As a result we first observed a grossly enhanced screening effect wherein the screening energy is one order of magnitude higher [4, 5, 6] than in the case of a gaseous deuterium target with [7]. Subsequent similar results were achieved by other authors [8, 9, 10, 11, 12, 13]. The theoretical calculations [14] provide screening energy values smaller by a factor of two compared to the experimental ones. On the other hand these experimental data were achieved with standard data acquisition and analysis methods [15, 10, 9] and are inconsistent [16]. The conditions in condensed matter are special because of the utmost high mobility of the small hydrogen atoms. Therefore one can suppose neither a stable nor a homogeneous deuteron density distribution which is required by the standard analysis method. Furthermore the residual gas in the high vacuum systems common in nuclear physics set-ups inevitably promotes ion beam induced chemical reactions on the surface. Thus surface layers are built up consisting of metal oxide or carbon deposits with different and varying deuteron densities. If this is not taken into account fatal misinterpretation of the raw data is impending. To address these problems we developed a specially adapted data analysis method and thoroughly investigated the ion induced chemical surface reaction mechanisms and their influence on the obtained screening energies which is outlined in this work.
2 Experiment
An outline of the first experiment has already been given in Ref. [5] for which more details are given here and complemented by the modifications and additions necessary for the in-depth investigation of the influences from effects of surface physics. The set-up of the experiment is depicted in Fig. 1 showing supplementary details of the vacuum system since this has special significance.
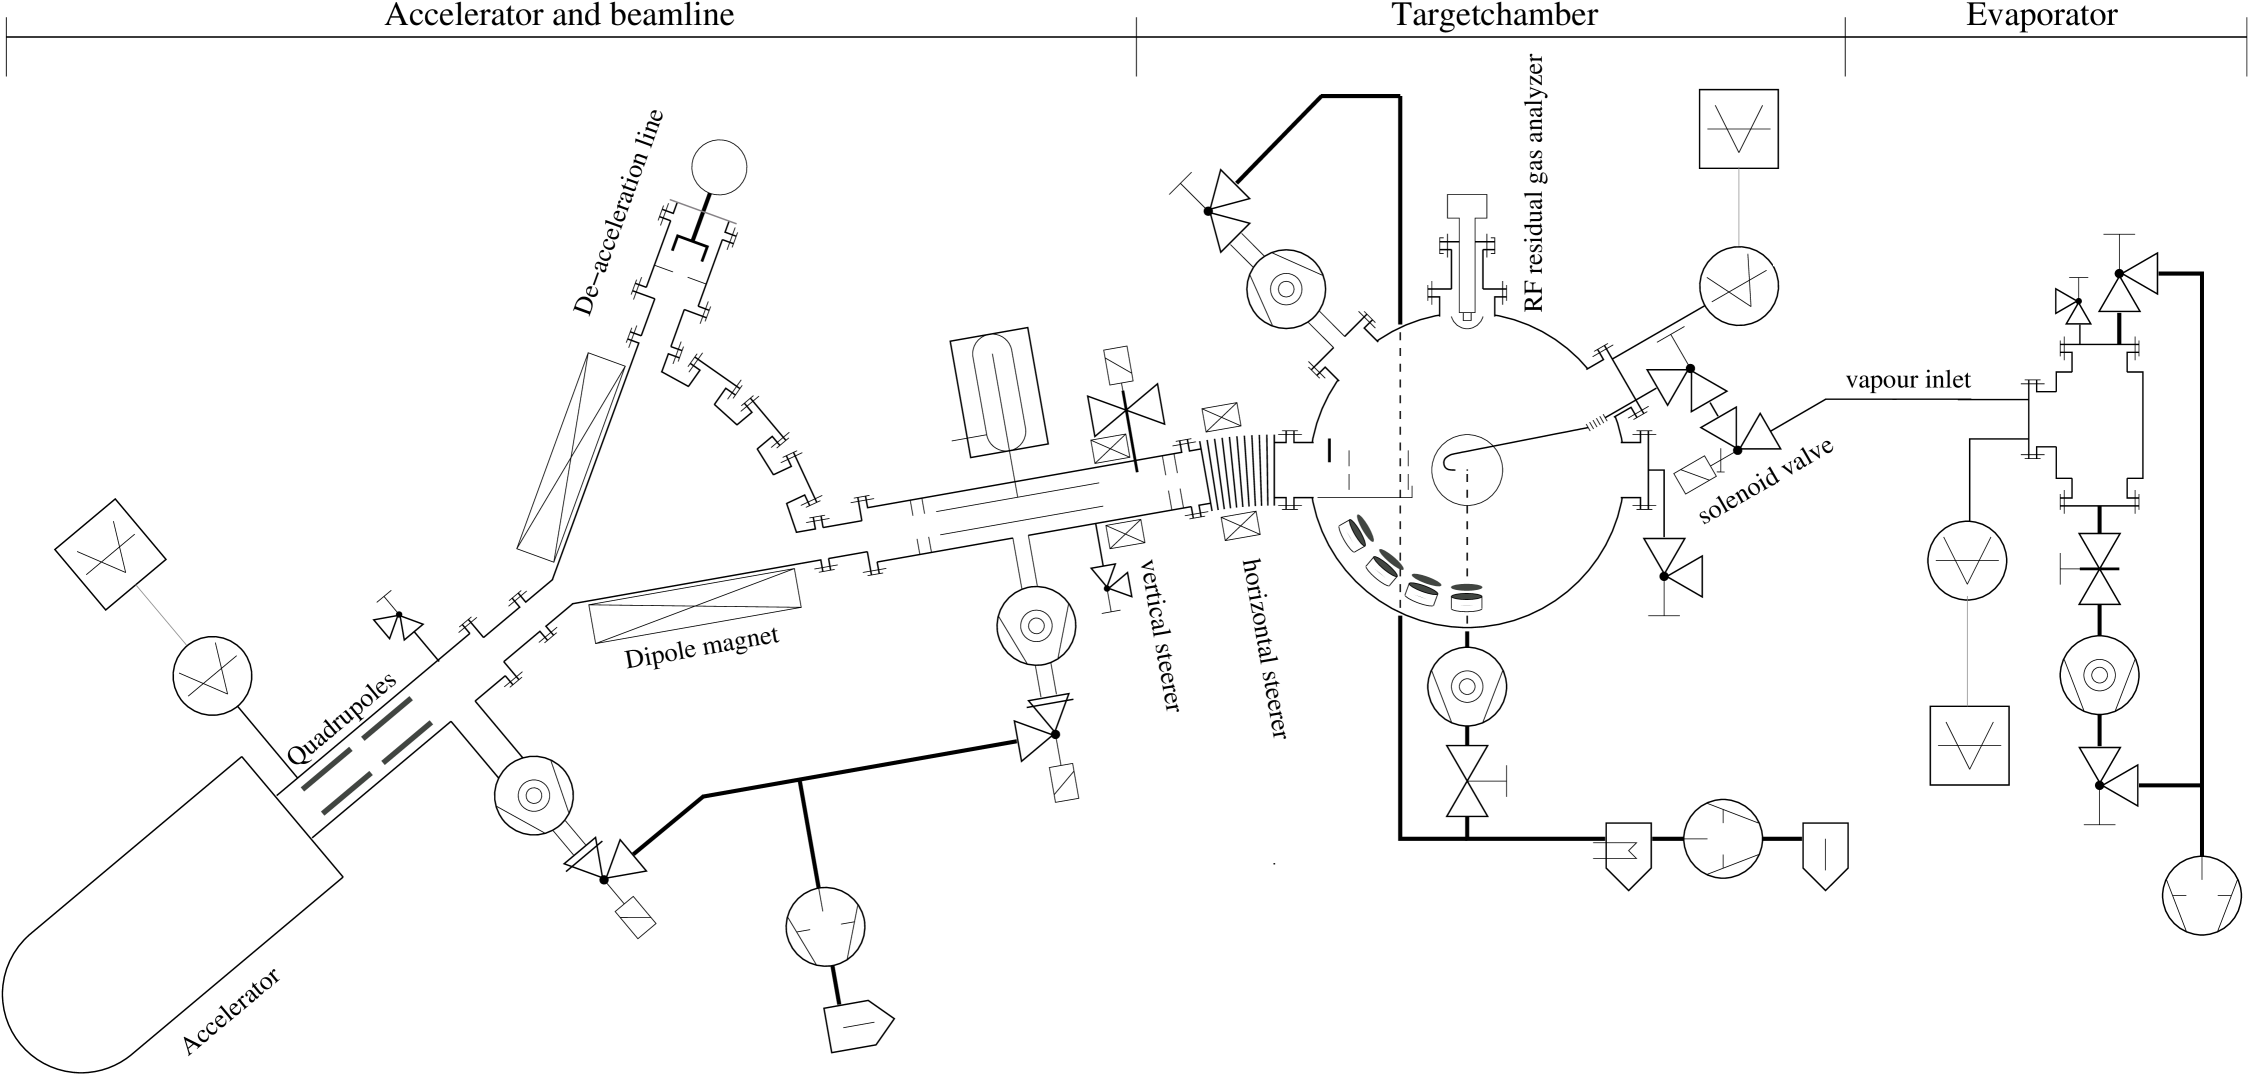
The experiment has been performed at a cascade accelerator with a RF-ion source. A highly stabilized power supply provided the acceleration voltage. The high voltage corresponding to the beam energy was measured by a precise voltage divider with an accuracy better than . It was mounted along the acceleration tube and includes the extraction voltage of the ion source. The long term energy stability was about . Since the cross-section is exponentially dependent on the projectile energy it is particular important to control the energy determination. Therefore on the opposite side of the beamline at the analyzing magnet an additional set-up was installed with which the kinetic energy can be measured by means of the opposite electric field method. A property of RF-ion sources is a voltage drop in the plasma depending on the adjustment parameters which reduces the kinetic energy of the ions below the extraction voltage [17]. Therefore the beam energy is lower than inferred from the voltage divider by an average of . Furthermore the ions leave the source with an energy spread of on an average due to the spatial extension of the extraction zone [6]. This energy spread leads to an effective positive energy shift in a thick target and for a nonresonant reaction [5, 6]. However, it cannot compensate the energy loss from the voltage drop. The beam consisting of and ions was focused by a pair of electric quadrupoles and then analyzed in a magnetic dipole.
The beam line and the chambers of the vacuum system are made from aluminum with elastomer rings at the joints. The vacuum is maintained by turbomolecular pumps with auxiliary oil lubed two stage rotary vane pumps and can reach at best in the target chamber and the cryogenic beamline. In such a high vacuum system water vapour is the dominating constituent of the residual gas being slowly desorbed from surfaces. A RF-quadrupole rest gas analyzer with a Faraday cup detector was installed at the target chamber in order to monitor the composition of the residual gas. The fraction of water can be distinctly reduced with cryogenic traps. After the analyzing magnet the beam is led through a LN2-cooled Cu tube. The beam route inside the target chamber is covered by a LN2-cooled plate. Those cryogenic traps can remedy another problem provided the leakage rate is not too high: It is known that oil from the rotary vane pumps can backstream in low quantities even through modern turbomolecular pumps. This would lead to a deposition of carbon in the beam spot.
Directly in front of the target chamber the beam is deflected by an angle of about 10∘ by a magnetic steerer in order to remove neutral particles. In extension of the undeflected beam an isolated beam sink is mounted just behind the entrance to the target chamber connected to an amperemeter. Therewith the beam can be adjusted without disturbance of the deuteron density within the target. The beam was focused on the target into a spot of about in diameter with the aid of apertures. The charge collected was determined via the measurement of the electric current on the target holder which was isolated from the target chamber. A negative voltage of was applied to a surrounding metallic cylinder for suppression of secondary electrons. All charged particles (3He, 3H, p) from d+d reactions were detected with four PIPS-detectors fixed at lab angles of 90∘, 110∘, 130∘ and 150∘ with respect to the beam in distance from the target. Aluminum foils of thickness in front of the detectors prevented elastically scattered deuterons from entering the detectors. Therefore the spectra allow for the clear distinction of all three spectral lines as shown in Fig. 2.

In order to be able to partially change the composition of the ambient gasmix in a controlled manner (Sec. 4) a precise solenoid valve is mounted at the target chamber which is used for the injection of gas. The fraction of the infused gas is maintained at the desired level by feedback from the vacuum gauge and the residual gas analyzer with a process computer. A detachable conduit leads the gasflow to the target surface. Despite its openings the cylinder around the target presents a significant obstacle for the molecular gas flow in high vacuum. Therefore a turbomolecular pump is installed below the target which exhausts this delimited volume. Non-gaseous agents can be transfered to the gas phase in another vacuum chamber, the evaporator. However, certain restrictions apply. The gas flow at the inlet of the solenoid valve must still be viscose otherwise the conductivity approaches zero where no valve regulation is feasible any more. Therefore the vapour pressure needs to be high enough. The other restriction requires the vapour pressure of the agent to be higher than that of the pumping oil of the rotary vane pump which is already fulfilled parenthetically by the first restriction. The turbomolecular pump is used to exhaust the chamber for cleanup before letting in the stuff to be gasified. The evaporator is a high gas flow system which is pumped in normal operation at low vacuum by the rotary vane pump only.
3 Analysis and experimental procedure
3.1 Angular distribution
A special property of the d+d reactions is the anisotropy of the angular distribution down to the lowest energies which is due to the dominance of resonance levels of negative parity in the -system. Since the deuteron has positive parity a spatial angular momentum of is required for a coupling to these resonances that partially compensates the centrifugal barrier. This anisotropy cannot be neglected even at the lowest deuteron energies. We therefore used four detectors at different polar angles (in the lab-system). Deuterons are bosons and appear as identical particles in the entrance channel. Therefore the scattering amplitude must be symmetrized, which leaves only Legendre polynomials with even in the expression for the differential cross-section. Therefore the angular distribution is symmetric to . After base transformation it is expressed by
| (1) |
where is the scattering angle and the solid angle element in the CM-system. With four detectors only two addends can be determined. The four counting numbers gives with the number of incident deuterons an angle dependent yield at the lab-energy
where is the solid angle of the detector in the lab-system and its efficiency. On the right side the yield is given by theory with the target particle density and the target thickness . Three problems arise from this expression: First, the differential cross-section is given in the CM-System. In the second row the coordinate-transformation is performed. is the transformation function for the solid angle element between the lab-system () and the CM-system (). Second, it is only valid for very thin targets. For thick targets an integration over the depth (and therewith the projectile energy) in the target is required. Such would result in an expression which is impracticable for a fit to the experimental data in order to determine the . Third, in our case of autoimplanted targets the target particle density is unknown. We therefore chose a procedure analog to Ref. [15] where the coordinate transformation is performed at the beam energy. This is justified by the conjuncture that the yield is dominated by reactions at the highest energies, particularly in the sub-Coulomb energy range where the cross-sections decreases exponentially. Therefore Eq. (3.1) transforms into
| (3) |
Introducing the differential counting number , using Eq. (1) and resorting results in
| (4) |
The product in front of the sum is constant for one measurement series and can be included in the expansion coefficients . This model function can now be fitted to the experimental data. The total counting number for the full solid angle is then obtained by
| (5) |

3.2 Differential analysis method
An automatic (on-line) data acquisition system integrates the proton peaks of the spectra at fixed time intervals ( - ) and records the four counting numbers and the collected charge in a file. With Eq. (3, 4, 5) this can be reduced to the tabulated function . The solid angle element therein was determined with a radioactive calibration source (241Am). For the sake of synopsis the data analysis method is depicted in a tabular form (6). Quantities provided by the experiment are in column (6.A), terms from theory in column (6.C).
|
|
(6) |
The total yield is now evaluated according to (6.1). Starting from the yield calculates as (6.A1) with the efficiency of the detector which is 1 for PIPS-detectors. The number of incident deuterons is expressed by the collected charge with (6.A2) where is the charge state of the projectile which is 1 for and for . This leads to (6.A4). Due to the high mobility of hydrogen in metals which is many orders of magnitude greater than for larger atoms [19] the stability of the target particle density is not guaranteed any more. Therefore the usual assumption of a uniform and time invariant particle density is not applicable for this situation. Consequently the derivative (6.A1) must not be simply replaced by the difference quotient for the yield of one measurement in the usual manner. Instead a changing yield function (6.AB4) needs to be retained. Otherwise misinterpretation of the raw data is impending (Sec. 6). The applied discretization increment time equivalent of the function is short in comparison to the implantation and diffusion times. The deuteron density in (6.C1) is likewise dependent on and in general on the target depth . The targets are infinitely thick in relation to the range of the projectile ions. Therefore the integration over the depth is required.
The depth on its part can be substituted by the ion energy using the linear stopping power relation (6.D2). The term in brackets contains the stopping power coefficients for the host metal and deuterium whereby the later is weighted by the ratio of the deuterium density in the target to the density of liquid deuterium. The stopping power function is valid for the energy range below where the Lindhard theory [20, 21, 22] provides a good explanation with . The numerical value of the stopping power coefficients can be taken from the compilation of Ref. [23]. They also state that an exponent of fits the experimental data better. For our purposes this difference has low impact. The stopping power coefficients have an error between . It is therefore highly desirable to manage without them. According to Braggs rule [24] only the mass-specific stopping powers can be linearly added. In this special case however where the hydrogen number density is set in relation to the metal number density (i.e. ) a brief calculation shows that (6.D2) holds. Since is unknown in (6.C1), a reference for the cross-section is required which is provided by Ref. [18] as essentially a S-factor parameterization (6.D3). Their measurements have with an error of by far the highest precision. In this case it is presupposed that the density is independent of the depth a factorized expression for accrues (6.C4) with a charge dependent term (gray shaded) and the energy integral (framed). The charge dependent term contains the density which can be calculated using the stopping power coefficients. Before the measurement we implanted our targets up to a saturation level in the proximity of the stoichiometric ratios known from physical chemistry [19] (). Under these conditions the homogeneity of the density is substantiated. We will reinvestigate this assumption in Sec. 4.3.
The derivation up to now serves as a motivation for the introduction and definition of the reduced yield (6.AB5) which originates from the previous equation (6.4) by division with the energy integral. The experimental yield in (6.A5) is calculated from (6.A4). A numerical differentiation is considered instable which is additionally aggravated because the counting number is scattered by the counting statistics111Markoff’s formula is not applicable under this circumstances [25, chapter 25]. . Hence we used cubic spline polynomials with natural border conditions in order to calculate the derivative at the ’s from their monomial coefficients. This equalization function is well defined also at the borders of the interval. The charge dependent term containig the density in (6.C5) indicates that is constant for all energies and independent of the implanted charge if the previous assumption of a homogeneity is valid and the experimental yield does not deviate from the functional progression in the energy integral (6.A5). Therefore the reduced yield is a sensible indicator for any such deviation, be it changes in the number density, the stopping power or effects which modify the cross-section like screening. Which of these is efficacious is a matter of interpretation and is determined by the theoretical expression for the yield. Since our observations showed a strong energy dependence of , we take this effect into account by the introduction of an energy dependent factor in (6.C5). Obviously can be calculated by the quotient of a reduced yield modified in the said manner and the unmodified reduced yield (6.A6). This is equal to the quotient of the corresponding yields (6.C6) since the energy integrals from (6.A5) shorten themselves. If the modification is attributed to electron screening the screened yield can be written as (6.D6) in close analogy to Ref. [1] where the screening energy is added to the kinetic energy. The factor 2 arises from the CM-Lab-transformation. This would result in
| (7) |
which shows that is an enhancement factor for thick targets in analogy to the enhancement factor for thin targets from Ref. [1]
using the S-factor parameterization of the cross-section in the second line and applying an approximation in the third line, which demonstrates its qualitative behaviour as a roughly exponential increase for decreasing energies.
Because the unmodified reduced yield is unknown we use a normalization at a fixed energy what is implemented by the definition of the normalized enhancement factor in (6.AB7). This definition is equally free from restrictive presuppositions as the one for the reduced yield (6.AB5). Obviously (6.C7) follows from (6.C5). Fig. 4 demonstrates the practical analysis procedure.
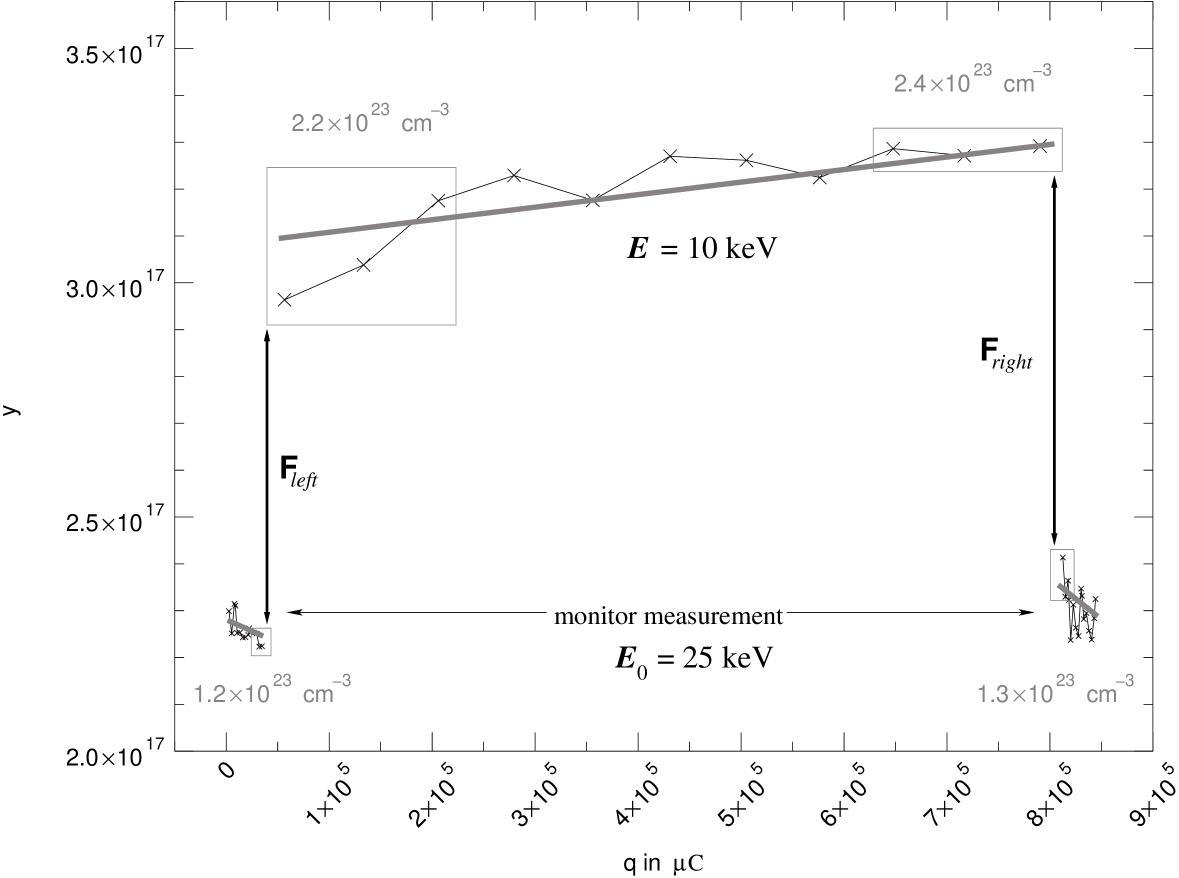
We chose the normalization energy at because the effects of the screening enhancement are low here. The reduced yields of a measurement at the energy are consecutively compared to these of the monitor measurements at . The straight lines are just for guidance. The normalized enhancement factor is determined by the ratio of the reduced yields at the discontinuities (Fig. 4 and ). Since the measurements used for the data pooling are taken at the saturation density close to the stoichiometric ratio and the switch of the projectile energy followed by the measurement of the reduced yield happened very quickly () the discontinuity cannot be caused by a change in the target deuteron density perhaps due to a different projectile flux or energy deposition in the target. The gray rectangles indicate the points from which the error for is inferred. Thus not only errors from the counting statistics are included but also from other deviations of the reduced yield e.g. long term changes of the density. Therefore from line (6.6) on the charge dependency drops out. We attribute the discontinuity to the screening effect whereas the long term changes of at a fixed energy are caused by the development of the density . In that way we can discern both causes for the variations of which is not possible if only total yields were compared. We also do not need to know the absolute value of the particle density and are independent of the stopping power coefficients. Accordingly the reduced yield is described with Eq. (6.D6) and results in the theoretical expression for the normalized enhancement factor
| (9) |
with the single fit parameter . The theoretical curve for is in good agreement with the experimental points as Fig. 11 (right, bottom) shows and consequently confirms the implied assumptions. So far is used as an energy shift parameter which can be a sum of several effects not exclusively screening. The reduced yield can be used to calculate a density estimate by solving Eq. (6.BC5) towards with the inherent suppositions and ignoring :
| (10) |
The gray numbers in Fig. 4 represent average densities for the rectangles below computed in such a way. The stopping power coefficients are exclusively necessary for it. Because of the nonlinear relation between and the magnitude of the discontinuities between the energies is different, too.
4 Beam induced surface reactions and layer formation
Apart from other possible error sources, particularly the energy definition, it turned out that the dominating error source is the formation of layers at the target surface. Therefore this subject needs special experimental and theoretical treatment in order to recognize its repercussions and realize the underlaying mechanisms.
4.1 Surface effects
The processes taking place at the target can be understood in terms of vacuum and surface physics, chemistry and nuclear radiotomy.
It is well known in nuclear physics that oil from the forepumps is cracked up and deposited as carbon layers inside the beam spot onto the target surface. This nuisance can easily be avoided by the use of LN2-cooled cryogenic traps. But there is another problem that has usually no attention: Water molecules adsorbed at the target surface can be dissociated under the impacting beam ions and the produced oxygen radicals in chemisorption form strongly bonded metal oxide layers at the surface. This process is progressing into the bulk of the target material along the damage track of the de-accelerating ions. It is even speedup by an effect known as embrittlement from the physical chemistry of the metal hydrides [19] which means that the crystal structure of the metal is bursted by the recrystallization process that accompanies the formation of the metal hydride crystal thus preparing the way for the oxygen radicals. Therefore the metal oxides can build up to a thickness of more than 100 atomic layers. Since oxygen has a higher affinity to metals than hydrogen no metal hydride formation happens any more. Instead hydrogen is segregated in the metal oxide with very low and instable densities. Since the hydrogen depleted zone has a higher impact for lower beam energies on the integral in Eq. (9) the normalized enhancement factor becomes for (Sec. 4.3). Finally no screening is visible under this circumstances. When measuring reactions on metallic nuclei metal oxide layers at the surface are not an issue because the beam energies are in the high k eV and M eV region where the range of the ions in the target is high in comparison to the thickness of the layer. Moreover the oxidation only loosens the surface structure 222Very light metals like lithium and beryllium are used in form of their salts that cannot oxidize of course. . Therefore the situation in metal hydrides is singular where very low energies are required for the investigation of the screening at deuterium in combination with the high stopping powers of the metals and that is why contamination layers are fatal (Sec. 4.3).
Vacuum components that has been exposed to room ambient for extended times may contain up to 100 monolayers of water vapour. The desorption rate of water at room temperature is so low that it cannot be pumped off from a high vacuum system in practicable periods of time without baking but remains as the dominating constituent of the residual gas. Fig. 5 illustrates the situation at the target.
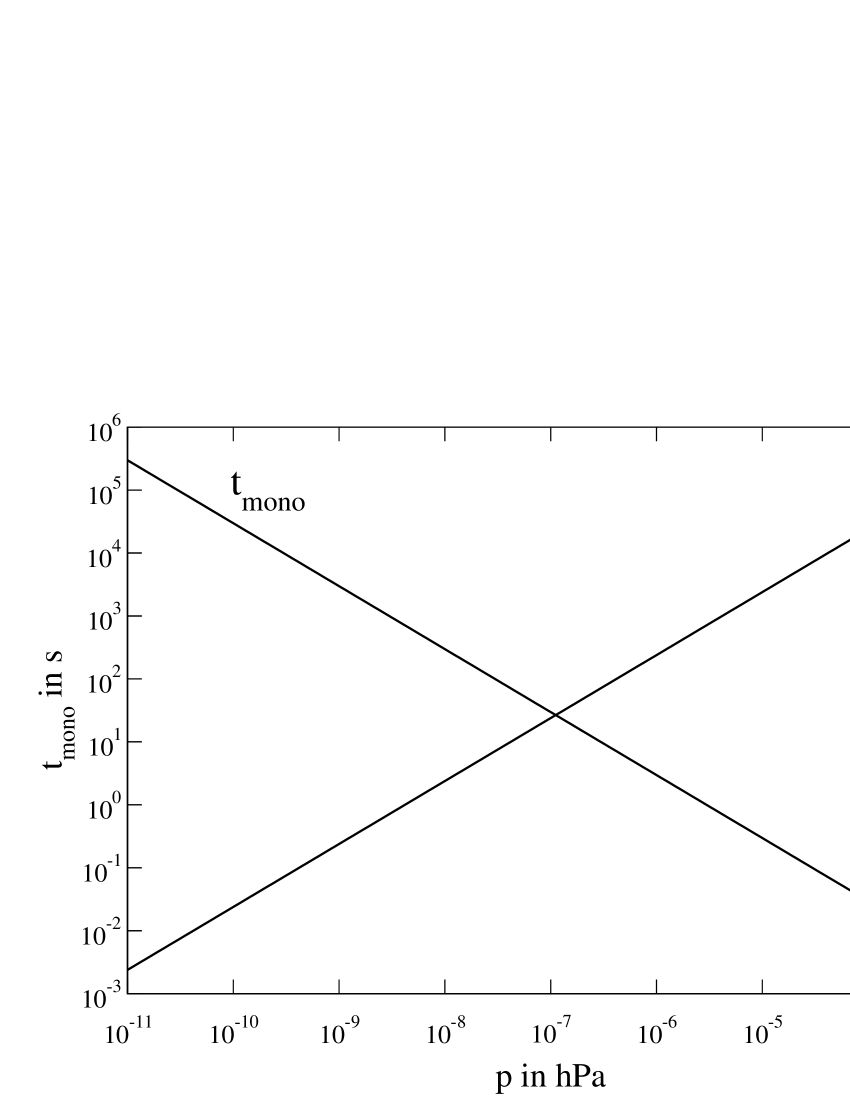
Of interest are the hit rate at 333 with the molecular weight of water in atomic mass units \atomicmass. and the time it takes to build up one monolayer of water molecules at the target surface 444 with the distance between the water molecules at the target surface assumed as and the sticking coefficient . . In the pressure interval the hit rate is in the order of magnitude . This is comparable to the ion flux of for a current of with a beam diameter of . Therefore there is sufficient supply for the oxidation process even if the target was originally clean. The time for mono layer formation is in the range for the above pressures. Withal is assumed that water has a sticking coefficient of 1.
Due to its extraordinarily high dipole momentum of water has a high binding energy to solids and is hence chemisorbed to surfaces with preferable the oxygen atom oriented towards the surface. There are also counteracting processes like thermal or ion stimulated desorption and sputtering. Heating the material is the way of choice in vacuum technologie to speed up the desorption of water from the surfaces. This works well for the upper layers but for water molecules at the joint face to the solid there is another option aside from being desorbed [26, 27]: The chemisorbed water molecule can simplified be described by a Lennard-Jones type potential. There is another such potential which describes a chemisorbed oxygen atom with its minimum closer to the surface and deeper. The intersection of this two potentials defines the activation energy barrier to dissociative chemisorption, i.e. the protons are splitted off so that the oxygen atom can form a firmer bond to the metal [28, 29], what eventually leads to metal oxide formation. An interesting and apparently paradox phenomenon is now that the probability for sticking and dissociative chemisorption becomes greater with raising temperature if [27]. In this case heating proliferates the oxidation process which is only stopped by the condition that the change of the free enthalpy after and prior to the surface reaction must be negative. Since the entropy difference is negative for the adsorption and positive for desorption the process will eventually turn over. If desorption is preferred. The impacting beam heats the target considerably because the beam energy is dissipated in a volume with a thickness of .
But besides heating and phonon generation the traversing ions can directly interact with the adsorption complex by excitation and ionization providing activation energy and thereby enabling chemical reactions which under normal conditions will not occur. Therefore even noble metals can be oxidized this way. If a projectile hit removes an electron from a binding orbital the adsorbed particle may suddenly be via a Franck-Condon transition on the repulsive part of an ionic potential. It is accelerated down the slope and arrives as a positive ion at the gas phase. This would be ion stimulated desorption. However the ionic potential curve has intersections with a manifold of excited states of the adsorption complex where the particle can jump to any one of these which can eventually lead to dissociative chemisorption again. In either case it depends on the concrete form of the interaction potential whether dissociative chemisorption or desorption prevails. This means that there is a strong material dependency but the ion energy and flux exert a significant influence too. Generally reactive metals have a higher oxidation rate then less reactive ones. As a matter of principle sputtering can clean surfaces by removal of the top atomic layers. This is here a side effect of the irradiation. We could observe on surfaces in the viewing solid angle of the beam spot blue brown coloured films. An EDX-analysis showed that those films consist of oxygen. Therefore sputtered oxygen radicals produced metal oxides on other surfaces. Yet the sputtering yield of the lightweight deuterons is too low to keep the metal surface clean; the ion stimulated oxidation prevails.
So far the oxidation of the metal with the vanishing of the screening effect may seem inevitable in high vacuum. Fortunately there is a process that can prevent the oxidation. Carbon hydride molecules can be physisorbed at the surface, dehydrated under ion irradiation and the remaining carbon radicals can react with oxygen to carbon monoxide which leaves the surface into the gas phase. The metal surface acts as a catalyzator that condenses and concentrates the two agents for the ion induced chemical reaction and remains unchanged. The difficulty in using this mechanism in order to keep the target clean is that this works only in a narrow and labile equilibrium for the dosages of water and the carbonhydride. Owing to the tetrahedral structure of the carbon sp3-hybrid orbitals carbonhydrides are unipolar. Consequently, they can interact through van-der-Waals forces and be physisorbed to surfaces only. Ion irradiation causes a rupture of the C-H-bond in carbonhydrides [30]. The residual carbonhydride radicals with unsaturated C-bonds are very reactive and are now chemisorbed at the surface where the dehydration by ion impact can be continued. For this carbon adatom generation with subsequent CO-reaction to take place the initial break up of the C-H-bond must happen in the physisorbed state. Physisorption is usually a weak bond. Thermal and beam stimulated desorption antagonize in contrast to the situation of water. Regarding the n-alcanes every CH2,3-group adds a bonding energy of through van-der-Waals interaction. With increasing length of the chain the intermolecular interaction can achieve considerable magnitudes and becomes even greater than the intramolecular forces at the C-C-bond. Large n-alcanes do not perform phase transitions any more but disintegrate instead. Therefore the phase transition temperatures (or just as well the vapour pressures) are a measure for the strength of the total van-der-Waals force of the molecule and accordingly for the physisorption what can as well be illustrated by the mirror charges induced into the metal surface. For longer alcanes the process will work better than for shorter ones.
4.2 Gas admixture experiments
A very expandable experimental campaign provided evidence for the previous picture of the processes at the target which explains the encountered phenomena.
As already said not using the cryogenic traps causes a gray carbon film to be deposited in the beam spot. The carbon film is implanted with deuterium, too whereby densities of can be achieved. Interestingly enough carbon does not show any discontinuities of the reduced yields which indicate screening. Two separate measurement series with different carbon film preparation techniques verified that. The pumping oil is so effective that small traces are enough in order to build a carbon layer. The oil fragments were hardly above the detection threshold of the RGA. The pumping oil is Balzers P3 and has a molecular mass of which would correspondend to 35 carbon atoms and a vapour pressure of at 555Balzers did not want to provide information about the chemical structure. . The computer regulated solenoid valve was used to inject oxygen (O2) into the target chamber while irradiating an aluminium target in order to compensate the oil excess. Even at the highest pressure that was justifiable with this pump arrangement no detectable change in the implantation behaviour could be observed. Therefore gaseous molecular oxygen had no effect on the layer formation. Using the evaporator to inject water vapour a moderate increase of the pressure was sufficient in order to oxidize the target surface. On the other hand with the active cryogenic trap methane (CH4) was given a trial. Methane had likewise no effect. Only at the highest pressure of some carbon precipitated at the rim of the beam spot where the temperature and as a result desorption is lower. The results are in good agreement with the above statements. Unipolar weakly bound molecules like oxygen and methane are preponderantly desorbed by the beam and do not contribute to the surface reactions whereas water proofed to be the source for the oxidation of the metals. The viscose pumping oil is highly effective in providing carbon radicals at the surface. Nonetheless it is not easy to achieve the desired equilibrium with it mainly because it is effective close to the detector threshold and it cannot be handled with the injector. For this purpose a RGA with electron multiplier detector and a high vacuum dosing valve would be required. Both were not available. Besides the partial pressure of the oil was not stable so operating with a regulated water vapour injection alone had no lasting benefit, too.
The alkane with the lowest vapour pressure that fits into the design restrictions of the evaporator including a safety margin is decane (C10H22). Its vapour pressure is at . Putting up with possible penalties due to its lower interaction force in comparison to oil it was the best compromise with the given equipment. With varying decane partial pressure the equilibrium where the target surface keeps clean was then framed.
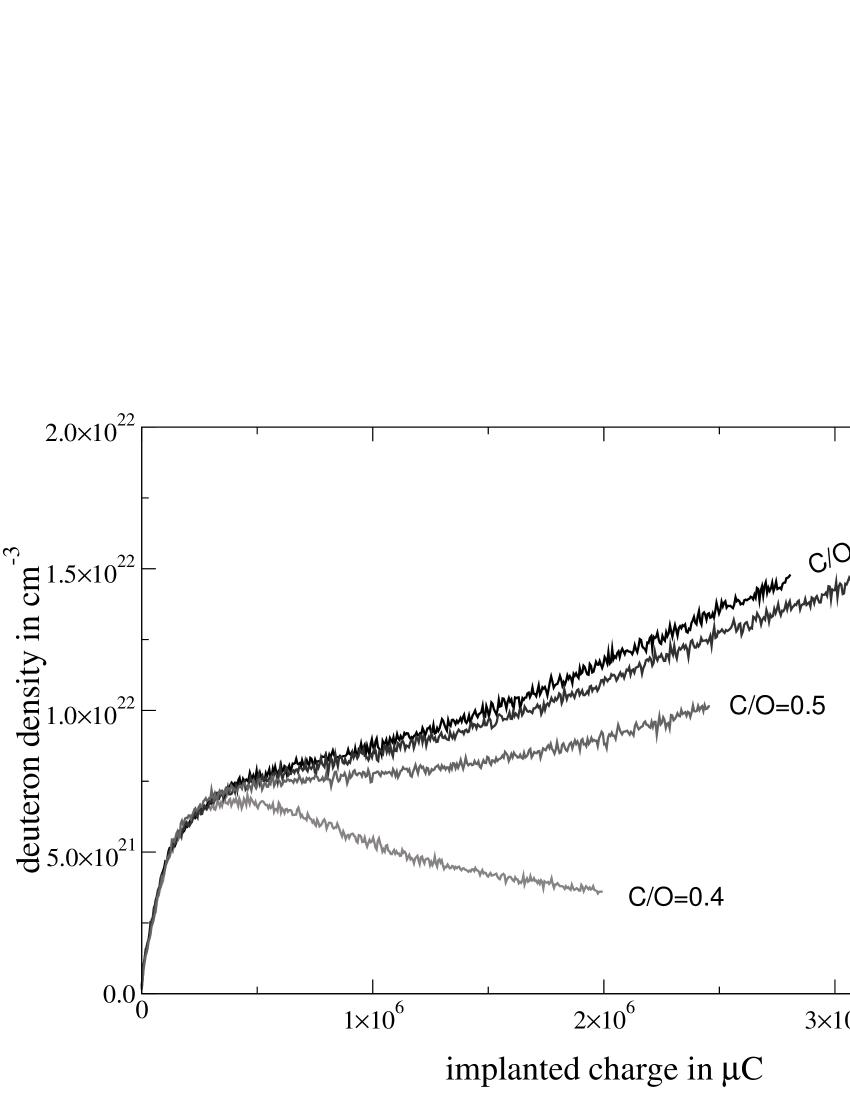
Fig. 6 shows the initial implantation curves for different C/O-ratios on aluminium with a beam current of . The C/O-ratio is defined by the partial pressures of decane and water as . Since the partial pressures are measured by the RGA far away from the target with significant obstacles for the molecular flow in between the actual value of the C/O-ratio at the target can deviate considerably. The deuteron densities are calculated with Eq. (10) from the tabulated reduced yield function provided by the automatic data acquisition system. Eq. (10) implies the supposition of a homogenous depth distribution what is not valid for the initial implantation process before saturation of course. So for the non-saturated case the density from Eq. (10) is rather to be interpreted as a depth averaged value. The lowest curve represents the behaviour during the creation of a metal oxide layer. The deuteron density remains an order of magnitude below the stoichiometric ratio. It reaches a maximum at the beginning for more reactive metals like aluminium in this example. Increasing C/O-ratios lead also to an accretion of the densities which continue up to the saturation density at the stoichiometric ratio. But too high C/O-ratios causes the build up of a carbon layer covering the metal. Here the ratio is within the equilibrium window.
The C/O-ratio is the command variable in a cybernetic cascade regulating circle implemented on a process computer with the RGA as receptor. It is thereby held stable. The manipulated variable is the total pressure which is in turn the command variable for the inner regulating circle with the solenoid valve as effector.
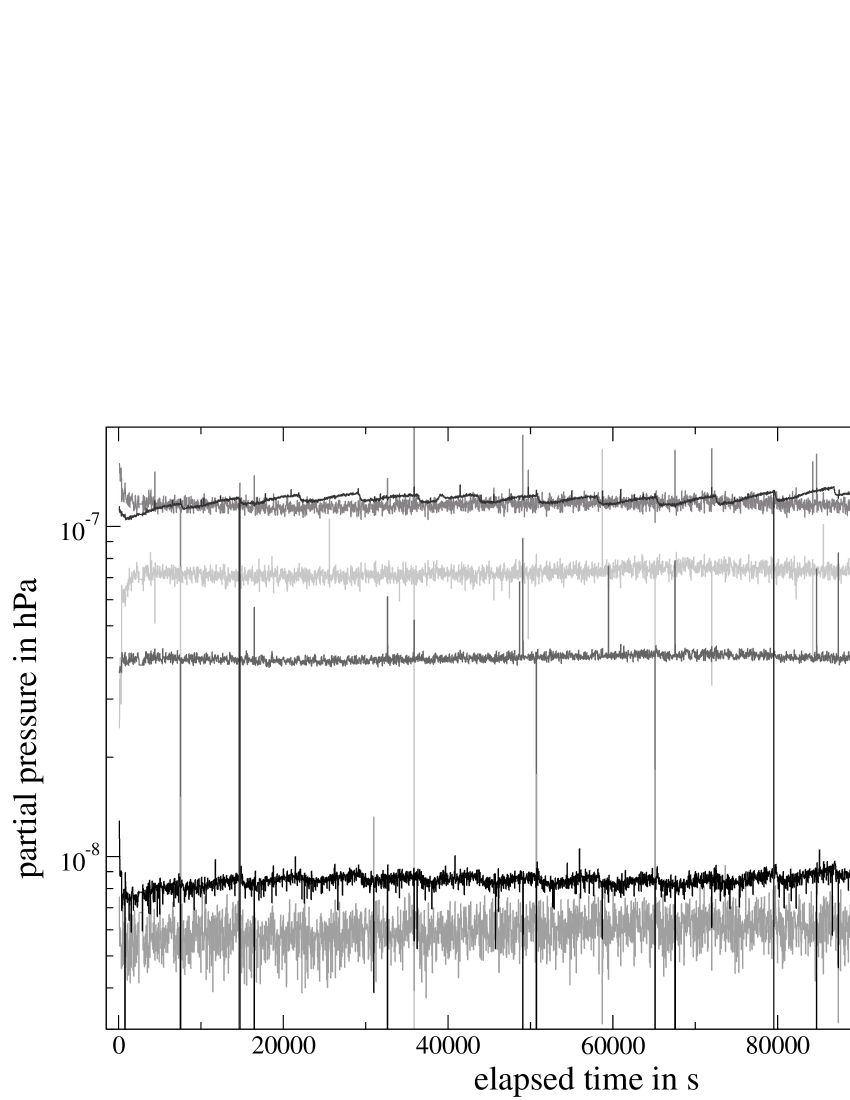
Fig. 7 shows the recorded partial pressures during a measurement with decane injection controlled by the regulator.
The RGA was not calibrated since we are only interested in the relative fraction of the residual gases. The partial pressures were calculated from the measured partial currents as usual [31] by solution of the linear equation system with the cracking pattern matrix [32, 33] and singular value decomposition. Even with the cryogenic trap water is the main constituent. Its pressure changes with the refill periods of the trap in the target chamber. Accordingly, the pressure of decane is adapted in order to retain the ratio. The outliers in the curves originated from mismeasurements of the RGA which are filtered out by the regulator program. Most interesting is the considerable pressure of carbon monoxide that is almost twice as high as the one of oxygen and on the other hand below the detection threshold without the beam. Although has no own molecular line in the mass spectrum but needs to share it with its fraction is significant. This is a direct proof for the assumed chemical reaction at the surface. The relative high fraction of argon is a holdover from the ventilation of the chamber for what dry argon was used.
Once the gas mixture is offside the equilibrium one of the two possible layers develops which proved to be irreversible. Further experiments evinced that the equilibrium ratio is strongly beam energy dependent especially for the low energies. Therefore the time consuming procedure of framing the equilibrium had to be repeated. At the C/O-ratio needs already to be in order to prevent oxidation. For even the maximal ratio of for the outer regulating circle was not sufficient. Only a pressure of could prevent oxidation. This behaviour bases on the fact that the effect of the ion beam on the target surface depends on the linear energy transfer into the target which changes with the beam energy. The lower the projectile energy the higher is the surface effect [34]. This implies an ion flux dependency incidentally which we could also observe. That is why we used fixed beam currents. For zirconium the situation was even worse: At yet with the mounted gas conduit zirconium oxide formation could only be prevented at high vapour pressures. On the other side for tantalum moderate pressures were sufficient to counteract the oxidation. The equilibrium pressure was in the interval from and showed a comparatively very low energy dependence. This clear target material dependence reflects the different interaction potentials and is in accord with the statements of the previous section.
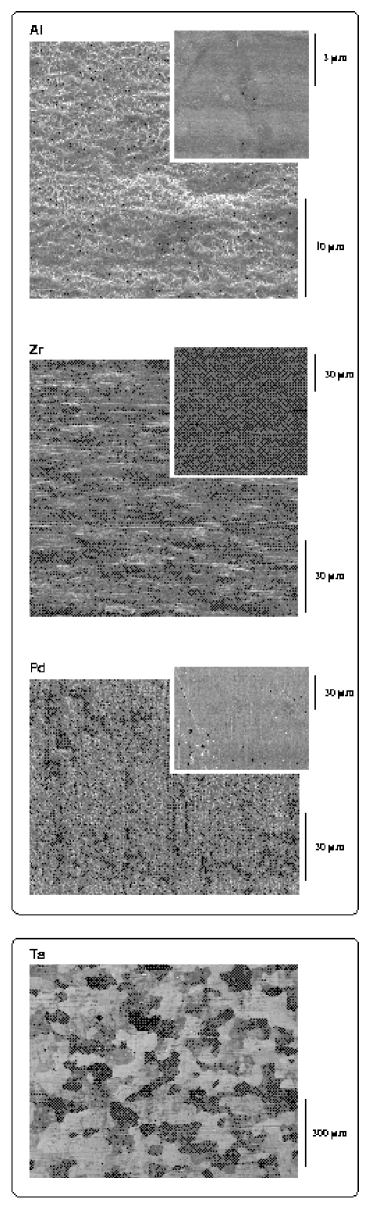
Albeit other processes interfere. More reactive metals i.e. with lower electron negativity oxidize more readily wherefore a higher decane pressure is required. They also form chemically stronger bond metalhydrides whereas less reactive metals merely allow for a segregation of hydrogen. Those reactive metals change their crystal structure while forming the metalhydride. If the hydration precedes not in a thermal equilibrium with low rates the material cannot compensate the tension of the recrystallization process and bursts; embrittlement occurs. Since deuteron implantation is far off the thermal equilibrium embrittlement is a hardly avoidable concomitant phenomenon for reactive metals. Such greatly enlarges the total surface while fractalizing it and enables the build up of thick metal oxide layers. Fig. 8 contains scanning electron microscopic pictures of some targets displaying areas inside the beam spot; the small inset pictures are from areas outside the beam spot for comparison. Aluminium develops a sponge-like coarse structure. It builds up a comparatively strong covalent bond to hydrogen while transforming from the cubic face centered structure of the pure element to the hexagonal structure of the hydride AlH3. Such definitely evokes a lot of stress in the material. Zirconium traverses not just one but several phase transitions with according changes of the crystal structure during the increase of the hydrogen density [35]. The embrittlement is on a smaller scale than for aluminium. The surface has a hill-like topography because the crystallites in the polycrystalline material may have different hydrogen concentrations and be in different phases with appendant crystal structures. The most reactive metals are in the groups I and II of the periodic table. They developed the strongest signs of embrittlement even on a macroscopic visible scale, e.g. dust particles crumbled from a strontium target, the thickness of a natrium target grew considerably. For them the injection of decane would not help. On the other side tantalum is almost a noble metal howbeit it can form a metallic bond to hydrogen in contrast to noble metals which only segregate hydrogen with low densities. It just stretches its lattice dimensions in order to accommodate hydrogen in interstitial positions reffering to the original crystal structure. Therefore the tension is low and can easily be compensated. Due to its noble character the surface interaction potential of water favours the oxidation not as much as for the more reactive metals why moderate decane pressures are sufficient. The surface topography does not change. The spotted picture comes from beginning layer formation and will be explained shortly. Palladium transmutes from cubic face centered to cubic space centered while being hydrated. The surface shows similarities to the case of aluminium. For Pd also a moderate decane pressure was enough to prevent oxidation. Therefore it is an example that embrittlement only promotes the metal oxide build up if the interaction potential already favours dissociative chemisorption of water.
We carried out two experimental campaigns in oder to study the electron screening effect. The results of the first campaign have been reported in previous publications [4, 5]. The second campaign had had the purpose to compact the datapoints, heighten precission and to cover larger shares of the metals in the periodic system. Therefore the experimental set-up including the accelerator was completely renovated and revised in order to increase the beam current and the reliability for long term measurements. The vacuum could also be improved by almost an oder of magnitude. The principal set-up of the campaign I is basically the same as that of the campaign II save of the gas injection and analyzing equipment. With this new set-up only implantation curves of the type of the lowest curve in Fig. 6 were obtained which results from oxidation where no screening can be observed. Water and with it insufficient vacuum was soon identified as the reason. On the other hand the EDX-Analysis of the remaining targets of the first campaign proofed that there was no additional metal oxide layer. It raises the question how this could be possible with a worse vacuum. Therefore the second campaign needed to change direction in order to investigate this phenomenon and to reproduce the previous results. The carbon oxygen reaction is the mechanism that keeps the surface clean. The higher gas load led to a saturation of the cryogenic trap. Therefore backstreaming pumping oil is not trapped as effective as in a better vacuum. The equilibrium where the target surface keeps clean is much broader and therefore much less energy dependent than for decane. It was hence adequate for the whole energy interval for most metals. Though the measurement of the screening for strontium became difficult and was hardly possible for lithium which are both very reactive metals the later more than the first. The larger width of the equilibrium for pumping oil is caused by the higher physisorption energy of the pumping oil because of the greater molecular mass. Recalling that the van-der-Waals interaction of the alcanes grows with every CH2,3-group one can adopt that the physisorption energy of the pumping oil is times greater than that of decane since decane has carbon atoms and the pumping oil at least . The hollow in the Lennard-Jones potential is accordingly deeper and wider. The probability for desorption per second can be expressed as [26]
| (11) |
Thus, it becomes immediately clear that the desorption probability of decane is times higher than that of the pumping oil for any temperature. Furthermore, the change of the desorption probability is considerably higher for decane than for the pumping oil in the temperature interval where desorption is still small enough in order to enable the surface reaction. This contemplation concerns the dependency of the surface temperature but is analogically applicable to straight beam induced desorption. In such way the differences to the first campaign and its results are explained.
Since the equilibrium of decane is so narrow we abbreviated the total time of irradiation of the measurements in order to obviate a drift off with subsequent layer formation. This means also that the targets are not implanted up to the stoichiometric ratios; so the depth distribution of the density may not be homogeneous over the range of the ions.
4.3 Modelling of layer effects
In the case of an oxidation or carbon layer the presupposition that the depth distribution of the deuterons in the target is homogeneous within the maximum ion range is so no longer valid. This has consequences for the analysis of the experimental results. Due to the alternating deuteron density at the target surface the underlieing model for the data analysis needs to be modified which means particularly that the single fitting parameter is not enough any more in order to describe as obtained from the experiment by (6.AB7).
|
|
Fig. 9 illustrates the modified model. The target is made up of three layers. A surface layer consisting of either metal oxide or carbon, a layer of metal hydride and the bulk of the metal. The model is based on the following premises: The deuteron density in the metal oxide and in the bulk of the metal is in comparison negligible and can be set to zero. The deuteron density in carbon can achieve high values but there is no screening, so . There are sharp borders between these three layers. The deuteron density changes correspondingly discontinuously. The later is not true for a real target, of course where there is a smooth transition. However, the large energy steps of the datapoints and a finite accuracy do not allow to resolve such a fine structure of the experimental yield function. Starting with the definition of (6.AB7) coming back to the definition of the reduced yield (6.AB5) a new expression for the theoretical yield function different from Eq. (6.D6) needs to be constructed. In Eq. (6.BC1) the deuteron density is now given by a piecewise defined function as in Fig. 9. The energy substitution is performed with the stopping power differential equation
| (12) |
It is now only piecewise continuous and defined on the domain with the belonging stopping power coefficients as in Fig. 9. If is set to the generic continuous initial value problem with the initial condition has a handy solution as a parabola in a vertex-like form
| (13) |
describing the changes of the projectile energy within a given layer. Correspondingly the yield integral can be splitted at the interval borders in three addends where the last addend vanishes since the deuteron density in the metal, i.e. the third domain , is zero:
| (14) | |||||
This can be inserted into the definitions of and
| (15) | |||||
| (16) |
In the last step (15) is expanded by . The energies and at the borders are calculated with the solution of the differential equation (13) in the current domain and the beam energy to start from.
| (17) | |||||
| (18) |
is the usual normalization energy of . The function distinguishes from only in the initial value and Eq. (17), (18) can be used correspondingly. The terms that contain the dependencies from the densities and stopping power coefficients in Eq. (16), (17), (18) are collected in the three parameters , , and . Therefore once again, the analysis is independent of the stopping power coefficients and the actual deuteron density. has the meaning of a weighting factor which describes the contribution to the yield of the surface layer in comparison to the metal hydride and is essentially determined by the ratio of the deuteron densities. For a metal oxide layer it is set to zero since . The ’s are energetic lengths. With the stopping power coefficients and the densities the thickness of the layers could be calculated from them. Practically only estimates can be inferred since the densities in the layers are unknown and can change. Therefore the model has now a quadrupel of four parameters:
| (19) |
The model already provides some interesting insights.
Fig. 10 shows some selected cuts out of the hyper area. The plot (A) exhibits the effect of a metal oxide layer. The raise of at the lower energies quickly flattens with increasing thickness of the layer and eventually reverses. This is exact the situation of the experimentally observed reduced yield discontinuities in opposite direction for oxidized targets. Setting to the value for tantalum where the former raise has already been completely vanished would correspondend to a thickness of only . Thinner metal oxide layers diminish the observed enhancement already considerably. A pure carbon layer would have the same effect. But carbon is readily implanted by the beam with deuterons to densities above . Therefore the densities in carbon are comparable to the metal hydrides. Therefore in (B) is set to 1. The behaviour of is similar to (A) except that it does not drop below 1 since . On the other hand if in a rather thick carbon layer, an enhancement could be artificially generated because of the higher deuteron density in the carbon layer in comparison to the metal. This is tested in (C), where additionally the screening energy in the metal is set to zero. As expected, raises indeed with increasing , though the shape is different to the screening case. The slope is less steep. This improves when the thickness of the carbon layer becomes smaller. An inhomogeneous depth distribution of the deuterons causes a considerable increase of towards low energies while the deuterated zone of the metal is becoming thinner (D). This additional rise can only be distinguished from screening by the simultaneously amplified drop at higher energies. That is why measurements at higher energies are still important. Recapitulating, a carbon layer and/or an inhomogeneous depth distribution of the deuteron density leads to an artificial increase of the enhancement which might be erroneously attributed to the screening effect if no care is taken.
It should be noted that the thickness parameters of the layers in Eq. (17) and Eq. (18) are not identical with the actual thickness of the layers but are the way length that has been traversed by the ions. It is, hence, longer because of multiple scattering. It is obvious that the difference is of minor influence if the range of the ions is high in comparison to the thickness. If, however, they are comparable the difference will be significant. Such has been investigated quantitatively by a Monte-Carlo simulation of the multiple scattering and stopping processes with a code adapted from Ref. [36]. For the example of a carbon layer it turned out that for a thickness of there is no significant difference. Whereas for the difference is already a couple of k eV . For Eq. (17) underestimates the stopping by albeit such a thick layer levels all signs of the screening effect. Therefore this is not relevant for surface layers. On the other hand the thickness of the metal hydride zone is comparable to the range of the ions. But because the junction between the metal hydride zone and the undeuterated metal is not discrete in any case this is not relevant either.
4.3.1 Extreme low energy correction
For very low beam energies the simple picture of the screening effect which attributes the screening energy to the kinetic energy of the projectile as in Ref. [1] does not hold any more. The S-factor parameterization of the cross-section can be written as
where the term on the right side has been splitted in a factor including the wavelength dependency (4.3.1.a) and the factor belonging to Coulomb barrier penetration (4.3.1.b). Only to the latter one the screening energy should be added [37]. If this correction was to be applied to the data analysis, Eq. (6.D3) would need to be changed likewise.
5 Results
The ensured results for the lower limits of the campaign I are listed in Table 1. The corresponding plot for Tantalum resides in Fig. 11 (right, bottom), for the other metals refer to Ref. [5, 6]. In the second column of the table the ratios of the deuterium number density to that of the host metals are shown. Since the deuteron density can and does vary during a measurement these values are estimated averages. The fourth column contains the screening energy values obtained from the extreme low energy correction from subsection 4.3.1 with Eq. (4.3.1) via Eq. (6.D3). In general this correction causes a slight reduction of the deduced screening energy. The calculation has been performed with a different algorithm and illustrates to some extent the influence of the algorithmic error which is a common part of the error hierarchy in numerical mathematics. Anyway the correction affects the result only at beam energies far below the current limit.
| Metal | MDx | in eV | in eV |
|---|---|---|---|
| Ta | 0.9 | 322 15 | 300 13 |
| Zr | 2.1 | 297 8 | 295 6 |
| Al | 0.8 | 190 15 | 191 12 |
The campaign II needed to focus on the investigation of the surface effects. Fig. 11 shows the consequences on the thick target enhancement factor for Ta for a deliberate variation of the decane infusion as an experimental counterpart to Fig. 10 in the measurements Ta-[A-E].
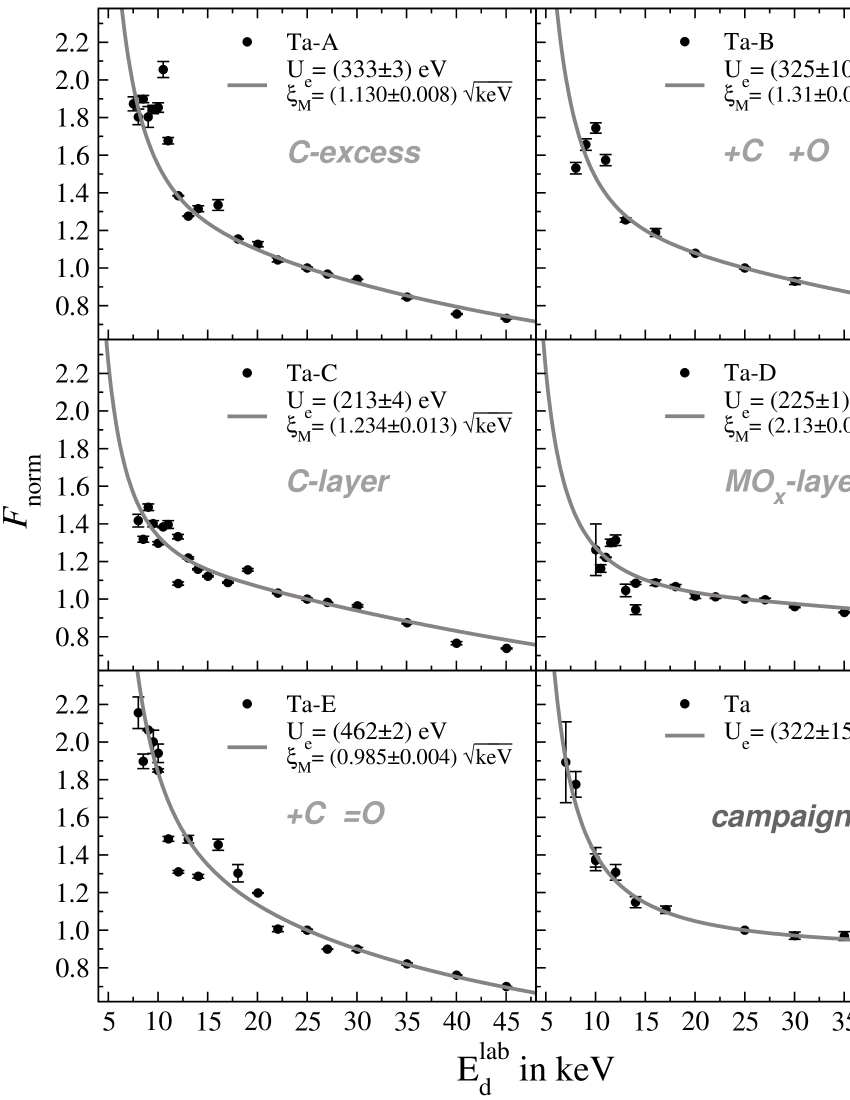
The plot for Ta from the campaign I is for comparison. Because of the reasons stated in subsection 4.2 the total charge being implanted needed to be limited. Hence, the deuterium density did not reach saturation. This has two consequences that can be seen in the plots: First, a certain scattering of the datapoints at the low energies which comes from small alterations in the ion trajectories accompanying the adaption of the focus to the beam energy. Then the beam spot shifts slightly and hits an area on the target with a different deuteron density. Second, the depth distribution is not homogeneous any longer. This leads to a drop of at the higher energies and a superelevation to the low energies like in Fig. 10.D. The variation of the decane pressure was kept in the vicinity of the equilibrium and caused changes in the composition of the target surfaces which were verified with EDX-Analyses. Owing to the narrowness of the equilibrium, the targets showed signs of beginning layer formation at least. The picture of an area inside the beam spot of a Ta target in Fig. 8 exhibits distinct zones of different brightness, i.e. emissivity for secondary electrons. The darker zones have a greater carbon content than the brighter ones. With increasing overall carbon load on the surface, the zones become darker and eventually vanish. This phenomenon is known from ion beam assisted surface technology specifically for thin film deposition [34]. There are basically three modes for the growth of thin films: Island growth, layer growth and the mixed case. Which of them predominates depends on the affinity of the film material to the substrate. The ion beam cares for the mobility of the adatoms at the surface e.g. by phonon excitation. If the bond of the adatoms among themselves is stronger than to the substrate atoms the adatoms move on the surface, join and form islands; island growth will prevail. The islands will eventually grow together and form a closed layer. The mutual bond of the carbon adatoms is stronger than that to the atoms of the quasi noble metal tantalum entirely in antagonism to oxygen. Therefore island growth is favoured. This also implies that the mobility of the carbon atoms is high enough for it which also means that the surface is sufficiently smooth and not destroyed by embrittlement.
The curves in Fig. 11 are from fits with the 4-parameter model of Sec. 4.3 where the two parameters for the surface layer were held fixed at zero. Since the -minimization problem is now nonlinear it is not guaranteed that the iteration finds a global minimum and not only local ones or even gets into an indefinite area, e.g. with a weak minimum. In Table 2 are some fit trials for different choices of parameters with reasonable starting values.
| No. | [eV] | [] | [] | |||||||
|---|---|---|---|---|---|---|---|---|---|---|
| Ta-A | 1 | |||||||||
| 2 | ||||||||||
| 3 | ||||||||||
| 4 | ||||||||||
| 5 | ||||||||||
| Ta-C | 6 | |||||||||
| 7 | ||||||||||
| Ta-D | 8 | |||||||||
| 9 | ||||||||||
| 10 | ||||||||||
| Ta-E | 11 | |||||||||
| 12 |
The fits were performed with the Levenberg-Marquardt algorithm utilizing numerical integration and differentiation procedures for the computation of the model function and its gradient. The gray printed numbers are prescribed to the fitting program and held fixed during runtime. Line 1 is the 2-parameter fit of Fig. 11. The plot of Ta-A is magnified in Fig. 12 together with curves for other fit attempts of Table 2.
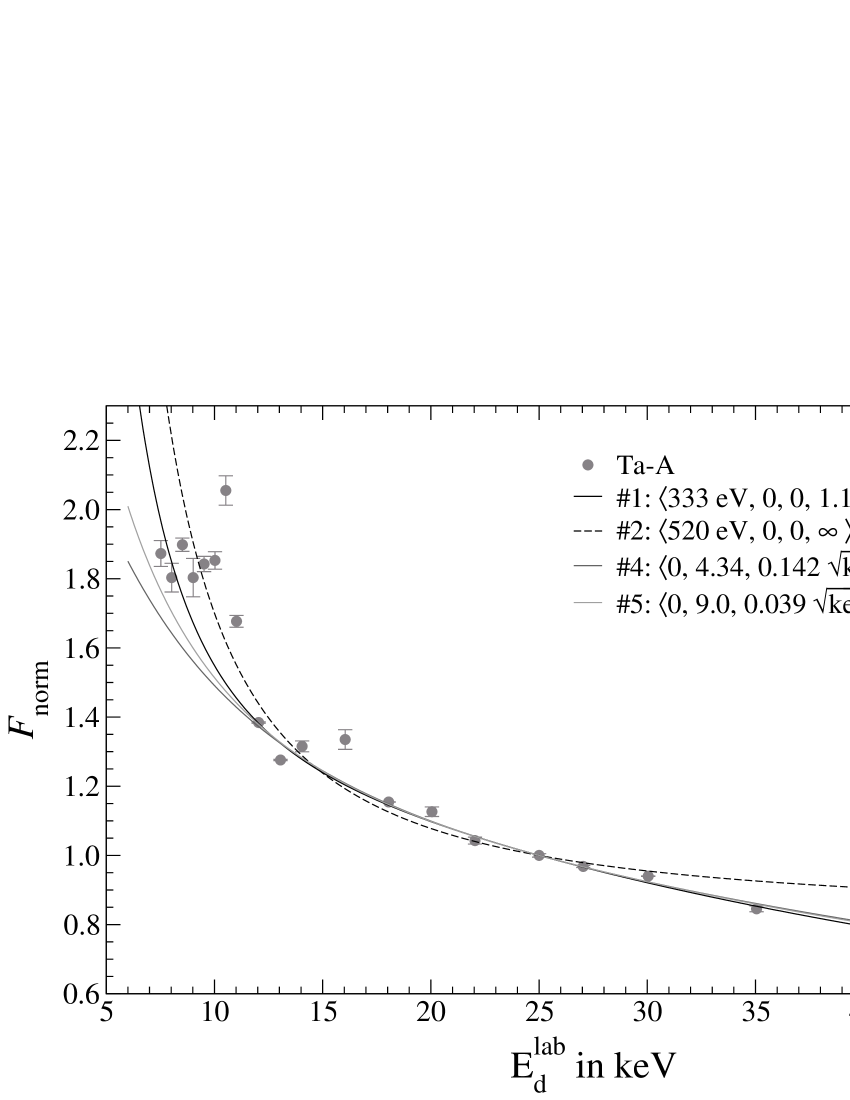
The dashed curve in the figure is the 1-parameter fit #2 merely for just like for the campaign I. The curve shows a clearly increasing deviation from the progression of the datapoints at the high energies above . While attempting this the curve needed to be raised at the low energies, which resulted in an inflated screening energy of . Such behaviour is in accord with Fig. 10.D. A fit with all 4 parameters is #3 (see line 3 in Table 2). The belonging covariance matrix has large off diagonal elements hence the parameters are strongly correlated. The large errors of the fit parameters are another indication. The surface layer parameters and equals to zero within their errors. This does not mean that there is no surface layer but only that its effect is below the resolution of the datapoints. In analogy to Fig. 10.C it should be tested whether it is possible to describe the datapoints by the layer parameters alone, i.e. the screening energy is fixed to zero. This is done in #4 where the result is from a first execution of the fitting procedure which got into an indefinite area of weak convergence. The values after repetitive iterations without reaching a minimum are in #5. However, a tendency becomes clear: becomes still greater on the expense of which is reduced at the same time. Those values for the parameters – particularly – are physically not realistic. The associated curves can not follow the slope at the low energies. Ta-C has a thick carbon layer. Therefore the enhancement factors are considerably reduced like in Fig. 10.B as well as the screening energy from the 2-parameter fit #6 (line 6 in Table 2). A 3-parameter fit with set to 1 complying to a carbon layer yields the values in #7 now with a screening energy in agreement to the previous results. Admittedly, it belongs to a weak minimum. By far the most total charge was implanted at Ta-D under conditions where the formation of a metal oxide layer is favoured. Accordingly, the thickness of the deuterated zone is considerably larger and the screening is inhibited by the layer (#8). Suitably the 1-parameter fit #9 has a similar result since the high energy datapoints have no significant drop, too. This time the 3-parameter fit #10 found a local minimum with a surface thickness of which is sufficient to halve the enhancement factors (Fig. 10.A) and corresponds to a thickness of about on tantalum, although the three parameters have a clear correlation as the errors indicate. The found screening energy agrees with the larger value of Ta-E #11. It has a lower carbon load than Ta-A and the measured enhancement factors are higher. The 1-parameter fit #12 yields an even more unrealistic value than #2. Because of the necessarily insufficient implantation the 2-parameter fit is best suited since the scattering of the datapoints seldom allows for a fit with more free parameters and then only limited validity.
6 Discussion
Several possible (mostly minor) error sources have been already discussed in Ref. [5, 38] and won’t be repeated here. Instead, the discussion concentrates on the dominating error source that is the inhomogeneous deuteron density distribution in the targets. We concluded that our previous values for the screening energies represent lower limits of the real ones. As pointed out in section 2 the actual energy of the projectiles is somewhat lower than measured at the voltage divider because of a voltage drop inside HF ion sources. Therefore the observed screening energy is also lowered by this property.
A possible question is whether the low energy expression for the stopping power function is valid for the metal hydrides or if there is a significant energy dependence of the superscript or for that matter of the stopping power coefficients. In this case part of the enhancement could be caused by this conceivable effect. Albeit the Lindhard theory has been experimentally validated down to [39] measurements at He and Ne gas showed a deviation at low energies [40, 41]. This is due to the high excitation energies of both noble gases [42, 43]. In solids the velocity proportionality is fully confirmed for metals as well as for insulators with wide band gaps like LiF, Al2O3 and SiO2 [44, 45, 46].
According to the basic theoretical definition of the yield (6.BC1), deviations in the observed yield and correspondingly in the reduced yield have the two principal causes: changes in the deuteron density(-profile) and modification of the cross-section probably by the screening effect merged in the integrant product . As already pointed out in section 3.2 and showed in Fig. 4, our analysis method allows us to discern between these two causes. Only the direct reduced yield discontinuity at the change of the beam energy is interpreted as a modification of the cross-section. The differential method enables the recognition and rejection of measurements by observation of the progression of which could easily be misinterpreted as screening if merely the total yields over an entire measurement are compared. Some representative examples for such cases are collected in Fig. 13 and elucidate it.
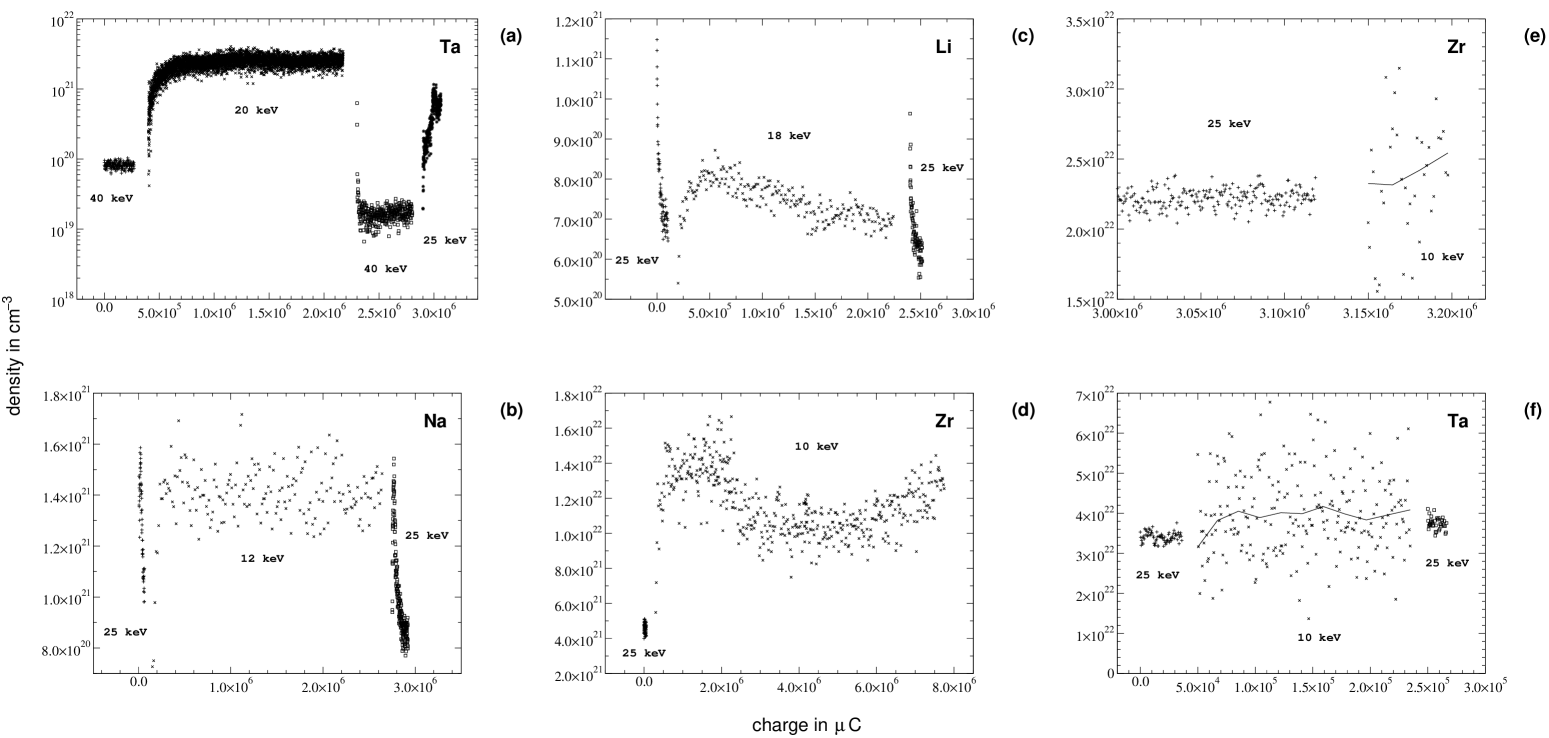
The quantity on the vertical axis is herein the density as computed with Eq. (10) since it is more illustrative.
Subfig. 13.a demonstrates consequences of a perceptible heating of the target. Since the beam energy is deposited inside the target in a volume with a thickness the thermal energy needs to be led away otherwise this zone will be considerably heated. The far most effective heat transport mechanism in solids is heat conduction by the free electrons inside metals. Hence, we used thick targets () where the thermal energy can be dissipated into the bulk of the material and so the temperature is kept low. The target holders are equipped with channels for coolant flow. However, the comparatively very high thermal resistance of the joint between the holder and the mounted target allows only for a small effect, at best. Therefore for our usual beam currents of some the density remained essentially constant at the change of the beam energy. Only long term changes were observed as described in Sec. 4.2. The effects of heating were investigated using a thin Ta-foil () and higher currents where the energy dissipation is entirely insufficient and hence the target heated. Then the ’saturation’ densities are heavily dependent on the beam energy and current and much lower than the stoichiometric ratio. Albeit, for the same conditions, i.e. beam energy, current, target thickness and volume, the density returns to the same ’saturation’ level. Now Subfig. 13.a displays the development of the density during the progression of the different measurements. When switching from to the density starts with a reverse discontinuity and rapidly increases within and remains then constant. Switching back to the density decreases more rapidly and levels off. Going to once again the initial rapid increase can be observed reaching a first plateau and then a second after reduction of the current. Most metals form a chemical bond with the hydrogen whose strength depends on the relative affinity. Therein the hydrogen will accumulate in the volume of the beam retardation until all bonds are saturated in vicinity of the stoichiometric ratio and then migrate into adjacent crystallites filling them up etc. If, however, the temperature is too high in order to enable the formation of the chemical bond the stopped hydrogen will diffuse through the whole material promoted by the high temperature and may even be able to return to the gas phase. The then attuning ’saturation’ density is a labile equilibrium state highly dependent on the surrounding conditions. The area of our target holders and materials was large enough to accommodate 4 beam spots. Changes between the beam positions were done by a vertical shift of the target holder (Fig. 1). Going to another spot position the initial implantation curve starts at zero like in Fig. 6 but not so at the Ta-foil. There the density already starts at a value close to the previous spot sustaining the explanation. On the foil were folds around the beam spots indicating the thermal stress that the foil suffered. The fundamental reason for the described density dynamics at low absolute density values is the enlarged mobility of the deuterons inside the metal. It is here in the case of tantalum caused by heating but will occur whenever the thermal energy of the deuterons is higher than their chemical binding energy to the metal so that they can float free. For metals with low ability to bind hydrogen, e.g. the transition metals in the groups 6A-8A and 1B, this is already fulfilled at room temperature. A test with a thin Au foil showed a behaviour like for the Ta foil without the screening enhancement discontinuities at a very low density of (). Besides indirect heating, the mobility of the deuterons in target materials with low binding ability for deuterons is also promoted by direct projectile scattering and phonon generation depending on the beam energy.
Due to the inability of metal oxides to form a chemical bond to the hydrogen (Sec. 4.1) the same as above applies to them and is additionally aggravated by the fact that the metal oxides are not only electrical but also thermal insulators so (beam)-heating is more effectual. Subfig. 13.b illustrates the development of the densities in a Na target with a thick oxide layer. Before the monitor measurement at a measurement at a low energy had been taken. The density quickly decreased then at . Thereafter a measurement at was started. The density very quickly increased reaching a higher level than at . But the discontinuity at the beginning was in the wrong direction. The density for the sequencing monitor measurement started once again at a high density which quickly decreased. The discontinuity at the beginning was once again in the wrong direction. Therefore there is definitely no screening. The discontinuities result in an enhancement factor conforming with Fig. 10.A. The quick shifts in the densities after the change of the beam energy going to a ’saturation’ level originate from a shift of the deuteron distribution depth profile in the metal oxide linked to the different ranges of the ions.
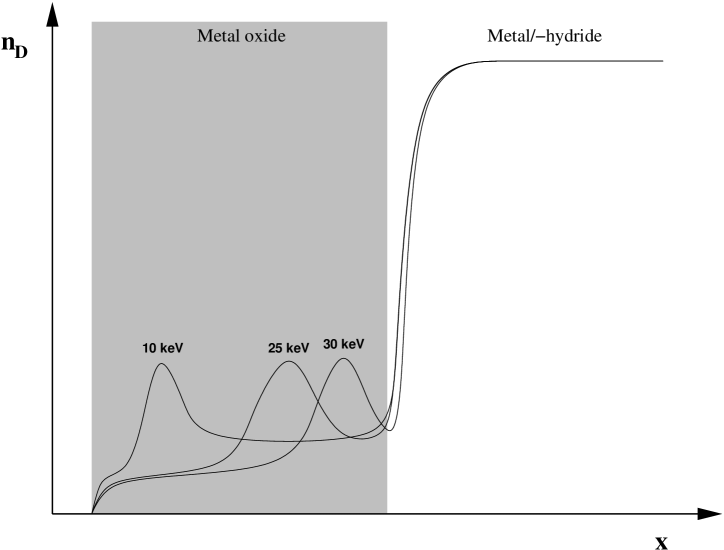
This is schematically sketched in Fig. 14. Since hydrogen is only segregated in metal oxides the density is at least one order of magnitude less than in the metal hydride below. Inside the metal oxide the density is maximal around the range of the ions and the deuterons migrate from there. Between the surface and the range the density is very low since the linear energy transfer of the beam ions exceeds the low segregation energy by far. Therefore only a labile diffusion equilibrium can attune. Beyond the range the density is higher than before because the binding in segregation is sooner effective. Beginning at a longer irradiation at and then changing to the maximum of the density profile of is within the ion trajectory at . At first the homogeneous average density calculated with Eq. (10) appears accordingly distinctly higher since the ions possess a higher energy for augmented reactions at this position. Concurrently the density maximum is dismantled by the energy transfer and metamorphosed into the profile of while the average density is decreasing. Is then a measurement at performed the density within the deuteron range is very low but is swiftly augmented by the stopped ions. Therefore the calculated average density is increasing. After such a measurement had been carried out long enough the density beyond the range is enlarged by segregation and a sequencing measurement at a higher energy yields again a strongly enhanced average density which is quickly decreasing. The same interplay can be observed in the case of Li in Subfig. 13.c with a lower energy difference.
With decreasing energy difference between consecutive measurements the differences in the density profiles become smaller but remain still significant. Subfig. 13.d for Zr with a thick oxide layer is in direct contradistinction to fig. 4. The calculated average densities are less than in comparison to Fig. 4 and the characteristical quick increase at the beginning of the measurement is visible with no screening discontinuity. Here should be emphasized the importance of the beam adjustment procedure with the deflector offside the target as described in Sec. 2 for the observation of the quick changes at the beginning of the measurements. In Subfig. 13.e the oxide layer is thinner and the density not so much abated. Hence, there is no such quick increase at . The line is calculated with a larger step size thus smoothing the progression. The deuteron density for Ta in Subfig. 13.f is at the stoichiometric ratio but there is no discontinuity and no quick change when switching the energy. It complies to a layer with a thickness of in Fig. 10.A where the normalized enhancement factor equals zero and which corresponds to a low thickness of Ta. Measurements which yielded results like they are represented in Fig. 13 were altogether discarded since the changes in the yield are only from the density dynamics and not from screening. Summarizing, it is preferable to use thick target disks at moderate temperatures with high densities. On the other side, cooling a target to very deep temperatures would transform it into a cryogenic trap accumulating water in thick layers on its surface prior to irradiation promoting the oxidation. Paying attention to all the above discussed experimental problems we can state that our results represent lower limits to the real screening energy values. For further details refer to Ref. [6].
7 Conclusion
We alluded to experimental anomalies and pitfalls of the d+d reactions in metals which distinguish them from common nuclear reaction measurements and make them particularly difficult and error-prone. With respect to these special conjectures we developed a differential data analysis method which gains the maximum information from the raw data. It enables the on-line monitoring of the deuteron densities and the observation of short time deuteron density profile changes. Only the discontinuities of the reduced reaction yields at the change of the beam energies can be attributed to the screening effect and not relative changes in the total yield of the elapsed measurements. The method is independent of the unprecise stopping power coefficients and the actual absolute value of the deuteron number density in the targets. Since the measurements are taken at deuteron densities in the vicinity of the stoichiometric ratio the yields cannot be sophisticated by density dynamics. The measurements are further impaired by layer formation under the beam irradiation supplied by the residual gas in the high vacuum system used in nuclear physics. Dedicated experiments demonstrated how the composition of the residual gas influences the layer formation and the measurements whereby the chemical active fractions are water and carbon hydrides. These processes depend on many difficult to control parameters. The experiments on tantalum showed the effects on the results for the inferred screening energy utilizing the model for the layer effects. In consequence our results for the screening energies represent lower limits. The results from the tantalum experiments range from giving an imagination of the error in comparison to the lower limit of . The layer model shows that a few ten atomic layers of different composition are enough in order to obliterate the screening effect. Thicker metal oxide layers lead to low and instable densities. The applied techniques allow for the recognition and rejection of measurements with unwanted shifts in the density depth distribution profile thus preventing the erroneous extraction of an artificial screening enhancement in contrast to the standard analysis based on the total yield measurement used by Ref. [8, 9, 11, 12, 13, 47, 48]666Such will be discussed and substantiated in a forthcoming publication. . Those undesirable density profile changes occur in targets with low hydrogen binding ability, like many of the transition metals, at elevated temperatures and heterogeneous targets with metal oxide or carbon layers or different (relatively) thin metal layers. Therefore aside from the sustained fact that there is a great screening enhancement so far no further assertion can be made about possible causes based on other known material properties because of the interference with the chemical surface reactions. For a precise determination of the screening energies ultra high vacuum systems with pressures well below , where only hydrogen and noble gases are in the residual gas, and equipped with in-situ target diagnosis techniques are mandatory.
References
- [1] H. J. Assenbaum, K. Langanke, C. Rolfs, Z. Phys. A (327) (1987) 461–468.
- [2] E. E. Salpeter, Aust. J. Phys. 7 (1954) 373.
- [3] S. Ichimaru, Rev. Mod. Phys. 65 (1993) 252.
- [4] K. Czerski, A. Huke, P. Heide, M. Hoeft, G. Ruprecht, in: N. Prantzos, S. Harissopulos (Eds.), Nuclei in the Cosmos V, Proceedings of the International Symposium on Nuclear Astrophysics, Editions Frontières, Volos, Greece, 1998, p. 152.
- [5] K. Czerski, A. Huke, A. Biller, P. Heide, M. Hoeft, G. Ruprecht, Europhys. Lett. 54 (4) (2001) 449–455.
-
[6]
A. Huke, Die Deuteronen-Fusionsreaktionen in Metallen, Ph.D. thesis,
Technische Universität Berlin (2002).
URL http://edocs.tu-berlin.de/diss/2002/huke_armin.htm - [7] U. Greife, F. Gorris, M. Junker, C. Rolfs, D. Zahnow, Z. Phys. A (351) (1995) 107–112.
- [8] H. Yuki, J. Kasagi, A. G. Lipson, T. Ohtsuki, T. Baba, T. Noda, B. F. Lyakhov, N. Asami, JETP Lett. 68 (11) (1998) 823.
- [9] J. Kasagi, H. Yuki, T. Baba, T. Noda, T. Ohtsuki, A. G. Lipson, J. Phys. Soc. Jpn. 71 (2002) 2281.
- [10] F. Raiola, et al., Eur. Phys. J. A 13 (2002) 377.
- [11] F. Raiola, et al., Phys. Lett. B 547 (2002) 193.
- [12] C. Bonomo, et al., Nucl. Phys. A 719 (2003) 37c.
- [13] F. Raiola, et al., Eur. Phys. J. A 19 (2004) 283.
- [14] K. Czerski, A. Huke, P. Heide, G. Ruprecht, Europhys. Lett. 68 (3) (2004) 363–369.
- [15] C. E. Rolfs, W. S. Rodney, Cauldrons in the Cosmos, Theoretical Astrophysics, The University of Chicago Press, Chicago and London, 1988.
- [16] K. Czerski, A. Huke, P. Heide, G. Ruprecht, Eur. Phys. J. A 27 (S1) (2006) 83–88.
- [17] D. Kamke, Handbuch der Physik, Vol. XXXIII, Springer Verlag, Berlin, 1956, Ch. 1. Elektronen- und Ionenquelle.
- [18] R. E. Brown, N. Jarmie, Phys. Rev. C 41 (4) (1990) 1391.
- [19] W. M. Mueller, J. P. Blackledge, G. G. Libowitz (Eds.), Metal Hydrides, Academic Press, New York, London, 1968.
- [20] J. Lindhard, Mat. Fys. Medd. Dan. Vid. Selsk. 28 (8).
- [21] J. Lindhard, M. Scharff, Phys. Rev. (124) (1961) 128.
- [22] J. Lindhard, M. Scharff, H. E. Schiøtt, Mat. Fys. Medd. Dan. Vid. Selsk. 33 (14).
- [23] H. Anderson, J. F. Ziegler, The Stopping and Ranges of Ions in Matter, Vol. 3, Pergamon Press, New York, 1977.
- [24] R. Bragg, Phil. Mag. (10) (1905) 318.
- [25] M. Abramowitz, I. A. Stegun, Handbook of Mathematical Functions, 9th Edition, Dover Publications, Inc., New York, 1970.
- [26] M. Henzler, W. Göpel, Oberflächenphysik des Festkörpers, B. G. Teubner, Stuttgart, 1991.
- [27] A. Zangwill, Physics at surfaces, Cambridge University Press, Cambridge, 1988.
- [28] Y. J. Chabal, S. B. Christmann, Phys. Rev. B (29) (1984) 6974.
- [29] M. Scheffler, A. M. Bradshaw, The electronic structure of adsorbed layers, in: D. A. King, D. P. Woodruff (Eds.), Adsorption on Solid Surfaces, Vol. 2 of The Chemical Physics of Solid Surfaces and Heterogeneous Catalysis, Elsevier, Amsterdam, 1984.
- [30] W. T. Hering, Angewandte Kernphysik, B. G. Teubner, Stuttgart, Leipzig, 1999.
- [31] J. F. O’Hanlon, A User’s Guide to Vacuum Technology, John Wiley & Sons, New York, 1980.
- [32] A. Cornu, R. Massot, Compilation of Mass Spectral Data, Heyden and Son Limited, London, 1966.
- [33] Leybold-Heraeus GmbH, Köln, Quadruvac Q 100 (1983).
- [34] W. Ensinger, Nucl. Instr. Meth. B (127/128) (1997) 796.
- [35] R. L. Beck, W. M. Mueller, Zirconium hydrides and hafnium hydrides, in: Mueller et al. [19], Ch. 7.
- [36] A. Biller, Einfluß der Vielfachstreuung auf Dicktarget-Yields in niederenergetischen Kernreaktionen, Diplomarbeit, Institut für Atomare und Analytische Physik der Technischen Universität Berlin (1998).
- [37] K. Czerski, A. Huke, P. Heide, Nucl. Phys. A 719 (2002) 52c.
- [38] K. Czerski, A. Huke, P. Heide, G. Schiwietz, Nucl. Instr. Meth. B 193 (2002) 183.
- [39] H. Paul, D. Semrad, A. Seilinger, Nucl. Instrum. Meth. B 61 (1991) 261.
- [40] R. Golser, D. Semrad, Phys. Rev. Lett. 66 (1991) 1831.
- [41] A. Schiefermüller, R. Golser, R. Stohl, D. Semrad, Phys. Rev. A 48 (1993) 4467.
- [42] P. L. Grande, G. Schiwietz, Phys. Rev. A 47 (1993) 1119.
- [43] D. Semrad, Phys. Rev. A 33 (1986) 1646.
- [44] K. Eder, D. Semrad, P. Bauer, R. Golser, P. Maier-Komor, F. Aumayr, M. Peñalba, A. Arnau, J. M. Ugalde, P. M. Echenique, Phys. Rev. Lett. 79 (1997) 4112.
- [45] S. P. Møller, A. Csete, T. Ichioka, H. Knudsen, U. I. Uggerhøj, H. H. Andersen, Phys. Rev. Lett. 88 (2002) 193201.
- [46] S. P. Møller, A. Csete, T. Ichioka, H. Knudsen, U. I. Uggerhøj, H. H. Andersen, Phys. Rev. Lett. 93 (2004) 042502.
- [47] F. Raiola, et al., J. Phys. G 31 (2005) 1141.
- [48] F. Raiola, et al., Eur. Phys. J. A 27 (S1) (2006) 79.