Yields and elliptic flow of and in Au+Au collisions at
Abstract
We present the transverse momentum spectra at mid-rapidity for , () and , () measured by the STAR experiment at RHIC and extract the coalescence parameters and (respectively). We also present the measurement for and . We find that the and follows the atomic mass number A scaling within errors and a negative has been observed for at low .
1 Introduction
In relativistic heavy ion collisions, light nuclei and their particles can be formed from created nucleons and anti-nucleons or stopped nucleons [1]. Since the binding energy is small, this formation process can only happen at the late stage of the evolution when interactions between nucleons and other particles are weak. This process is called final-state coalescence [2] [3]. Therefore, the production of light nuclei provides a tool to measure freeze-out properties, such as particle density [4], correlation volume and collective motion. Invariant nucleus yield can be related [2] to the primordial yields of nucleons by Equation 1.
| (1) |
where is the coalescence parameter. is the invariant yield of nucleons or nuclei. A and Z are the atomic mass number and atomic number, respectively. and are the momenta of nucleus and proton where . is related to the freeze-out correlation volume [2]: .
2 Experiment and analysis
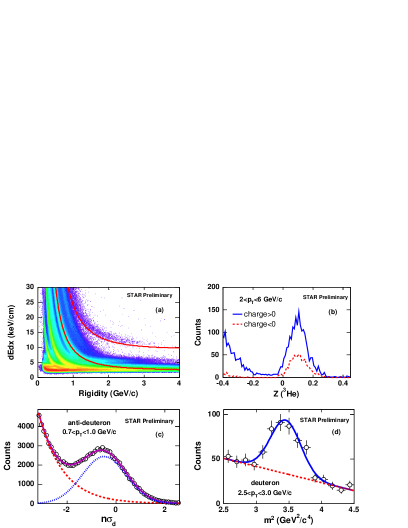
The data presented here are obtained from the Time Projection Chamber (TPC) and the Time-Of-Flight (TOF) detectors in the STAR experiment [5] at RHIC in the year 2004. A data sample of 25 million (16 million for TOF) central triggered events and 24 million (15 million for TOF) minimum-bias triggered events is used for this analysis. Figure 1 presents the particle identification techniques and methods. Figure 1 (a) shows the ionization energy loss () of charged tracks as a function of rigidity () measured by the TPC at . Figure 1 (b) shows () distribution for and signals. After tight track quality selections, the signals are essentially background free. We use counting method to derive the yields. Figure 1 (c) shows (extracted from ) distribution for at . The signal was fit with a Gaussian function and an exponential background. Figure 1 (d) shows distribution for at measured by TOF after the selections. The signal was fit with a Gaussian function and a linear background. The acceptance and tracking efficiencies were studied by Monto Carlo GEANT simulations [6]. The results presented are corrected for these effects. Elliptic flow parameter was calculated by the event plane method.
3 Results
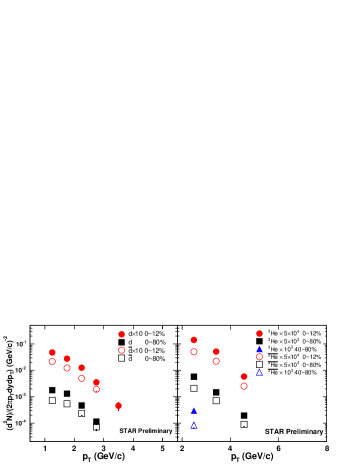
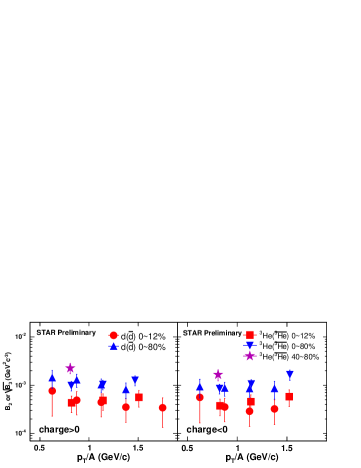
Figure 2 shows the spectra and the extracted coalescence parameters and for and . Here the proton and anti-proton spectra are taken from Ref. [7]. The spectra have been corrected for feed-down from ) and weak decays [7]. for is consistent with for , which indicates that the correlation volumes for and are similar. Both and show strong centrality dependence. In more central collisions, a smaller coalescence parameter indicates that the correlation volume at thermal freeze-out is larger and the probability of formation of light nuclei is less.
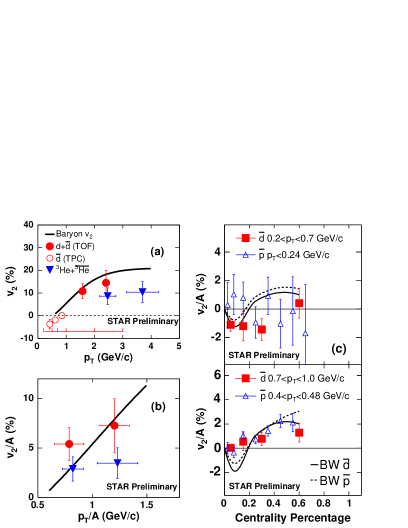
Figure 3 (a) shows as a function of for , and in minimum-bias collisions. The results with both and scaled by A are shown in Figure 3 (b). For comparison, the baryon [8] is also shown as the solid line. and baryon seems to follow the A scaling within errors, indicating that the are formed through the coalescence of and just before the thermal freeze-out. The scaled appears to deviate from the the baryon . Further conclusions are limited by poor statistics, so clearly more data are needed. The as a function of centrality fraction is shown in Figure 3 (c). The two panels represent results for two different regions of . has a negative in central and mid-central collisions in the transverse momentum range of . This negative is consistent with a large radial flow, as the blast-wave predictions show. At the same where the is negative, the is consistent both with zero and with the , due to large uncertainties. Though the blast-wave model predicts the generic feature of negative , quantitative agreement between data and model throughout the entire centrality and range is lacking.
4 Summary
Taking advantage of the combining STAR TPC and TOF detectors capabilities, we have measured the and transverse momentum spectra and elliptic flow. The value of the coalescence parameters and , extracted from the spectral measurements, are found to be consistent. Systematic studies of and have shown decreasing trends as function of collision centrality, consistent with an increasing source size from peripheral to central collisions. Comparative analysis of the elliptic flow measurements show that and scales with atomic mass number A, which is expected natural consequence of final-state coalescence. The negative values observed at low are consistent with a large radial flow in the soft sector.
References
References
- [1] J.L. Nagel et al., Phys. Rev. C53 (1996) 367; A.Z. Mekjian, Phys. Rev. C17 (1978) 1051;
- [2] S.T. Butler and C.A. Pearson, Phys. Rev. 129 (1963) 836.
- [3] A. Schwarzschild and C. Zupancic, Phys. Rev. 129, 854 (1963); H.H. Gutbrod et al., Phys. Rev. Lett. 37 (1976) 667.
- [4] H. Liu and Z. Xu, nucl-ex/0610035.
- [5] K.H. Ackerman et al., Nucl. Instr. Meth. A 499, 624 (2003).
- [6] J. Adams et al., Phys. Rev. Lett. 91 (2003) 262302.
- [7] B.I. Abelev et al., Phys. Rev. Lett. 97 (2006) 152301.
- [8] X. Dong et al., Phys. Lett. B597 (2004) 328.
- [9] J. Adams et al., Phys. Rev. C72 (2005) 014904.
- [10] F. Retiere and M. Lisa, Phys. Rev. C70 (2004) 044907.