Mass, quark-number, and dependence of the
second and fourth flow harmonics in ultra-relativistic
nucleus-nucleus collisions
B.I. Abelev
Yale University, New Haven, Connecticut 06520
M.M. Aggarwal
Panjab University, Chandigarh 160014, India
Z. Ahammed
Variable Energy Cyclotron Centre, Kolkata 700064, India
B.D. Anderson
Kent State University, Kent, Ohio 44242
D. Arkhipkin
Particle Physics Laboratory (JINR), Dubna, Russia
G.S. Averichev
Laboratory for High Energy (JINR), Dubna, Russia
Y. Bai
NIKHEF and Utrecht University, Amsterdam, The Netherlands
J. Balewski
Indiana University, Bloomington, Indiana 47408
O. Barannikova
University of Illinois, Chicago
L.S. Barnby
University of Birmingham, Birmingham, United Kingdom
J. Baudot
Institut de Recherches Subatomiques, Strasbourg, France
S. Baumgart
Yale University, New Haven, Connecticut 06520
S. Bekele
Ohio State University, Columbus, Ohio 43210
V.V. Belaga
Laboratory for High Energy (JINR), Dubna, Russia
A. Bellingeri-Laurikainen
SUBATECH, Nantes, France
R. Bellwied
Wayne State University, Detroit, Michigan 48201
F. Benedosso
NIKHEF and Utrecht University, Amsterdam, The Netherlands
R.R. Betts
University of Illinois, Chicago
S. Bhardwaj
University of Rajasthan, Jaipur 302004, India
A. Bhasin
University of Jammu, Jammu 180001, India
A.K. Bhati
Panjab University, Chandigarh 160014, India
H. Bichsel
University of Washington, Seattle, Washington 98195
J. Bielcik
Yale University, New Haven, Connecticut 06520
J. Bielcikova
Yale University, New Haven, Connecticut 06520
L.C. Bland
Brookhaven National Laboratory, Upton, New York 11973
S-L. Blyth
Lawrence Berkeley National Laboratory, Berkeley, California 94720
M. Bombara
University of Birmingham, Birmingham, United Kingdom
B.E. Bonner
Rice University, Houston, Texas 77251
M. Botje
NIKHEF and Utrecht University, Amsterdam, The Netherlands
J. Bouchet
SUBATECH, Nantes, France
A.V. Brandin
Moscow Engineering Physics Institute, Moscow Russia
A. Bravar
Brookhaven National Laboratory, Upton, New York 11973
T.P. Burton
University of Birmingham, Birmingham, United Kingdom
M. Bystersky
Nuclear Physics Institute AS CR, 250 68 Řež/Prague, Czech Republic
R.V. Cadman
Argonne National Laboratory, Argonne, Illinois 60439
X.Z. Cai
Shanghai Institute of Applied Physics, Shanghai 201800, China
H. Caines
Yale University, New Haven, Connecticut 06520
M. Calderón de la Barca Sánchez
University of California, Davis, California 95616
J. Callner
University of Illinois, Chicago
J. Castillo
NIKHEF and Utrecht University, Amsterdam, The Netherlands
O. Catu
Yale University, New Haven, Connecticut 06520
D. Cebra
University of California, Davis, California 95616
Z. Chajecki
Ohio State University, Columbus, Ohio 43210
P. Chaloupka
Nuclear Physics Institute AS CR, 250 68 Řež/Prague, Czech Republic
S. Chattopadhyay
Variable Energy Cyclotron Centre, Kolkata 700064, India
H.F. Chen
University of Science & Technology of China, Hefei 230026, China
J.H. Chen
Shanghai Institute of Applied Physics, Shanghai 201800, China
J. Cheng
Tsinghua University, Beijing 100084, China
M. Cherney
Creighton University, Omaha, Nebraska 68178
A. Chikanian
Yale University, New Haven, Connecticut 06520
W. Christie
Brookhaven National Laboratory, Upton, New York 11973
S.U. Chung
Brookhaven National Laboratory, Upton, New York 11973
J.P. Coffin
Institut de Recherches Subatomiques, Strasbourg, France
T.M. Cormier
Wayne State University, Detroit, Michigan 48201
M.R. Cosentino
Universidade de Sao Paulo, Sao Paulo, Brazil
J.G. Cramer
University of Washington, Seattle, Washington 98195
H.J. Crawford
University of California, Berkeley, California 94720
D. Das
Variable Energy Cyclotron Centre, Kolkata 700064, India
S. Das
Variable Energy Cyclotron Centre, Kolkata 700064, India
S. Dash
Institute of Physics, Bhubaneswar 751005, India
M. Daugherity
University of Texas, Austin, Texas 78712
M.M. de Moura
Universidade de Sao Paulo, Sao Paulo, Brazil
T.G. Dedovich
Laboratory for High Energy (JINR), Dubna, Russia
M. DePhillips
Brookhaven National Laboratory, Upton, New York 11973
A.A. Derevschikov
Institute of High Energy Physics, Protvino, Russia
L. Didenko
Brookhaven National Laboratory, Upton, New York 11973
T. Dietel
University of Frankfurt, Frankfurt, Germany
P. Djawotho
Indiana University, Bloomington, Indiana 47408
S.M. Dogra
University of Jammu, Jammu 180001, India
X. Dong
University of Science & Technology of China, Hefei 230026, China
J.L. Drachenberg
Texas A&M University, College Station, Texas 77843
J.E. Draper
University of California, Davis, California 95616
F. Du
Yale University, New Haven, Connecticut 06520
V.B. Dunin
Laboratory for High Energy (JINR), Dubna, Russia
J.C. Dunlop
Brookhaven National Laboratory, Upton, New York 11973
M.R. Dutta Mazumdar
Variable Energy Cyclotron Centre, Kolkata 700064, India
V. Eckardt
Max-Planck-Institut für Physik, Munich, Germany
W.R. Edwards
Lawrence Berkeley National Laboratory, Berkeley, California 94720
L.G. Efimov
Laboratory for High Energy (JINR), Dubna, Russia
V. Emelianov
Moscow Engineering Physics Institute, Moscow Russia
J. Engelage
University of California, Berkeley, California 94720
G. Eppley
Rice University, Houston, Texas 77251
B. Erazmus
SUBATECH, Nantes, France
M. Estienne
Institut de Recherches Subatomiques, Strasbourg, France
P. Fachini
Brookhaven National Laboratory, Upton, New York 11973
R. Fatemi
Massachusetts Institute of Technology, Cambridge, MA 02139-4307
J. Fedorisin
Laboratory for High Energy (JINR), Dubna, Russia
K. Filimonov
Lawrence Berkeley National Laboratory, Berkeley, California 94720
P. Filip
Particle Physics Laboratory (JINR), Dubna, Russia
E. Finch
Yale University, New Haven, Connecticut 06520
V. Fine
Brookhaven National Laboratory, Upton, New York 11973
Y. Fisyak
Brookhaven National Laboratory, Upton, New York 11973
J. Fu
Institute of Particle Physics, CCNU (HZNU), Wuhan 430079, China
C.A. Gagliardi
Texas A&M University, College Station, Texas 77843
L. Gaillard
University of Birmingham, Birmingham, United Kingdom
M.S. Ganti
Variable Energy Cyclotron Centre, Kolkata 700064, India
E. Garcia-Solis
University of Illinois, Chicago
V. Ghazikhanian
University of California, Los Angeles, California 90095
P. Ghosh
Variable Energy Cyclotron Centre, Kolkata 700064, India
Y.G. Gorbunov
Creighton University, Omaha, Nebraska 68178
H. Gos
Warsaw University of Technology, Warsaw, Poland
O. Grebenyuk
NIKHEF and Utrecht University, Amsterdam, The Netherlands
D. Grosnick
Valparaiso University, Valparaiso, Indiana 46383
S.M. Guertin
University of California, Los Angeles, California 90095
K.S.F.F. Guimaraes
Universidade de Sao Paulo, Sao Paulo, Brazil
N. Gupta
University of Jammu, Jammu 180001, India
B. Haag
University of California, Davis, California 95616
T.J. Hallman
Brookhaven National Laboratory, Upton, New York 11973
A. Hamed
Texas A&M University, College Station, Texas 77843
J.W. Harris
Yale University, New Haven, Connecticut 06520
W. He
Indiana University, Bloomington, Indiana 47408
M. Heinz
Yale University, New Haven, Connecticut 06520
T.W. Henry
Texas A&M University, College Station, Texas 77843
S. Hepplemann
Pennsylvania State University, University Park, Pennsylvania 16802
B. Hippolyte
Institut de Recherches Subatomiques, Strasbourg, France
A. Hirsch
Purdue University, West Lafayette, Indiana 47907
E. Hjort
Lawrence Berkeley National Laboratory, Berkeley, California 94720
A.M. Hoffman
Massachusetts Institute of Technology, Cambridge, MA 02139-4307
G.W. Hoffmann
University of Texas, Austin, Texas 78712
D. Hofman
University of Illinois, Chicago
R. Hollis
University of Illinois, Chicago
M.J. Horner
Lawrence Berkeley National Laboratory, Berkeley, California 94720
H.Z. Huang
University of California, Los Angeles, California 90095
S.L. Huang
University of Science & Technology of China, Hefei 230026, China
E.W. Hughes
California Institute of Technology, Pasadena, California 91125
T.J. Humanic
Ohio State University, Columbus, Ohio 43210
G. Igo
University of California, Los Angeles, California 90095
A. Iordanova
University of Illinois, Chicago
P. Jacobs
Lawrence Berkeley National Laboratory, Berkeley, California 94720
W.W. Jacobs
Indiana University, Bloomington, Indiana 47408
P. Jakl
Nuclear Physics Institute AS CR, 250 68 Řež/Prague, Czech Republic
F. Jia
Institute of Modern Physics, Lanzhou, China
P.G. Jones
University of Birmingham, Birmingham, United Kingdom
E.G. Judd
University of California, Berkeley, California 94720
S. Kabana
SUBATECH, Nantes, France
K. Kang
Tsinghua University, Beijing 100084, China
J. Kapitan
Nuclear Physics Institute AS CR, 250 68 Řež/Prague, Czech Republic
M. Kaplan
Carnegie Mellon University, Pittsburgh, Pennsylvania 15213
D. Keane
Kent State University, Kent, Ohio 44242
A. Kechechyan
Laboratory for High Energy (JINR), Dubna, Russia
D. Kettler
University of Washington, Seattle, Washington 98195
V.Yu. Khodyrev
Institute of High Energy Physics, Protvino, Russia
B.C. Kim
Pusan National University, Pusan, Republic of Korea
J. Kiryluk
Lawrence Berkeley National Laboratory, Berkeley, California 94720
A. Kisiel
Warsaw University of Technology, Warsaw, Poland
E.M. Kislov
Laboratory for High Energy (JINR), Dubna, Russia
S.R. Klein
Lawrence Berkeley National Laboratory, Berkeley, California 94720
A.G. Knospe
Yale University, New Haven, Connecticut 06520
A. Kocoloski
Massachusetts Institute of Technology, Cambridge, MA 02139-4307
D.D. Koetke
Valparaiso University, Valparaiso, Indiana 46383
T. Kollegger
University of Frankfurt, Frankfurt, Germany
M. Kopytine
Kent State University, Kent, Ohio 44242
L. Kotchenda
Moscow Engineering Physics Institute, Moscow Russia
V. Kouchpil
Nuclear Physics Institute AS CR, 250 68 Řež/Prague, Czech Republic
K.L. Kowalik
Lawrence Berkeley National Laboratory, Berkeley, California 94720
P. Kravtsov
Moscow Engineering Physics Institute, Moscow Russia
V.I. Kravtsov
Institute of High Energy Physics, Protvino, Russia
K. Krueger
Argonne National Laboratory, Argonne, Illinois 60439
C. Kuhn
Institut de Recherches Subatomiques, Strasbourg, France
A.I. Kulikov
Laboratory for High Energy (JINR), Dubna, Russia
A. Kumar
Panjab University, Chandigarh 160014, India
P. Kurnadi
University of California, Los Angeles, California 90095
A.A. Kuznetsov
Laboratory for High Energy (JINR), Dubna, Russia
M.A.C. Lamont
Yale University, New Haven, Connecticut 06520
J.M. Landgraf
Brookhaven National Laboratory, Upton, New York 11973
S. Lange
University of Frankfurt, Frankfurt, Germany
S. LaPointe
Wayne State University, Detroit, Michigan 48201
F. Laue
Brookhaven National Laboratory, Upton, New York 11973
J. Lauret
Brookhaven National Laboratory, Upton, New York 11973
A. Lebedev
Brookhaven National Laboratory, Upton, New York 11973
R. Lednicky
Particle Physics Laboratory (JINR), Dubna, Russia
C-H. Lee
Pusan National University, Pusan, Republic of Korea
S. Lehocka
Laboratory for High Energy (JINR), Dubna, Russia
M.J. LeVine
Brookhaven National Laboratory, Upton, New York 11973
C. Li
University of Science & Technology of China, Hefei 230026, China
Q. Li
Wayne State University, Detroit, Michigan 48201
Y. Li
Tsinghua University, Beijing 100084, China
G. Lin
Yale University, New Haven, Connecticut 06520
X. Lin
Institute of Particle Physics, CCNU (HZNU), Wuhan 430079, China
S.J. Lindenbaum
City College of New York, New York City, New York 10031
M.A. Lisa
Ohio State University, Columbus, Ohio 43210
F. Liu
Institute of Particle Physics, CCNU (HZNU), Wuhan 430079, China
H. Liu
University of Science & Technology of China, Hefei 230026, China
J. Liu
Rice University, Houston, Texas 77251
L. Liu
Institute of Particle Physics, CCNU (HZNU), Wuhan 430079, China
Z. Liu
Institute of Particle Physics, CCNU (HZNU), Wuhan 430079, China
T. Ljubicic
Brookhaven National Laboratory, Upton, New York 11973
W.J. Llope
Rice University, Houston, Texas 77251
H. Long
University of California, Los Angeles, California 90095
R.S. Longacre
Brookhaven National Laboratory, Upton, New York 11973
W.A. Love
Brookhaven National Laboratory, Upton, New York 11973
Y. Lu
Institute of Particle Physics, CCNU (HZNU), Wuhan 430079, China
T. Ludlam
Brookhaven National Laboratory, Upton, New York 11973
D. Lynn
Brookhaven National Laboratory, Upton, New York 11973
G.L. Ma
Shanghai Institute of Applied Physics, Shanghai 201800, China
J.G. Ma
University of California, Los Angeles, California 90095
Y.G. Ma
Shanghai Institute of Applied Physics, Shanghai 201800, China
D. Magestro
Ohio State University, Columbus, Ohio 43210
D.P. Mahapatra
Institute of Physics, Bhubaneswar 751005, India
R. Majka
Yale University, New Haven, Connecticut 06520
L.K. Mangotra
University of Jammu, Jammu 180001, India
R. Manweiler
Valparaiso University, Valparaiso, Indiana 46383
S. Margetis
Kent State University, Kent, Ohio 44242
C. Markert
University of Texas, Austin, Texas 78712
L. Martin
SUBATECH, Nantes, France
H.S. Matis
Lawrence Berkeley National Laboratory, Berkeley, California 94720
Yu.A. Matulenko
Institute of High Energy Physics, Protvino, Russia
C.J. McClain
Argonne National Laboratory, Argonne, Illinois 60439
T.S. McShane
Creighton University, Omaha, Nebraska 68178
Yu. Melnick
Institute of High Energy Physics, Protvino, Russia
A. Meschanin
Institute of High Energy Physics, Protvino, Russia
J. Millane
Massachusetts Institute of Technology, Cambridge, MA 02139-4307
M.L. Miller
Massachusetts Institute of Technology, Cambridge, MA 02139-4307
N.G. Minaev
Institute of High Energy Physics, Protvino, Russia
S. Mioduszewski
Texas A&M University, College Station, Texas 77843
C. Mironov
Kent State University, Kent, Ohio 44242
A. Mischke
NIKHEF and Utrecht University, Amsterdam, The Netherlands
D.K. Mishra
Institute of Physics, Bhubaneswar 751005, India
J. Mitchell
Rice University, Houston, Texas 77251
B. Mohanty
Lawrence Berkeley National Laboratory, Berkeley, California 94720
L. Molnar
Purdue University, West Lafayette, Indiana 47907
C.F. Moore
University of Texas, Austin, Texas 78712
D.A. Morozov
Institute of High Energy Physics, Protvino, Russia
M.G. Munhoz
Universidade de Sao Paulo, Sao Paulo, Brazil
B.K. Nandi
Indian Institute of Technology, Mumbai, India
C. Nattrass
Yale University, New Haven, Connecticut 06520
T.K. Nayak
Variable Energy Cyclotron Centre, Kolkata 700064, India
J.M. Nelson
University of Birmingham, Birmingham, United Kingdom
N.S. Nepali
Kent State University, Kent, Ohio 44242
P.K. Netrakanti
Purdue University, West Lafayette, Indiana 47907
L.V. Nogach
Institute of High Energy Physics, Protvino, Russia
S.B. Nurushev
Institute of High Energy Physics, Protvino, Russia
G. Odyniec
Lawrence Berkeley National Laboratory, Berkeley, California 94720
A. Ogawa
Brookhaven National Laboratory, Upton, New York 11973
V. Okorokov
Moscow Engineering Physics Institute, Moscow Russia
M. Oldenburg
Lawrence Berkeley National Laboratory, Berkeley, California 94720
D. Olson
Lawrence Berkeley National Laboratory, Berkeley, California 94720
M. Pachr
Nuclear Physics Institute AS CR, 250 68 Řež/Prague, Czech Republic
S.K. Pal
Variable Energy Cyclotron Centre, Kolkata 700064, India
Y. Panebratsev
Laboratory for High Energy (JINR), Dubna, Russia
A.I. Pavlinov
Wayne State University, Detroit, Michigan 48201
T. Pawlak
Warsaw University of Technology, Warsaw, Poland
T. Peitzmann
NIKHEF and Utrecht University, Amsterdam, The Netherlands
V. Perevoztchikov
Brookhaven National Laboratory, Upton, New York 11973
C. Perkins
University of California, Berkeley, California 94720
W. Peryt
Warsaw University of Technology, Warsaw, Poland
S.C. Phatak
Institute of Physics, Bhubaneswar 751005, India
M. Planinic
University of Zagreb, Zagreb, HR-10002, Croatia
J. Pluta
Warsaw University of Technology, Warsaw, Poland
N. Poljak
University of Zagreb, Zagreb, HR-10002, Croatia
N. Porile
Purdue University, West Lafayette, Indiana 47907
J. Porter
University of Washington, Seattle, Washington 98195
A.M. Poskanzer
Lawrence Berkeley National Laboratory, Berkeley, California 94720
M. Potekhin
Brookhaven National Laboratory, Upton, New York 11973
E. Potrebenikova
Laboratory for High Energy (JINR), Dubna, Russia
B.V.K.S. Potukuchi
University of Jammu, Jammu 180001, India
D. Prindle
University of Washington, Seattle, Washington 98195
C. Pruneau
Wayne State University, Detroit, Michigan 48201
J. Putschke
Lawrence Berkeley National Laboratory, Berkeley, California 94720
I.A. Qattan
Indiana University, Bloomington, Indiana 47408
G. Rakness
Pennsylvania State University, University Park, Pennsylvania 16802
R. Raniwala
University of Rajasthan, Jaipur 302004, India
S. Raniwala
University of Rajasthan, Jaipur 302004, India
R.L. Ray
University of Texas, Austin, Texas 78712
S.V. Razin
Laboratory for High Energy (JINR), Dubna, Russia
J. Reinnarth
SUBATECH, Nantes, France
D. Relyea
California Institute of Technology, Pasadena, California 91125
A. Ridiger
Moscow Engineering Physics Institute, Moscow Russia
H.G. Ritter
Lawrence Berkeley National Laboratory, Berkeley, California 94720
J.B. Roberts
Rice University, Houston, Texas 77251
O.V. Rogachevskiy
Laboratory for High Energy (JINR), Dubna, Russia
J.L. Romero
University of California, Davis, California 95616
A. Rose
Lawrence Berkeley National Laboratory, Berkeley, California 94720
C. Roy
SUBATECH, Nantes, France
L. Ruan
Lawrence Berkeley National Laboratory, Berkeley, California 94720
M.J. Russcher
NIKHEF and Utrecht University, Amsterdam, The Netherlands
R. Sahoo
Institute of Physics, Bhubaneswar 751005, India
T. Sakuma
Massachusetts Institute of Technology, Cambridge, MA 02139-4307
S. Salur
Yale University, New Haven, Connecticut 06520
J. Sandweiss
Yale University, New Haven, Connecticut 06520
M. Sarsour
Texas A&M University, College Station, Texas 77843
P.S. Sazhin
Laboratory for High Energy (JINR), Dubna, Russia
J. Schambach
University of Texas, Austin, Texas 78712
R.P. Scharenberg
Purdue University, West Lafayette, Indiana 47907
N. Schmitz
Max-Planck-Institut für Physik, Munich, Germany
K. Schweda
Lawrence Berkeley National Laboratory, Berkeley, California 94720
J. Seger
Creighton University, Omaha, Nebraska 68178
I. Selyuzhenkov
Wayne State University, Detroit, Michigan 48201
P. Seyboth
Max-Planck-Institut für Physik, Munich, Germany
A. Shabetai
Institut de Recherches Subatomiques, Strasbourg, France
E. Shahaliev
Laboratory for High Energy (JINR), Dubna, Russia
M. Shao
University of Science & Technology of China, Hefei 230026, China
M. Sharma
Panjab University, Chandigarh 160014, India
W.Q. Shen
Shanghai Institute of Applied Physics, Shanghai 201800, China
S.S. Shimanskiy
Laboratory for High Energy (JINR), Dubna, Russia
E.P. Sichtermann
Lawrence Berkeley National Laboratory, Berkeley, California 94720
F. Simon
Massachusetts Institute of Technology, Cambridge, MA 02139-4307
R.N. Singaraju
Variable Energy Cyclotron Centre, Kolkata 700064, India
N. Smirnov
Yale University, New Haven, Connecticut 06520
R. Snellings
NIKHEF and Utrecht University, Amsterdam, The Netherlands
P. Sorensen
Brookhaven National Laboratory, Upton, New York 11973
J. Sowinski
Indiana University, Bloomington, Indiana 47408
J. Speltz
Institut de Recherches Subatomiques, Strasbourg, France
H.M. Spinka
Argonne National Laboratory, Argonne, Illinois 60439
B. Srivastava
Purdue University, West Lafayette, Indiana 47907
A. Stadnik
Laboratory for High Energy (JINR), Dubna, Russia
T.D.S. Stanislaus
Valparaiso University, Valparaiso, Indiana 46383
D. Staszak
University of California, Los Angeles, California 90095
R. Stock
University of Frankfurt, Frankfurt, Germany
A. Stolpovsky
Wayne State University, Detroit, Michigan 48201
M. Strikhanov
Moscow Engineering Physics Institute, Moscow Russia
B. Stringfellow
Purdue University, West Lafayette, Indiana 47907
A.A.P. Suaide
Universidade de Sao Paulo, Sao Paulo, Brazil
M.C. Suarez
University of Illinois, Chicago
N.L. Subba
Kent State University, Kent, Ohio 44242
E. Sugarbaker
Ohio State University, Columbus, Ohio 43210
M. Sumbera
Nuclear Physics Institute AS CR, 250 68 Řež/Prague, Czech Republic
Z. Sun
Institute of Modern Physics, Lanzhou, China
B. Surrow
Massachusetts Institute of Technology, Cambridge, MA 02139-4307
M. Swanger
Creighton University, Omaha, Nebraska 68178
T.J.M. Symons
Lawrence Berkeley National Laboratory, Berkeley, California 94720
A. Szanto de Toledo
Universidade de Sao Paulo, Sao Paulo, Brazil
J. Takahashi
Universidade de Sao Paulo, Sao Paulo, Brazil
A.H. Tang
Brookhaven National Laboratory, Upton, New York 11973
T. Tarnowsky
Purdue University, West Lafayette, Indiana 47907
J.H. Thomas
Lawrence Berkeley National Laboratory, Berkeley, California 94720
A.R. Timmins
University of Birmingham, Birmingham, United Kingdom
S. Timoshenko
Moscow Engineering Physics Institute, Moscow Russia
M. Tokarev
Laboratory for High Energy (JINR), Dubna, Russia
T.A. Trainor
University of Washington, Seattle, Washington 98195
S. Trentalange
University of California, Los Angeles, California 90095
R.E. Tribble
Texas A&M University, College Station, Texas 77843
O.D. Tsai
University of California, Los Angeles, California 90095
J. Ulery
Purdue University, West Lafayette, Indiana 47907
T. Ullrich
Brookhaven National Laboratory, Upton, New York 11973
D.G. Underwood
Argonne National Laboratory, Argonne, Illinois 60439
G. Van Buren
Brookhaven National Laboratory, Upton, New York 11973
N. van der Kolk
NIKHEF and Utrecht University, Amsterdam, The Netherlands
M. van Leeuwen
Lawrence Berkeley National Laboratory, Berkeley, California 94720
A.M. Vander Molen
Michigan State University, East Lansing, Michigan 48824
R. Varma
Indian Institute of Technology, Mumbai, India
I.M. Vasilevski
Particle Physics Laboratory (JINR), Dubna, Russia
A.N. Vasiliev
Institute of High Energy Physics, Protvino, Russia
R. Vernet
Institut de Recherches Subatomiques, Strasbourg, France
S.E. Vigdor
Indiana University, Bloomington, Indiana 47408
Y.P. Viyogi
Institute of Physics, Bhubaneswar 751005, India
S. Vokal
Laboratory for High Energy (JINR), Dubna, Russia
S.A. Voloshin
Wayne State University, Detroit, Michigan 48201
W.T. Waggoner
Creighton University, Omaha, Nebraska 68178
F. Wang
Purdue University, West Lafayette, Indiana 47907
G. Wang
University of California, Los Angeles, California 90095
J.S. Wang
Institute of Modern Physics, Lanzhou, China
X.L. Wang
University of Science & Technology of China, Hefei 230026, China
Y. Wang
Tsinghua University, Beijing 100084, China
J.W. Watson
Kent State University, Kent, Ohio 44242
J.C. Webb
Valparaiso University, Valparaiso, Indiana 46383
G.D. Westfall
Michigan State University, East Lansing, Michigan 48824
A. Wetzler
Lawrence Berkeley National Laboratory, Berkeley, California 94720
C. Whitten Jr
University of California, Los Angeles, California 90095
H. Wieman
Lawrence Berkeley National Laboratory, Berkeley, California 94720
S.W. Wissink
Indiana University, Bloomington, Indiana 47408
R. Witt
Yale University, New Haven, Connecticut 06520
J. Wu
University of Science & Technology of China, Hefei 230026, China
N. Xu
Lawrence Berkeley National Laboratory, Berkeley, California 94720
Q.H. Xu
Lawrence Berkeley National Laboratory, Berkeley, California 94720
Z. Xu
Brookhaven National Laboratory, Upton, New York 11973
P. Yepes
Rice University, Houston, Texas 77251
I-K. Yoo
Pusan National University, Pusan, Republic of Korea
V.I. Yurevich
Laboratory for High Energy (JINR), Dubna, Russia
W. Zhan
Institute of Modern Physics, Lanzhou, China
H. Zhang
Brookhaven National Laboratory, Upton, New York 11973
W.M. Zhang
Kent State University, Kent, Ohio 44242
Y. Zhang
University of Science & Technology of China, Hefei 230026, China
Z.P. Zhang
University of Science & Technology of China, Hefei 230026, China
Y. Zhao
University of Science & Technology of China, Hefei 230026, China
C. Zhong
Shanghai Institute of Applied Physics, Shanghai 201800, China
J. Zhou
Rice University, Houston, Texas 77251
R. Zoulkarneev
Particle Physics Laboratory (JINR), Dubna, Russia
Y. Zoulkarneeva
Particle Physics Laboratory (JINR), Dubna, Russia
A.N. Zubarev
Laboratory for High Energy (JINR), Dubna, Russia
J.X. Zuo
Shanghai Institute of Applied Physics, Shanghai 201800, China
Abstract
We present STAR measurements of the azimuthal anisotropy parameter
for pions, kaons, protons, , ,
, and , along with
for pions, kaons, protons, and at
mid-rapidity for Au+Au collisions at and
200 GeV. The values for all hadron species at 62.4 GeV are
similar to those observed in 130 and 200 GeV collisions. For observed
kinematic ranges, values at 62.4, 130, and 200 GeV are as little
as 10%–15% larger than those in Pb+Pb collisions at
GeV. At intermediate transverse momentum
( from 1.5–5 GeV/c), the 62.4 GeV and
values are consistent with the quark-number scaling first observed at
200 GeV. A four-particle cumulant analysis is used to assess the
non-flow contributions to pions and protons and some indications are
found for a smaller non-flow contribution to protons than pions.
Baryon is larger than anti-baryon at 62.4 and 200 GeV
perhaps indicating either that the initial spatial net-baryon
distribution is anisotropic, that the mechanism leading to transport
of baryon number from beam- to mid-rapidity enhances , or that
anti-baryon and baryon annihilation is larger in the in-plane
direction.
pacs:
25.75.Ld, 25.75.Dw
I Introduction
In non-central heavy-ion collisions, the overlapping area has a
long axis and a short axis. Re-scattering amongst the system’s
constituents converts the initial coordinate-space anisotropy to a
momentum-space anisotropy OllitraultSorge ; firstv2 ; rhicv2 . The
spatial anisotropy decreases as the evolution progresses so
that the momentum anisotropy is most sensitive to the early
phase of the evolution — before the spatial asymmetry is
washed-out Kolb:2000sd .
Ultra-relativistic Au+Au collisions at Brookhaven National
Laboratory’s Relativistic Heavy Ion Collider (RHIC) RHIC are
studied in part to deduce whether quarks and gluons become deconfined
during the early, high energy-density phase of these collisions. Since
the azimuthal momentum-space anisotropy of particle production is
sensitive to the early phase of the collision’s evolution, observables
measuring this anisotropy are especially interesting. The azimuth
angle () dependence of particle momentum distributions can be
expressed in the form of a Fourier series: ,
where is the reaction-plane
angle note ; Voloshin:1994mz . The Fourier coefficients can
be measured and used to characterize the azimuthal anisotropy of
particle production.
Measurements at two higher RHIC energies ( and
200 GeV) established that charged hadron rises with for
GeV/c and then saturates Adler:2002pu ; Adler:2002ct . As
predicted by the hydrodynamic calculations hydroPasi01 ; hydroShuryak01 — where local thermal equilibrium is assumed —
at low ( GeV/c) shows a characteristic dependence
on particle mass PIDv2 ; Adams:2004bi . The values at
and 200 GeV are as large as those predicted by
hydrodynamic calculations. The values measured at
GeV NA49 , the top energy of the Super
Proton Synchrotron (SPS) at CERN, however, are below the hydrodynamic
models predictions. In this paper, we compare at
and 200 GeV to new measurements at
GeV that provide a link between the top RHIC
energy and the top SPS energy.
In 200 GeV collisions, kaon, proton, and
at intermediate depends on the
number of constituent quarks in the corresponding
hadron scalingv2 . A scaling law — motivated by
constituent-quark coalescence or recombination models — can account
for the observed splitting between baryons and mesons for in
this intermediate region scalingv2 ; CoalVoloshinv2 . Within these
models, hadron () is related to the of quarks
() in a quark-gluon phase by the relationship: reco . Intermediate
baryon yields also increase with collision centrality more
rapidly than meson yields scalingv2 ; Adler:2003kg : a behavior
also expected from coalescence or recombination
models reco . These models suggest that the large values
at intermediate are developed during a pre-hadronic phase — a
conclusion supported by the recent discovery that multi-strange
baryons, thought to have smaller hadronic
cross-sections Biagi:1980ar ; msb130 , attain values
apparently as large as protons or hyperons msbv2 . Measurements
of for identified particles may, therefore, help reveal whether
is developed in a deconfined quark-gluon phase and can test
whether these possible conclusions may still be valid at lower
.
This article is organized as follows: in Sec. II we briefly
describe the STAR detector. The analysis procedures are presented in
Sec. III. In Sec. IV we present our results. This section
includes subsections discussing systematic uncertainties, baryon
versus anti-baryon , quark-number scaling, the fourth harmonic
, and the collision energy dependence of . Our conclusions
are then presented in Sec. V.
II Experiment
Our data were collected from Au + Au collisions at and 200 GeV with the STAR detector STAR . STAR’s main time
projection chamber (TPC) tpc was used for particle tracking and
identification with supplementary particle identification provided by
time-of-flight detectors (TOF) tof . We analyzed events from a
centrality interval corresponding to 0%–80% of the hadronic
interaction cross-section. As in previous STAR
analyses scalingv2 , we define the centrality of an event from
the number of charged tracks in the TPC having pseudo-rapidity , GeV/c, a distance of closest approach to the primary
vertex (DCA) less than 2 cm, and more than 10 measured space
points mult . Only events with primary vertices within 30 cm of
the TPC center in the beam direction were analyzed.
STAR’s main TPC covers the approximate pseudo-rapidity region (for collisions at its center) and in azimuth angle. A
0.5 Tesla magnetic field allows charged particle to be measured
above 0.1 GeV/c. At the time of data taking the TOF detectors covered
and in azimuth angle. Their timing resolutions
are ps so that pions and kaons can be distinguished for
1.8 GeV/c and protons can be identified up to GeV/c.
III Analysis
We identify particles using three different methods: measurement of
specific ionization-energy-loss per unit length in the TPC gas
(), time-of-flight measurements, and weak-decay vertex
finding. measurements for a particle with a given momentum are
used for identification at low and in the relativistic-rise
region ( GeV/c) where increases logarithmically
with (see Ref. Shao:2005iu and Fig. 26 in
Ref. hb ). The pion sample in the relativistic-rise region is
selected based on the deviation between the measured of each
track and the expected for a pion in units of Gaussian
standard deviations (). For GeV/c, pions are
selected with (the top half of the distribution). In
this case the purity is estimated to be %.
The of protons is measured in this region by fitting the
distribution with peaks centered at the predicted values. From
these fits we can derive the relative fractions of pions (),
kaons () and protons () as a function of . We
then measure for all tracks and plot it versus the of
the track. Once the relative fractions of each particle are known for
each value of , and is know as a function of ,
can be fit with function:
(1)
where the values for each species (, , and
) are parameters in the fit and , , and
which are extracted from the distribution, are part of the fit
function. In the relativistic rise region, kaons do not dominate the
distribution for any value of , so their values
are poorly constrained and are not presented here. We estimated the
systematic error on the proton by varying the relative fractions
of the different particles within reasonable limits. The relative
change in the proton () was less than 3%. The
shape and width of the peaks are determined from samples of particles
identified by other means, e.g. TOF measurements and
or decay daughters.
The reaction-plane direction is estimated for each event from the
azimuthal distribution of charged tracks. We select tracks using
criteria similar to those in Ref. firstv2 . To avoid
self-correlations, we subtract the contribution of a given particle
from the total reaction-plane vector. For particles identified through
their decays, we subtract the contributions of all the decay
products. The reaction-plane resolution is estimated using the
sub-event method art and we correct the observed to
account for the dilution caused by imperfect resolution. The
resolution depends on the number of tracks used in the calculation and
the magnitude of , and therefore depends on centrality. The
resolution for GeV collisions is reduced
relative to GeV collisions by %.
For 62.4 GeV Au+Au collisions it reaches a maximum value of
approximately 0.73 in the 10%–40% centrality interval.
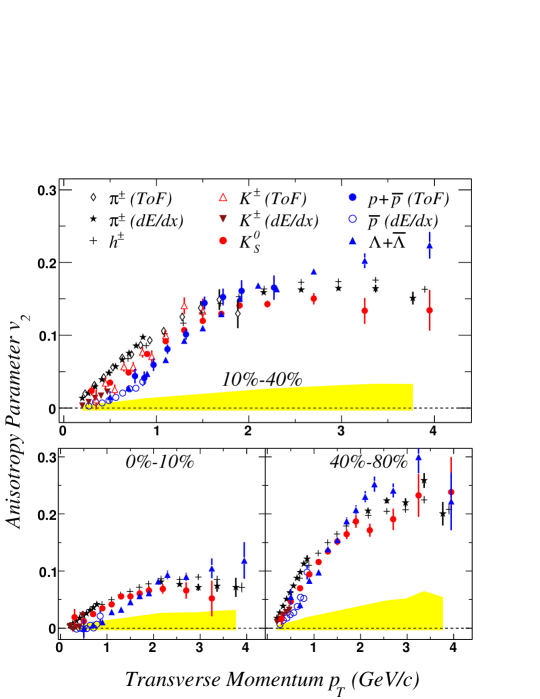
IV Results
Figure 1: (color online). Minimum-bias (0–80% of the collision cross
section) for identified hadrons at from
Au+Au collisions at GeV. To facilitate
comparisons between panels, values for inclusive charged
hadrons are displayed in each panel. The error bars on the data
points represent statistical uncertainties. Systematic uncertainties
for the identified particles are shown as shaded bands around
.
In Fig. 1 the minimum-bias, mid-rapidity values are
shown for inclusive charged hadrons, pions, kaons, protons,
, , and
. The gross features of at
GeV are similar to those observed at
GeV PIDv2 ; scalingv2 . For
GeV/c, a mass hierarchy is observed with smaller for
heavier particles. The and mass dependencies are
qualitatively (not necessarily quantitatively) consistent
with expectations from hydrodynamic calculations that assume the
mean-free-path between interactions is zero hydroPasi01 . For
GeV/c, reaches a maximum, the mass ordering is broken,
and for protons and hyperons tend to be larger than for either
pions or kaons. The values for protons and
above GeV/c are similar. In
this region, the multi-strange baryons also exhibit values
similar to protons. While hadrons containing strange quarks are
expected to be less sensitive to the hadronic stage, we do not see a
statistically significant reduction in the values of strange
baryons compared to protons. Statistical uncertainties, however, still
do not exclude the possibility of some strangeness content dependence
for . If or its hadron species dependence is developed
through hadronic interactions, should depend on the
cross-sections of the interacting hadrons (with hadrons with smaller
cross-sections developing less anisotropy). The large values for
and are consistent
with having been developed before hadronization.
Figure 2: (color online). The unidentified charged hadron, charged
pion, , charged kaon, proton and
as a function of for
10%–40%, 0%–10% and 40%–80% of the Au+Au interaction cross
section at GeV. Weak-decay feed-down errors
are included in the error bars on the data points while non-flow and
tracking error uncertainties are plotted as bands around ,
which apply to all identified particles. The errors are asymmetric
and the portion of the error band above (below) zero represents the
negative (positive) error.
The centrality dependence of identified hadron for
GeV is shown in Fig. 2. Similar
and mass dependencies are observed for each of the centrality
intervals: 0%–10%, 10%–40%, and 40%–80%. The data from the
0%–10% interval are most affected by non-flow
effects Adler:2002pu while the 10%–40% interval is least
affected by these uncertainties. The particle-type dependence of
non-flow will be discussed in the following section.
IV.1 Systematic Uncertainties
Systematic uncertainties are shown in Fig. 1 as bands around
. The errors are asymmetric. The portions of the band above
zero represent the negative errors so that the difference between the
measurement and zero is more visually evident. These uncertainties
take into account effects from weak-decay feed-down, tracking
artifacts, detector artifacts, and non-flow effects. Non-flow effects
are dominant. In Fig. 2 the tracking and non-flow systematic
uncertainties are shown as bands around and the weak-decay
feed-down uncertainties are included in the error bars on the pion
data points.
The number of tracks coming from weak-decays that are included in the
analysis depends on the experimental setup and track selection
criteria. Pions produced in , , or
decays tend to be distributed at low with
values larger than the pions from other sources. We have
calculated their effect on the observed pion . We assume
exponential spectra for and with inverse slope
parameters of 285 and 300 MeV respectively. For relative abundances,
we take and
ratios of 0.06 and 0.054
respectively. The of and are taken from
data. We then use a full detector simulation to estimate what fraction
of the weak-decay products will fall within our detector acceptance
and pass our track selection criteria. We find that for our analysis,
feed-down will increase by approximately 13% (as a fraction of
the original ) at GeV/c. The increase falls to
approximately 3% relative at GeV/c and is negligible for
GeV/c. Modifications to the observed proton from
and decays are neglegible due to the
similarity of proton and hyperon .
measurements can also be distorted by anti-correlations that
arise from tracking errors (e.g. track-merging and
hit-sharing). These anti-correlations can be eliminated by correlating
tracks with with an event plane determined from
tracks at (-subevents). This method
also has a different sensitivity to the spurious correlations arising
from jets and resonance decays (non-flow effects discussed in the next
paragraph). In this paper, -subevents are used to analyze pion,
, proton and . The remaining
systematic uncertainties from detector artifacts are estimated by
comparing data taken with different field settings: 0.5 Tesla
(full-field) and 0.25 Tesla (half-field). The STAR experiment did not
collect half-field data during the 62.4 GeV data taking period so we
use the 200 GeV data to estimate the uncertainties in the 62.4 GeV
measurements. From these studies, we assign an uncertainty to
for all particles of (absolute).
The dominant systematic uncertainties in measurements arise from
correlations unrelated to the reaction plane (thought to be primarily
from correlations between particles coming from jets or resonance
decays or other correlations intrinsic to p+p collisions). When
is measured using an event-plane analysis () art ,
these correlations can bias the experimental estimation of the
reaction plane (the event-plane angle) and change the apparent
values (non-flow). A four-particle cumulant analysis of
() is less sensitive to non-flow effects than a standard
analysis but yields larger statistical
uncertainties Adler:2002pu . Although has been
shown to significantly reduce non-flow uncertainties, some sources of
uncertainty may remain: e.g. if fluctuates from
event-to-event may yield values smaller than the mean
Miller:2003kd . The magnitude of possible non-flow
correlations for unidentified charged hadrons is discussed in
Refs. Adler:2002pu ; Adams:2004bi . Here we also discuss
variations of non-flow effects between different hadron types.
For GeV/c, a four-particle cumulant analysis is carried out
for pions and protons identified with greater than 98% purity. To
study the hadron-type dependence of non-flow effects at intermediate
, we analyze two samples of charged hadrons at GeV/c: one with , the other with . Data from the 10%–40% centrality interval
are used. For , approximately 98% of the
charged tracks are pions. For , the sample contained approximately 75% protons, 19% kaons and
6% pions. The ratio of the event-plane ({EP})
to the cumulant ({4}) for the pion sample and the proton
sample are listed in Table 1. In the region below
1 GeV/c, proton does not appear to manifest any non-flow
correlations for either energy. For pions in this region, however,
non-flow correlations seem to account for 10% of the measured
with the event-plane analysis.
At intermediate , is greater than unity for
protons and pions. This shows that non-flow correlations increase the
observed for both protons and pions. At 62.4 GeV, the
increase is the same (within errors) for both particles. With the
larger 200 GeV data set however, we observe a larger non-flow
fraction for pions than protons: the pion and for the proton sample . Pion , therefore, appears to be more susceptible to
non-flow correlations than for particles in the proton sample.
Table 1: The ratio {EP}/{4} ( from a standard
event-plane analysis over from a four-particle cumulant
analysis) for the centrality interval 10%–40% in three
ranges (units for are GeV/c). The sample from GeV
labeled as protons contains contamination from pions (6%) and kaons
(19%).
62.4 GeV
200 GeV
pions
protons
pions
protons
IV.2 Baryon vs. Anti-baryon
To our knowledge, no prediction for a difference between baryon and
anti-baryon exists in the literature. Previous measurements at
RHIC of identified baryon reported no differences between
and or between proton and
anti-proton . Typically the particle and anti-particle samples
were combined. These measurements were made with smaller data samples
and at higher energies where the anti-baryon to baryon yield ratios
are much closer to unity.
Several scenarios can lead to a difference between anti-baryon and
baryon that is larger when the anti-baryon to baryon yield ratio
is smaller: (1) baryons may develop larger momentum-space anisotropies
through multiple rescattering as they are transported to mid-rapidity,
(2) if the initial spatial net-baryon density is anisotropic, flow
developing in a later stage could convert that spatial anisotropy to
an observable momentum-space anisotropy, and (3) annihilation of
anti-baryons in the medium can reduce the anti-baryon yield, with the
reduction larger in the more dense, in-plane direction than the
out-of-plane direction. We consider scenario (1) and (2) to be
distinct. In scenario (1), extra is built up while the baryons
are being transported to mid-rapidity, while in scenario (2) the
is established through rescattering after the baryons are transported
to mid-rapidity.
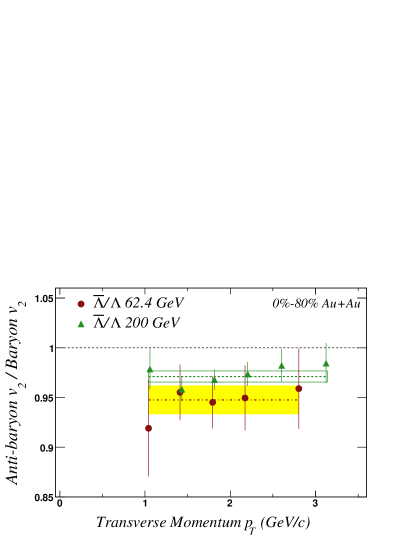
Figure 3: (color online). The ratio of to
. The data are from minimum bias Au+Au collisions at
62.4 and 200 GeV. The bands show the average
values of the ratios within the indicated
ranges.
In Fig. 3 we show the ratio of
to . The data are from minimum bias Au+Au collisions at
62.4 and 200 GeV. The bands on the figure represent the mean values of
the ratios which are respectively and for 62.4 and 200 GeV. In the measured range, the
is systematically smaller than the
for both energies and within errors is approximately
independent (fitting the data with a straight line yields slopes
of (GeV/c)-1 and (GeV/c)-1 respectively for 62.4 and 200 GeV data). The
difference between and is larger
at 62.4 GeV, where the to yield ratio
is smaller. Taking into account the yield
ratios (measured to be at 62.4 GeV and at 200 GeV/c starbbarb ), we find that at 62.4 GeV the net
(the asymmetry of the quantity ) is 12% 3% larger than the of all
other s or s. At 200 GeV it is 13%
4% larger.
The larger is not anticipated from the RQMD hadronic
transport model rqmd where at mid-rapidity, the ratio of
anti-proton to proton is and the ratio
of to is . We note however that this model does not reproduce the overall
magnitude of at this energy either.
Figure 4: (color online). The integrated ratio of
to for three centrality
intervals: 0%–10%, 10%–40%, and 40%–80%. The data are from
Au+Au collisions at 62.4 and 200 GeV.
In Fig. 4 we display the centrality dependence of the
integrated to
ratio. A Monte-Carlo Glauber model is used to convert the centrality
intervals defined by multiplicity into mean impact parameter
values. Given the errors we are unable to make a definitive statement
about a possible dependence of the ratio on centrality.
IV.3 Quark-number Scaling
Models of hadron formation by coalescence or recombination of quarks
successfully reproduce many features of hadron production in the
intermediate region ( GeV/c) scalingv2 ; reco ; CoalVoloshinv2 . These models find that at intermediate ,
may follow a quark-number () scaling with for
most hadrons falling approximately on one curve. In these models, this
universal curve represents the momentum-space anisotropy developed by
quarks prior to hadron formation. This scaling behavior was observed
in Au+Au collisions at 200 GeV scalingv2 . Approximate quark
number scaling of also exhists in RQMD models where the scaling
is related to the additive quark hypothesis for hadronic
cross-sections rqmd ; Lu:2006qn . The RQMD model, however,
under-predicts the value of by approximately a factor of
two. Pre-hadronic interactions are therefore thought necessary to
generate a as large as that observed at RHIC. If is
predominantly established in this pre-hadronic phase, the hadronic
cross-sections might not play a dominant role in establishing the
particle-type dependence of .
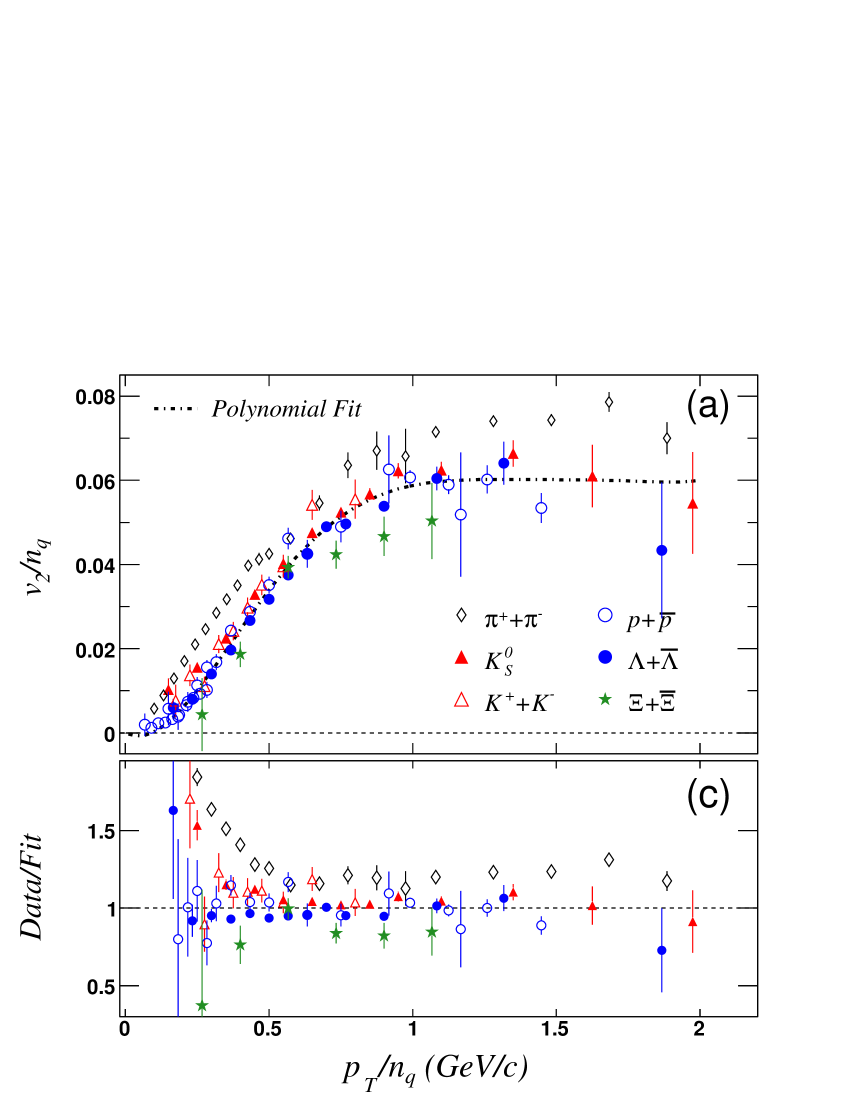
Figure 5: (color online). Identified particle from minimum
bias collisions at GeV scaled by the
number of valence quarks in the hadron () and plotted
versus (a) and (b). In each case a
polynomial curve is fit to all particles except pions. The ratio
of to the fit function is shown in the bottom panels
(c) and (d).
Fig. 5 shows scaled by the number of valence quarks in
the hadron () as a function of (a) and
(b) for identified hadrons at GeV. A
polynomial function has been fit to the scaled values of for all
particles except pions, which, for reasons discussed below, may
violate the scaling. To investigate the quality of agreement between
hadron species, the data from the top panel are scaled by the fitted
polynomial function and plotted in the bottom panels (c) and (d) of
Fig. 5. In panel (c), for GeV/c, the scaled
of , , p+ and
, lie on a single curve, within
errors. The 62.4 GeV data for these species are therefore consistent
with the scaling observed in 200 GeV collisions. The
may lie below the curve but the current
errors do not permit a strong conclusion regarding deviations between
and or
. At GeV/c, the
scaling breaks down.
It was shown that for 200 GeV at GeV/c2,
is a linear function and independent of hadron
mass sqm03 . In Fig. 5 panels (b) and (d) we combine
scaling and scaling so that a single curve can be used to
approximately describe throughout the measured range. This is
the same scaling as used in Ref. Adare:2006ti where the figures
are labelled ( is the transverse kinetic energy). This
combined scaling works because in the range where is a linear
function of , dividing by does not alter the shape of
the curve. Once it is observed that for all particles follow the
same linear function for , the scaling of with
becomes trivial. At higher , is only weakly dependent
on so that changing the axis variable from to
does not effect the scaling significantly.
Pion deviates significantly from the fit function in both panels
(a) and (b). The contribution of pions from resonance decays to the
observed pion may account for much of the deviation for GeV/c decayv2 . For GeV/c, non-flow correlations
discussed previously may contribute to the deviation. From the results
in Table 1, we conclude that non-flow effects tend to be
larger for pions than protons. Particularly for the 200 GeV data,
removing non-flow contributions will increase the difference between
pion and proton and will improve the agreement between pion
and for the other measured particles. It has also
been suggested that constituent-quark-number scaling may be violated
for pions because the pion mass is much smaller than the masses of its
constituent-quarks. This implies a larger binding energy and a wider
wave-function for the pion. As a result, the approximation that
hadrons coalesce from constituent-quarks with nearly co-linear momenta
is broken decayv2 .
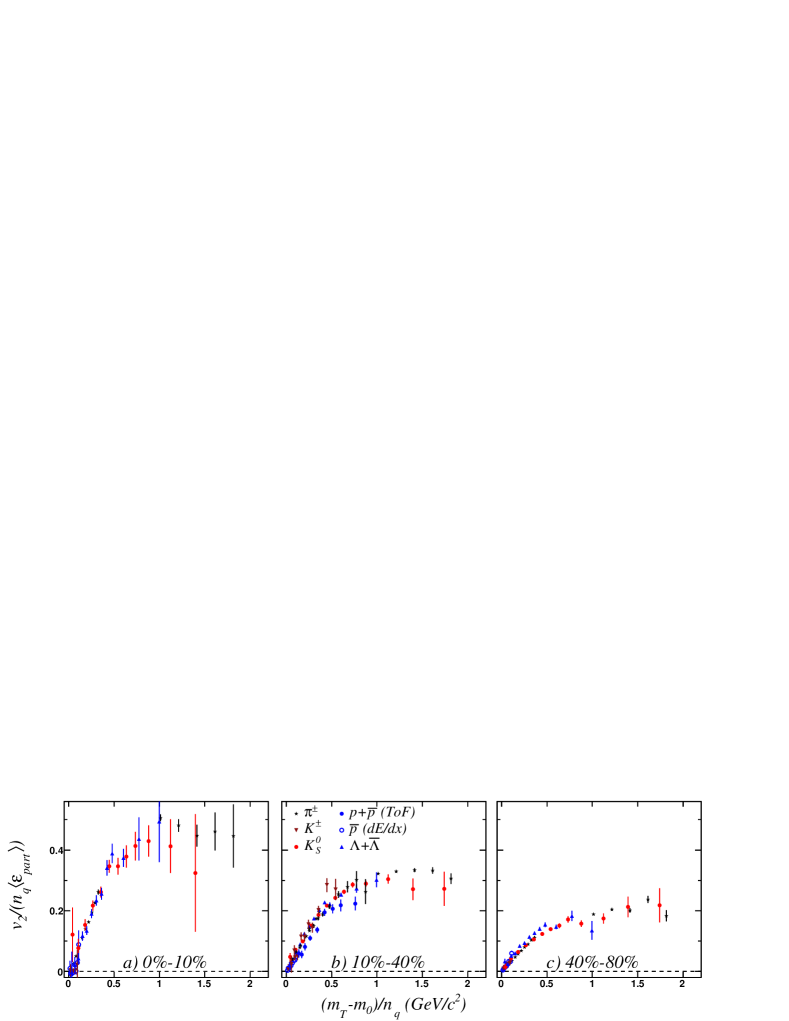
Figure 6: (color online). scaled by the mean eccentricity of
the initial overlap region versus for 0%–10%,
10%–40%, and 40%–80% most central Au+Au collisions at
= 62.4 GeV.
Fig. 6 shows versus for 0%–10%,
10%–40%, and 40%–80% most central Au+Au collisions at
= 62.4 GeV. for each centrality interval is
scaled by the mean eccentricity of the initial overlap region. The
eccentricity is calculated from the mean and positions of the
participating nucleons using a Monte-Carlo Glauber model. The
coordinate system is shifted and rotated so that is located at
the center-of-mass of the participants and the eccentricity is the
maximum possible. This is referred to as the participant eccentricity
(). Since the true reaction plane is not know, our
measurements are sensitive to
phobos . For the 0%–10%, 10%–40%,
and 40%–80% centrality intervals the
values respectively are 0.080,
0.247, and 0.547.
The and scalings shown for minimum bias data in
Fig. 5 are also valid within the specific centrality intervals
shown in Fig. 6. Early hydrodynamic calculations predicted
that should approximately scale with the initial spatial
eccentricity of the collision
system Kolb:2000sd . contradicts these
expectations and rises monotonically as the centrality changes from
peripheral to central. This indicates that central collisions are more
efficient at converting spatial anisotropy to momentum-space
anisotropy.
IV.4 Fourth Harmonic
Figure 7: (color online). Top panels: minimum bias for pions,
charged kaons, , anti-protons and
at 62.4 GeV. In
the left panel the solid (dashed) line shows the value for
for pions (kaons). In the right panel the dashed line is
for . Bottom panels: scaled by
(points where and fluctuate around zero are
not plotted). Grey bands correspond to the fit results described
in the text and Table 2. The systematic errors on the
ratio from non-flow are included in the error bars
leading to asymmetric errors.
Higher order anisotropy parameters (, , etc.) may be
sensitive probes of hydrodynamic behavior and the initial conditions
of the collision system Kolb:2003zi . The authors of
Ref. Borghini:2005kd argue that values of the ratio
larger than 0.5 indicate deviations from ideal fluid behavior. When
measured for identified particles, higher harmonics can also test
quark-number scaling recov4 . and for charged
hadrons at 200 GeV are shown in Ref. Adams:2003zg . Identified
particle at 200 GeV is shown in Ref. Adams:2004bi . In
Fig. 7 (top panels) we plot pion, kaon, anti-proton and
for GeV,
where the standard event-plane analysis method has been used. In the
bottom panels of Fig. 7 we show the ratio for
charged pions, neutral kaons, and hyperons. The uncertainty in
from possible non-flow leads to asymmetric errors. The
ratio is well above 0.5 even when errors are taken into
account.
In simple coalescence models recov4 , the ratio for
hadrons is related to for quarks:
(2)
(3)
where here is the quark . The for mesons can
also be related to for baryons:
(4)
Within this simple model, the large ratios presented here
indicate a large quark . At intermediate , where
quark-scaling is thought to be valid, we use the equations above to
fit simultaneously for mesons and baryons, with
for quarks as a free parameter. The fit range is
GeV/c for mesons and GeV/c for baryons. A good
per degree-of-freedom (4.4/13) is found with quark
. The grey bars in the bottom panels of
Fig. 7 show the corresponding values for mesons
and baryons. values for
GeV/c from data and the fit are listed in
Table 2. Since pion is known to deviate from the
simple scaling laws, we also performed the fit excluding the pion data
points (fit II) which yielded a and
per degree-of-freedom of 2.3/9. The small values for both
fits indicate that our data are consistent with quark-number scaling
where quark is approximately 2.
Table 2: The ratio for GeV/c from a
combined fit and from data. Pion data points are used for fit I and
excluded for fit II. The per degree-of-freedom is also
shown on the bottom row.
data
fit I
fit II
quark
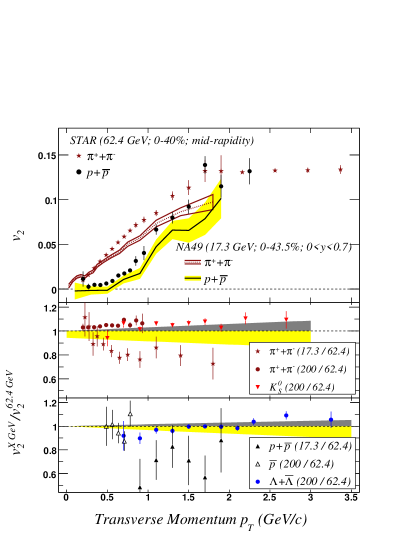
Figure 8: (color online). Top panel: for pions and protons at
62.4 and 17.3 GeV. The 62.4 GeV data are from
TOF and measurements combined. Middle and bottom panel:
ratios of for , , ,
and at different center-of-mass
energies scaled by the values at 62.4 GeV. The grey and yellow
bands represent systematic uncertainties in the ratios
arising from non-flow effects. The grey bands (above unity) are
the uncertainties for the 200 GeV/62.4 GeV data and the yellow
bands (below unity) are for the 17.3 GeV/62.4 GeV data.
IV.5 Collision Energy Dependence
In Fig. 8 (top panel) we plot pion and proton from
Au+Au and 17.3 GeV Pb+Pb
collisions NA49 . In the bottom panels we show pion, ,
proton, and data from 17.3 and/or 200 GeV
scaled by 62.4 GeV data. The 200 to 62.4 GeV ratios are taken using
data measured within the 0%–80% centrality interval. The TOF
measurements presented in this article allow us to show the 17.3
GeV to 62.4 GeV ratio to higher than the 200 GeV data
extends. In order to approximately match the centrality interval used
for the 17.3 GeV data, the 17.3 to 62.4 GeV ratios are taken using
respectively 0%–43.5% and 0%–40% centrality intervals. The STAR
data at 62.4 and 200 GeV are measured within the pseudo-rapidity
interval and the 17.3 GeV data are from the rapidity
interval . These intervals represent similar
values. The same method is used to analyze the 200 and 62.4 GeV data.
Systematic errors from weak-decay feed-down and tracking errors will
mostly cancel when taking the ratio of at 200 and 62.4
GeV. Possible non-flow errors are larger at 200 GeV than at 62.4
GeV. In the lower panels of Fig. 8, the shaded bands around
unity show the uncertainty in the energy dependence of the ratio
arising from possible changes in the magnitude of non-flow effects at
different energies. The portion of the band above unity applies to the
ratio of 200 and 62.4 GeV data while the portion below unity only
applies to the ratio of the 17.3 and 62.4 GeV data.
The data for pions and kaons at 62.4 GeV tends to be about 5%
smaller than the 200 GeV data (although at GeV/c the
difference is within systematic uncertainties). The anti-proton data
at 62.4 and 200 GeV are consistent within errors. The data exclude a
proton variation between 62.4 and 200 GeV greater than
approximately 15%. The data show a
potentially interesting -dependence: for GeV/c the 200
GeV is systematically smaller than
the 62.4 GeV data while for GeV/c the 200 GeV
data are consistent with or larger
than the 62.4 GeV data. Such a dependence can arise if the system in
200 GeV collisions develops a larger expansion velocity.
Appreciable differences are seen between the 17.3 GeV and 62.4 GeV
data. At GeV/c, for both pions and protons, the values
measured at 62.4 GeV are approximately 10%–25% larger than those
measured at 17.3 GeV NA49 ; note2 . Although the
magnitude of is different at the lower energy, the systematics
of the particle-type dependencies are similar. In particular, pion
and proton cross over each other (or attain similar values)
at near GeV/c for 17.3, 62.4 and 200
GeV data. Due to the limited kinematic range covered by the 17.3 GeV
data, a quark-number dependence of at intermediate can
neither be confirmed nor excluded.
The increase in the magnitude of from 17.3 GeV to 62.4 GeV and
the similarity of 62.4 GeV to 200 GeV has been taken as a
possible indication for the onset of a limiting
behavior ph62v2 . In a collisional picture, a saturation of
could indicate that for at and above 62.4 GeV
the number of collisions the system constituents experience in a given
time scale can be considered large and that hydrodynamic equations can
therefore be applied. Hydrodynamic model calculations of depend
on the model initialization and the poorly understood freeze-out
assumptions hydroPasi01 ; hydroShuryak01 . As such, rather than
comparing the predicted and measured values at one energy, the most
convincing way to demonstrate that a hydrodynamic limit has been
reached may be to observe the onset of limiting behavior with
. For this reason, measurements at a variety
of center-of-mass energies are of interest. Contrary to the large
differences reported in Ref. ph62v2 , we find that when the 17.3
and 62.4 GeV data are compared within similar
ranges and when possible non-flow systematic
uncertainties are accounted for (the yellow bands in the bottom panel
of Fig. 8), the differences between within the
data sets may be as small as 10%–15%. As such, a large fraction of
the deviation between the SPS data and hydrodynamic models arises due
to the wide rapidity range covered by those measurements (
approaches zero as beam rapidity is approached Back:2004zg ),
increased values at RHIC and the larger
values predicted for the lower colliding energy by hydrodynamic
models.
V Conclusions
We presented measurements of for pions, kaons, protons,
, , , and
from Au+Au collisions with
GeV. We compared these measurements to similar
measurements at and 200 GeV. The 62.4 GeV
pion, kaon, proton, and hyperon data are, within a few percent,
consistent with the equivalent data at 200 GeV. Within similar
intervals and and after we account for systematic
uncertainties, we find that for a given identified particle species
the difference between 17.3 and 62.4 GeV data may be as small as
10%–15%. We find that is larger than
at 62.4 and 200 GeV and that the difference
is larger at 62.4 GeV where the anti-baryon to baryon yield ratio is
smaller. At both energies our measurements are consistent with net
being approximately 10%–15% larger than
and pair-produced .
Our measurements at 62.4 GeV are consistent with the
quark-number scaling of first observed from Au+Au collisions at
GeV. The 17.3 GeV data do not extend to high
enough to test quark-number scaling. We note, however, that the
where the values for mesons and baryons cross over each
other (or, in the case of 17.3 GeV data, become similar) is
approximately the same at all three center-of-mass energies. This
indicates that identified particle at 17.3 GeV may also be
consistent with quark-number scaling.
We also reported measurements of the higher harmonic term, , for
pions, kaons, protons, and . These
measurements are also consistent with quark-number scaling laws
arising from coalescence or recombination models recov4 . This
quark-number dependence may indicate that in ultra-relativistic
heavy-ion collisions collective motion is established amongst quarks
and gluons before hadrons are formed. This view is supported by the
large values measured for multi-strange baryons at
and 200 GeV msbv2 . Collisions involving
lighter nuclei and larger, deformed nuclei (U+U) will provide another
opportunity to study mass and quark number systematics for . The
possible approach to limiting values for (where the and
mass dependence at GeV/c are consistent with hydrodynamic
models) along with the evidence presented here that the relevant
degrees of freedom in the early system may be sub-hadronic
(e.g. constituent quarks) suggests that a strongly coupled
matter with sub-hadronic degrees of freedom may be created in
heavy-ion collisions at RHIC.
Acknowledgments
We thank the RHIC Operations Group and RCF at BNL, and the
NERSC Center at LBNL for their support. This work was supported
in part by the Offices of NP and HEP within the U.S. DOE Office
of Science; the U.S. NSF; the BMBF of Germany; CNRS/IN2P3, RA, RPL, and
EMN of France; EPSRC of the United Kingdom; FAPESP of Brazil;
the Russian Ministry of Science and Technology; the Ministry of
Education and the NNSFC of China; IRP and GA of the Czech Republic,
FOM of the Netherlands, DAE, DST, and CSIR of the Government
of India; Swiss NSF; the Polish State Committee for Scientific
Research; SRDA of Slovakia, and the Korea Sci. & Eng. Foundation.
References
(1) J.-Y. Ollitrault, Phys. Rev. D 46,
229(1992); H. Sorge, Phys. Rev. Lett. 82, 2048 (1999).
(2)
K. H. Ackermann et al. [STAR Collaboration],
Phys. Rev. Lett. 86, 402 (2001).
(3)
B. B. Back et al. [PHOBOS Collaboration],
Phys. Rev. Lett. 89, 222301 (2002);
K. Adcox et al. [PHENIX Collaboration],
Phys. Rev. Lett. 89, 212301 (2002).
(4)
P. F. Kolb, J. Sollfrank and U. W. Heinz,
Phys. Rev. C 62, 054909 (2000).
(5)
M. Harrison, T. Ludlam and S. Ozaki,
Nucl. Instrum. Meth. A 499, 235 (2003).
(6) The reaction-plane angle is defined by the angle
(relative to the laboratory frame) of the vector that connects the
centers of the two colliding nuclei.
(7)
S. Voloshin and Y. Zhang,
Z. Phys. C 70, 665 (1996).
(8)
C. Adler et al. [STAR Collaboration],
Phys. Rev. C 66, 034904 (2002).
(9)
C. Adler et al. [STAR Collaboration],
Phys. Rev. Lett. 90, 032301 (2003);
J. Adams et al. [STAR Collaboration],
Phys. Rev. Lett. 93, 252301 (2004).
(10) P. Huovinen, P.F. Kolb, U. Heinz, P. V. Ruuskanen, and
S. A. Voloshin, Phys. Lett. B 503, 58 (2001).
(11) D. Teaney, J. Lauret, and E. V. Shuryak, Phys. Rev. Lett. 86, 4783 (2001).
(12)
C. Adler et al. [STAR Collaboration],
Phys. Rev. Lett. 87, 182301 (2001);
C. Adler et al. [STAR Collaboration],
Phys. Rev. Lett. 89, 132301 (2002);
S. S. Adler et al. [PHENIX Collaboration],
Phys. Rev. Lett. 91, 182301 (2003).
(13)
J. Adams et al. [STAR Collaboration],
Phys. Rev. C 72, 014904 (2005).
(14)
C. Alt et al. [NA49 Collaboration],
Phys. Rev. C 68, 034903 (2003).
(15)
J. Adams et al. [STAR Collaboration],
Phys. Rev. Lett. 92, 052302 (2004);
P. R. Sorensen, Ph.D. thesis, University of California–Los Angeles, 2003,
arXiv:nucl-ex/0309003.
(16)
S. A. Voloshin,
Nucl. Phys. A 715, 379 (2003);
D. Molnar and S. A. Voloshin,
Phys. Rev. Lett. 91, 092301 (2003).
(17)
R. C. Hwa and C. B. Yang,
Phys. Rev. C 67, 064902 (2003);
V. Greco, C. M. Ko and P. Levai,
Phys. Rev. Lett. 90, 202302 (2003);
R. J. Fries, B. Muller, C. Nonaka and S. A. Bass,
Phys. Rev. Lett. 90, 202303 (2003).
(18)
S. S. Adler et al. [PHENIX Collaboration],
Phys. Rev. Lett. 91, 172301 (2003).
(19)
S. F. Biagi et al.,
Nucl. Phys. B 186, 1 (1981).
(20)
J. Adams et al. [STAR Collaboration],
Phys. Rev. Lett. 92, 182301 (2004).
(21)
J. Adams et al. [STAR Collaboration],
Phys. Rev. Lett. 95, 122301 (2005).
(22)
K. H. Ackermann et al. [STAR Collaboration],
Nucl. Instrum. Meth. A 499, 624 (2003).
(23)
K. H. Ackermann et al. [STAR Collaboration],
Nucl. Phys. A 661, 681 (1999).
(24)
J. Wu et al.,
Nucl. Instrum. Meth. A 538, 243 (2005).
(25)
J. Adams et al. [STAR Collaboration],
Phys. Rev. C 73, 034906 (2006).
(26)
M. Shao, O. Barannikova, X. Dong, Y. Fisyak, L. Ruan, P. Sorensen and Z. Xu,
Nucl. Instrum. Meth. A 558, 419 (2006).
(27)
H. Bichsel,
Nucl. Instrum. Meth. A 562, 154 (2006).
(28)
A. M. Poskanzer and S. A. Voloshin,
Phys. Rev. C 58, 1671 (1998).
(29)
M. Miller and R. Snellings,
arXiv:nucl-ex/0312008.
(30)
J. Adams et al. [STAR Collaboration],
Phys. Rev. Lett. 92, 112301 (2004).
(31)
H. Sorge, H. Stoecker and W. Greiner,
Annals Phys. 192 (1989) 266;
H. Sorge,
Phys. Rev. C 52, 3291 (1995).
(32)
Y. Lu et al.,
J. Phys. G 32, 1121 (2006).
(33)
P. Sorensen [STAR Collaboration],
J. Phys. G 30, S217 (2004).
(34)
A. Adare [PHENIX Collaboration],
arXiv:nucl-ex/0608033.
(35)
V. Greco and C. M. Ko,
Phys. Rev. C 70, 024901 (2004);
X. Dong, S. Esumi, P. Sorensen, N. Xu and Z. Xu,
Phys. Lett. B 597, 328 (2004).
(36)
S. Manly et al. [PHOBOS Collaboration],
Nucl. Phys. A 774, 523 (2006).
(37)
P. F. Kolb,
Phys. Rev. C 68, 031902 (2003).
(38)
N. Borghini and J. Y. Ollitrault,
Phys. Lett. B 642, 227 (2006).
(39)
L. W. Chen, C. M. Ko and Z. W. Lin,
Phys. Rev. C 69, 031901 (2004);
P. F. Kolb, L. W. Chen, V. Greco and C. M. Ko,
Phys. Rev. C 69, 051901 (2004);
P. Sorensen,
Acta Phys. Hung. A 24, 221 (2005).
(40)
J. Adams et al. [STAR Collaboration],
Phys. Rev. Lett. 92, 062301 (2004).
(41) We note that we are comparing
for data sets with very different yield
ratios and in this paper we have shown that the
is smaller than the .
(42)
S. S. Adler et al. [PHENIX Collaboration],
Phys. Rev. Lett. 94, 232302 (2005).
(43)
B. B. Back et al. [PHOBOS Collaboration],
Phys. Rev. Lett. 94, 122303 (2005).