\runtitle fluctuations \runauthorP. Sorensen
Elliptic flow fluctuations in Au+Au collisions at GeV
Abstract
Please note that after these results were reported at Quark Matter
2006 and posted on the preprint server it was found that what is
reported here as elliptic flow fluctuations, should rather
be taken as an upper limit on the fluctuations. Further analysis has
shown that fitting the multiplicity dependence of the q-distribution
does not enable one to disentangle non-flow and fluctuations. The
data from the q-vector distrubution does not, therefore, exclude the
case of zero fluctuations. The remainder of these proceedings we
leave as they were originally reported.
We report first
measurements of elliptic flow () fluctuations for the STAR
collaboration at middle rapidity in GeV
Au+Au collisions. We analyze the multiplicity dependence of the
flow vector length distribution to disentangle non-flow
correlations from fluctuations. We find that the width of
the distribution is approximately 36% of the mean
and, within errors, independent of collision centrality. This
value coincides with eccentricity fluctuations, apparently leaving
little room for other sources of fluctuations.
Introduction: A primary goal of the RHIC program is to collide heavy-ions to create a quark-gluon plasma (QGP) and study its properties. Measurements of the azimuthal anisotropy of particle production with respect to the reaction plane (i.e. ) [1] seem to indicate that the matter created in collisions at RHIC behaves as a perfect fluid with a viscosity near a conjectured lower bound [2]. This conclusion is based primarily on comparisons to hydrodynamic model predictions [3, 1]. Uncertainty about the conditions at the beginning of the hydrodynamic expansion, however, make the conclusion that the matter created at RHIC has a viscosity near the conjectured lower bound ambiguous [4]. Since reflects the initial spatial eccentricity of the overlap region when two nuclei collide, fluctuations of should reflect fluctuations in the initial eccentricity. As such, fluctuations may provide sensitivity to the initial conditions and help determine the viscosity and other properties of the matter created in heavy-ion collisions.
Analysis method: The harmonic reduced flow vector is defined as and , where is the number of tracks and is the azimuth angle of a track with respect to the reaction plane [5]. When enough tracks are used in the calculation of , the central-limit-theorem (CLT) ensures that its distribution will be a two-dimensional Gaussian shifted by in the x direction with widths:
| (1) |
represents the broadening of the distribution that arises from non-flow correlations [5]. The exact direction of the reaction plane is not known, so we calculate the magnitude of the flow vector . If does not fluctuate, the distribution of should be given by:
| (2) |
where is the gamma function and are modified Bessel’s functions. Here we consider the case. If fluctuates from event to event, the final distribution will have the form: , where is the probability for an event to have a given . Zero fluctuations corresponds to where is the Dirac delta function. In our analysis we assume a Gaussian shape for the distribution: , and extract the r.m.s. () of the distribution from fits to data. Different assumed shapes change the r.m.s. by at most 15% (relative).
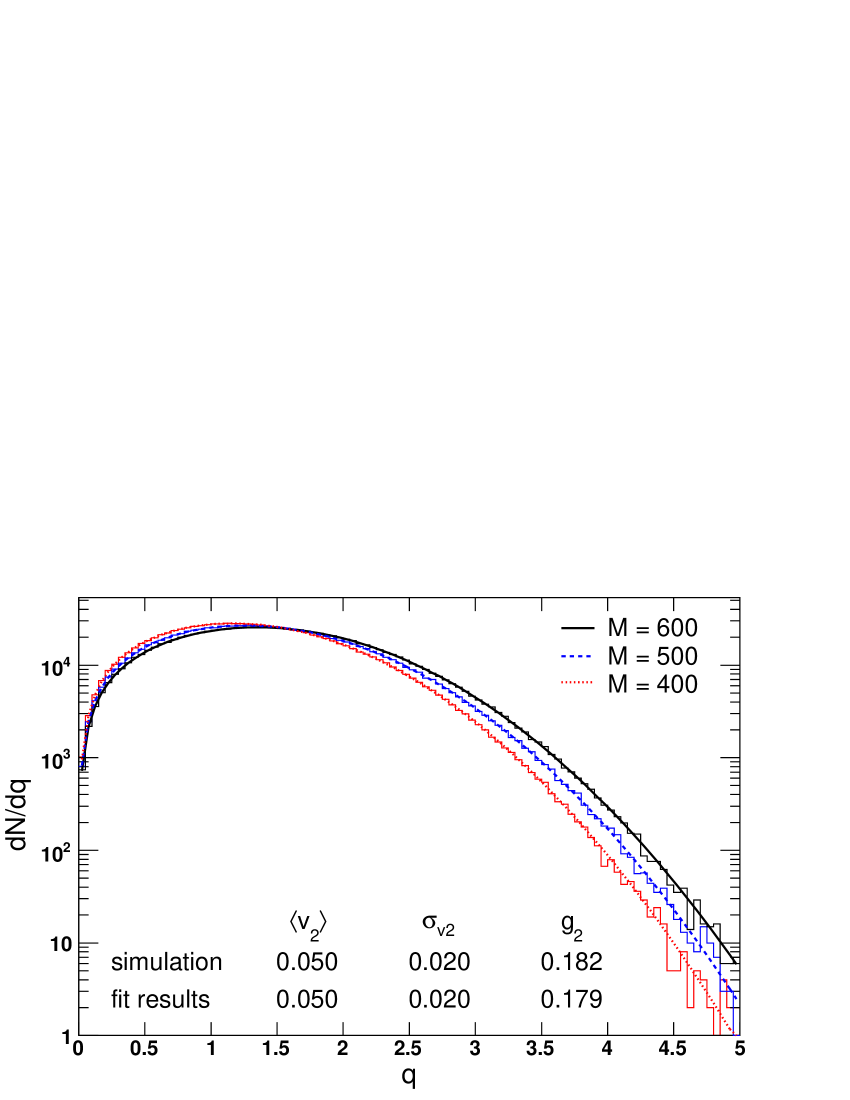
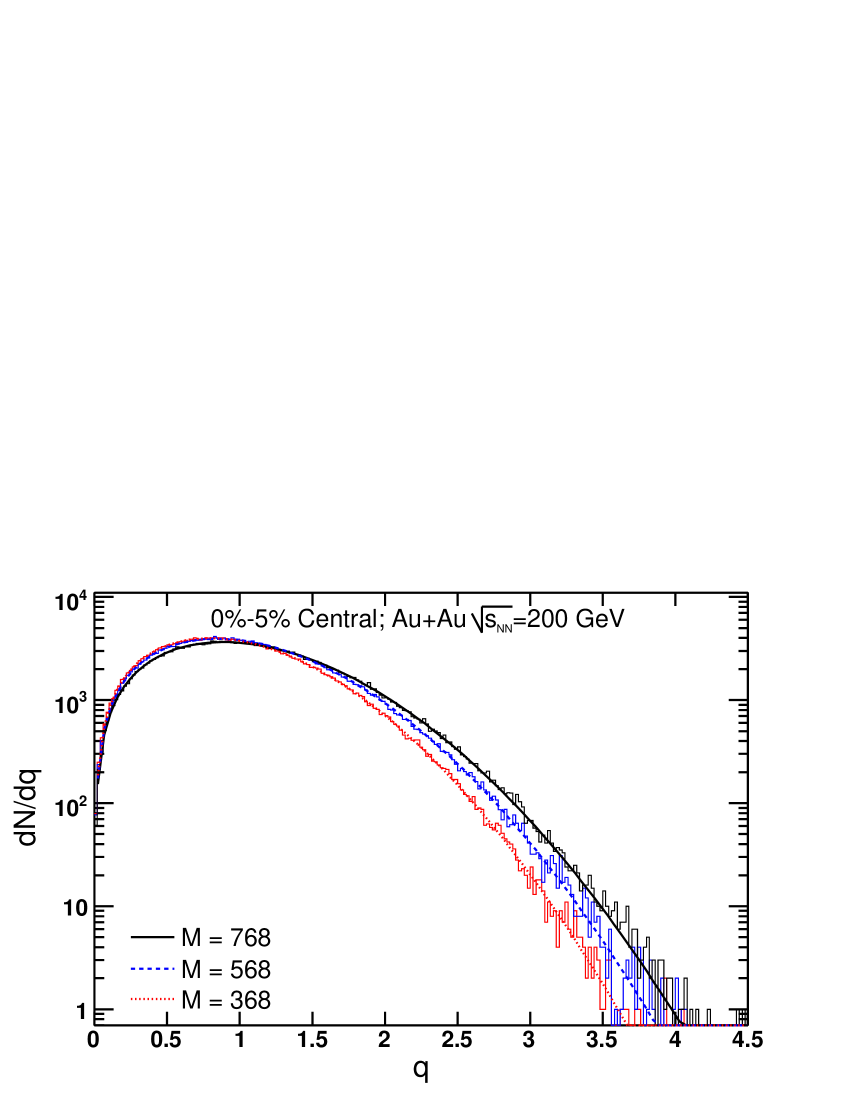
Non-flow and fluctuations both broaden the width of the observed distribution. This ambiguity is removed by using different numbers of tracks to calculate . Since the shift of the distribution scales with , the broadening of the distribution from fluctuations will scale with . We randomly discard tracks within an event class to calculate with reduced multiplicities. Then we fit the different distributions simultaneously to determine , , and . Typical fits are shown in Fig. 1 for simulated data (left) and for real data (right). Best fit values agree well with the input parameters of the simulation. For our data analysis we use 15 million Au+Au collisions at GeV measured with the STAR detector [6].
Eccentricity (standard and participant), impact parameter , , and multiplicity are calculated from a Monte-Carlo Glauber model [7] tuned to reproduce the multiplicity distribution of 200 GeV Au+Au collisions. We also use the model to subtract impact parameter fluctuations. The we present represents the width of the distribution at fixed . The correction is carried out according to , where is extracted from the difference between the width of the distribution when is allowed to fluctuate and when it is fixed.
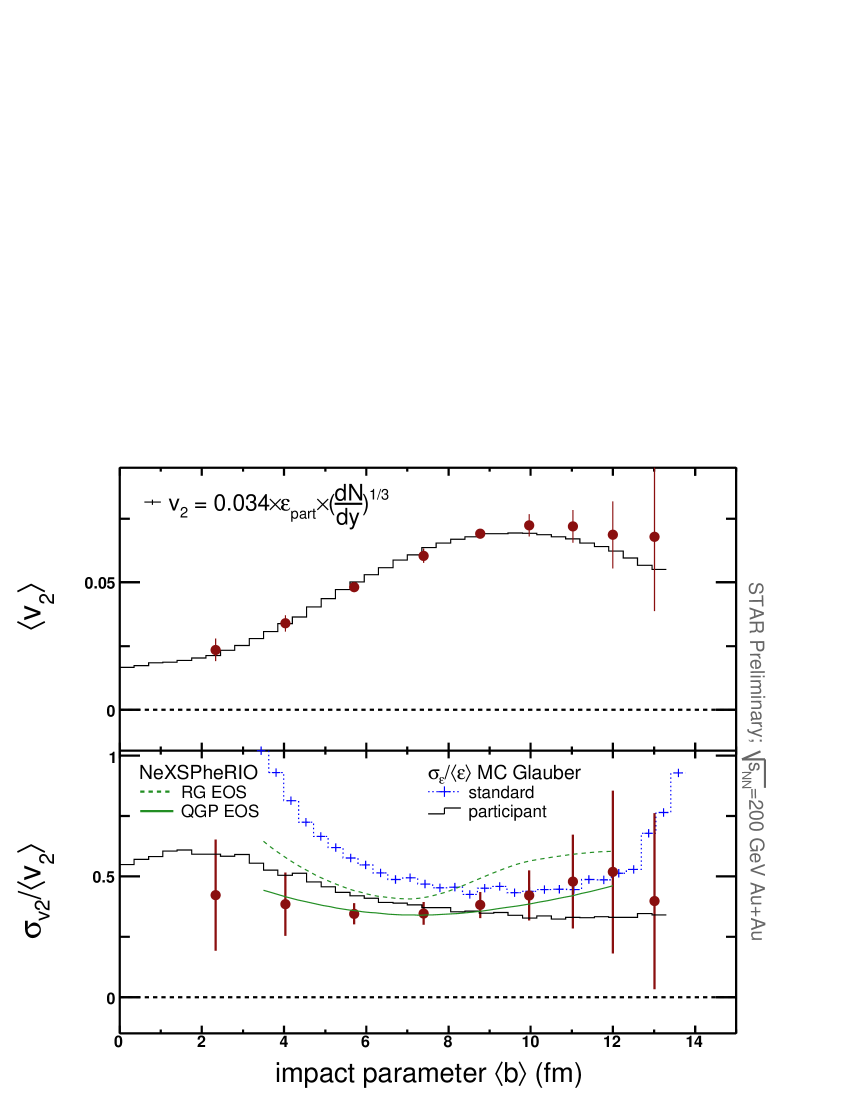
Results: The from our fits are shown versus in the top panel of Fig. 2 (left). Measuring fluctuations allows us to remove the major source of systematic uncertainty for [7, 9]. projects to zero for [8] giving us confidence that our measurements are sensitive to the participant axis (a coordinate system which can fluctuate to a different angle than the reaction plane [10]). We also note that as would be expected from hydrodynamic models [3]. The top panel of Fig. 2 (right) shows versus compared to a phenomenological model which is closely related to versus plots [11]. Our data are consistent with this model.
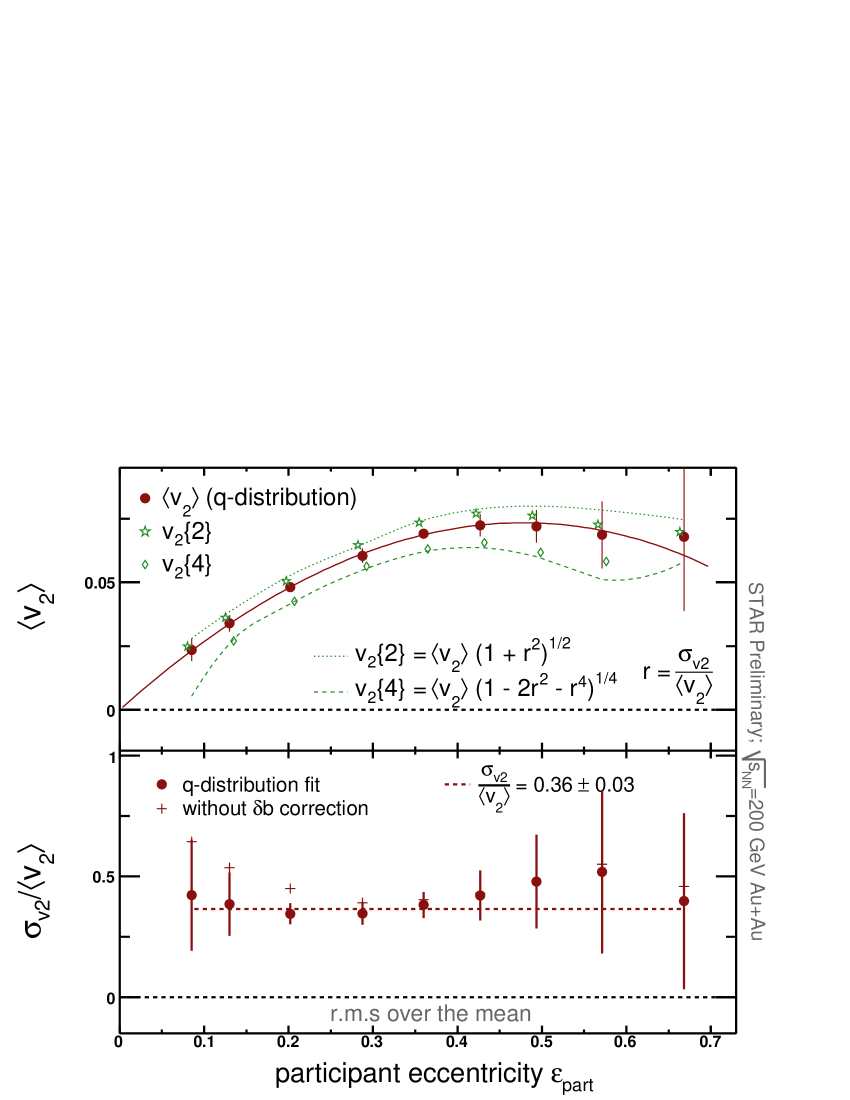
The r.m.s. width over the mean of () is shown in the bottom panels of Fig. 2. is corrected for fluctuations so that the measurements represent the width of the distribution for a fixed impact parameter value. is approximately and within errors independent of centrality. In the top left panel, we also show a comparison of the and values from this analysis to from 2- and 4-particle cumulant analyses ( and ) [1, 7]. The curves derived from the measured and agree with the previously measured and . The comparison shows that the differences between and can be explained by fluctuations without invoking non-flow suggesting that any effects from non-flow on the integrated are less important. This is not necessarily true, however, at higher where the ratio of decreases with . This decrease is likely related to an increase in non-flow correlations from hard processes at high .
In the bottom right panel of Fig. 2 we compare to nucleon Monte-Carlo Glauber calculations of where the eccentricity has been calculated with respect to the reaction plane (standard) or the participant axis (participant). The calculations can be excluded by data, demonstrating that our measurements are sensitive to the initial conditions. The relative widths of the and distributions are consistent. This leaves little room for other sources of fluctuations and suggests that the conversion of to is identically efficient for every event. This conclusion is contradicted however by the variation of with . This contradiction may indicate that the fluctuations are overestimated in the Monte-Carlo Glauber model or that other sources of fluctuation are small compared to the eccentricity fluctuations. In principle, different treatments of the initial conditions can yield different predictions for the . For example, calculations of the eccentricity based on Colored Glass Condensate (CGC) yield eccentricity values approximately 30% larger than a Glauber model [4]. If the geometric fluctuations in the CGC calculation are the same as for the Glauber model, then the ratio will be 30% smaller. This would allow room for other sources of fluctuations, consistent with the observation that is not constant.
Hydrodynamic model calculations with fluctuating initial conditions [12] are also consistent with our data when a QGP EOS is used. The use of a resonance gas EOS seems to increase the ratio of the rms over the mean above the observed fluctuations. This indicates that although we have sought an observable that is sensitive to the initial conditions, we may learn about the later evolution as well and may even be sensitivity to the EOS.
Conclusions: We’ve disentangled non-flow and fluctuations and extracted and versus centrality for Au+Au collisions at 200 GeV. is and within errors independent of centrality. These measurements significantly improve the accuracy of , are consistent with 2- and 4-particle cumulant measurements and demonstrate sensitivity to the initial conditions. Future work will focus on the system-size dependence, energy dependence, and covariance of for different sub-events (e.g. partitioned according to pseudo-rapidity and ).
References
- [1] K. H. Ackermann et al. [STAR Collaboration], Phys. Rev. Lett. 86, 402 (2001); C. Adler et al. [STAR Collaboration], Phys. Rev. Lett. 89, 132301 (2002); J. Adams et al. [STAR Collaboration], Phys. Rev. Lett. 92, 052302 (2004); J. Adams et al. [STAR Collaboration], Phys. Rev. C 72, 014904 (2005); J. Adams et al. [STAR Collaboration], Phys. Rev. Lett. 95, 122301 (2005); K. Adcox et al. [PHENIX Collaboration], Nucl. Phys. A 757, 184 (2005); J. Adams et al. [STAR Collaboration], Nucl. Phys. A 757, 102 (2005).
- [2] P. Kovtun, D. T. Son and A. O. Starinets, Phys. Rev. Lett. 94, 111601 (2005).
- [3] P. Huovinen, P. F. Kolb, U. W. Heinz, P. V. Ruuskanen and S. A. Voloshin, Phys. Lett. B 503, 58 (2001); D. Teaney, Phys. Rev. C 68, 034913 (2003).
- [4] T. Hirano, U. W. Heinz, D. Kharzeev, R. Lacey and Y. Nara, Phys. Lett. B 636, 299 (2006); T. Lappi and R. Venugopalan, Phys. Rev. C 74, 054905 (2006); H. J. Drescher and Y. Nara, arXiv:nucl-th/0611017.
- [5] J. Y. Ollitrault, arXiv:nucl-ex/9711003; A. M. Poskanzer and S. A. Voloshin, Phys. Rev. C 58, 1671 (1998); N. Borghini, P. M. Dinh and J. Y. Ollitrault, Phys. Rev. C 63, 054906 (2001).
- [6] STAR Collaboration, C. Adler et al., Nucl. Instr. Meth. A 499, 624 (2003).
- [7] M. Miller and R. Snellings, arXiv:nucl-ex/0312008.
- [8] But not necessarily for (Fig. 2, top right).
- [9] X. l. J. Zhu, M. Bleicher and H. Stoecker, Phys. Rev. C 72, 064911 (2005); R. Andrade, F. Grassi, Y. Hama, T. Kodama and O. J. Socolowski, arXiv:nucl-th/0608067.
- [10] S. Manly et al. [PHOBOS Collaboration], Nucl. Phys. A 774, 523 (2006); R. S. Bhalerao and J. Y. Ollitrault, Phys. Lett. B 641, 260 (2006).
- [11] C. Alt et al. [NA49 Collaboration], Phys. Rev. C 68, 034903 (2003); S. A. Voloshin [STAR Collaboration], AIP Conf. Proc. 870, 691 (2006).
- [12] T. Osada, C. E. Aguiar, Y. Hama and T. Kodama, arXiv:nucl-th/0102011; C. E. Aguiar, Y. Hama, T. Kodama and T. Osada, Nucl. Phys. A 698, 639 (2002).