EUROPEAN LABORATORY FOR PARTICLE PHYSICS
CERN–PH–EP / 2006-018
July 6, 2006
J/ and production and their normal nuclear absorption in proton-nucleus collisions at 400 GeV
NA50 Collaboration
B. Alessandro10, C. Alexa3, R. Arnaldi10, M. Atayan12, S. Beolè10, V. Boldea3, P. Bordalo6,a, G. Borges6, J. Castor2, B. Chaurand9, B. Cheynis11, E. Chiavassa10, C. Cicalò4, M.P. Comets8, S. Constantinescu3, P. Cortese1, A. De Falco4, N. De Marco10, G. Dellacasa1, A. Devaux2, S. Dita3, J. Fargeix2, P. Force2, M. Gallio10, C. Gerschel8, P. Giubellino10, M.B. Golubeva7, A. Grigoryan12, J.Y. Grossiord11, F.F. Guber7, A. Guichard11, H. Gulkanyan12, M. Idzik10,b, D. Jouan8, T.L. Karavicheva7, L. Kluberg9, A.B. Kurepin7, Y. Le Bornec8, C. Lourenço5, M. Mac Cormick8, A. Marzari-Chiesa10, M. Masera10, A. Masoni4, M. Monteno10, A. Musso10, P. Petiau9, A. Piccotti10, J.R. Pizzi11,d, F. Prino10, G. Puddu4, C. Quintans6, L. Ramello1, S. Ramos6,a, L. Riccati10, H. Santos6, P. Saturnini2, E. Scomparin10, S. Serci4, R. Shahoyan6,c, M. Sitta1, P. Sonderegger5,a, X. Tarrago8, N.S. Topilskaya7, G.L. Usai4, E. Vercellin10, L. Villatte8, N. Willis8
Abstract
We report a new measurement of J/, and Drell-Yan cross-sections, in the kinematical domain and , performed at the CERN-SPS using 400 GeV/c incident protons on Be, Al, Cu, Ag, W and Pb targets. The dependence of the charmonia production cross-sections on the size of the target nucleus allows to quantify the so-called normal nuclear absorption. In the framework of the Glauber model, this new measurement is combined with results previously obtained with the same apparatus, under different experimental conditions, and leads to a precise determination of the J/ and absorption cross-sections in the surrounding nuclear matter.
Accepted for publication in Euro. Phys. J. C.
Università del Piemonte Orientale, Alessandria and INFN-Torino, Italy
LPC, Univ. Blaise Pascal and CNRS-IN2P3, Aubière, France
IFA, Bucharest, Romania
Università di Cagliari/INFN, Cagliari, Italy
CERN, Geneva, Switzerland
LIP, Lisbon, Portugal
INR, Moscow, Russia
IPN, Univ. de Paris-Sud and CNRS-IN2P3, Orsay, France
LLR, Ecole Polytechnique and CNRS-IN2P3, Palaiseau, France
10 Università di Torino/INFN, Torino, Italy
11 IPN, Univ. Claude Bernard Lyon-I and CNRS-IN2P3, Villeurbanne, France
12 YerPhI, Yerevan, Armenia
a) also at IST, Universidade Técnica de Lisboa, Lisbon, Portugal
b) also at Faculty of Physics and Nuclear Techniques, AGH University of Science and Technology, Cracow, Poland
c) on leave of absence of YerPhI, Yerevan, Armenia
d) deceased
1 Introduction
Charmonium production in proton-nucleus collisions has already been extensively studied. Several fixed target experiments (NA3 [1], E772 [2], NA38 [3], E866 [4], E672/E706 [5] and NA50 [6, 7]) have studied J/ and production, including the nuclear dependence of their production cross-sections, in the energy range –40 GeV and as a function of several kinematical variables: Feynman (), rapidity () and transverse momentum (). These measurements have been analysed in view of understanding the physics mechanisms underlying charmonia production [8, 9].
The study of J/ production in proton-nucleus collisions is also crucial for a correct interpretation of the J/ suppression patterns experimentally observed in heavy-ion collisions, at the CERN/SPS [10], predicted 20 years ago to signal Quark Gluon Plasma formation [11]. It is, indeed, very important to establish a robust baseline on the basis of proton-nucleus data, the so-called “normal nuclear absorption”, with respect to which we can clearly identify new phenomena, specific of high-energy heavy-ion collisions.
This work reports new measurements on J/ and production from proton-nucleus data collected by the NA50 experiment with 400 GeV protons incident on various targets. Together with previous proton-nucleus results from the same experiment at 450 GeV, this new determination leads to a good characterization of the charmonia survival probability in “cold nuclear matter” and precisely reveals the differences between the two charmonium states, J/ and .
2 Experimental apparatus and data selection
The data samples analysed in this paper have been collected with the muon spectrometer used by the NA50 experiment since 1994, as described in [10]. The target region of the experiment, however, has been adapted to the use of six different target materials, sequentially exposed to the beam in relatively short time intervals, as shortly summarized hereafter.
The six different targets chosen for these measurements were made of Be, Al, Cu, Ag, W and Pb, so as to cover a wide range of nuclear sizes. They were disks of 12 mm diameter, much larger than the proton beam spot of 500 m r.m.s., ensuring that no incoming proton misses the target transverse area. Their thicknesses () were chosen in order to yield event samples of similar statistics for each target species, in data collection periods (“runs”) of around 1–2 hours each, while avoiding too thick targets (more than 13 cm or 40 % of an interaction length), which could degrade the measurements. Table 1 summarizes some target properties, the numbers in parentheses giving the relative errors associated with each quantity. The target densities, , were measured, while the interaction lengths, , were computed using the cross-sections published in [12]. The target effective length is defined as .
| (cm) | (g/cm3) | (g/cm2) | (g/cm2) | / | ||
|---|---|---|---|---|---|---|
| Be | 9.012 | 13.0 | 1.845 (0.5 %) | 80.0 (1.3 %) | 20.7 (0.5 %) | 0.26 |
| Al | 26.982 | 12.0 | 2.695 (0.5 %) | 108.9 (0.5 %) | 28.0 (0.4 %) | 0.26 |
| Cu | 63.546 | 7.5 | 8.92 (0.5 %) | 138.6 (0.4 %) | 53.1 (0.4 %) | 0.38 |
| Ag | 107.868 | 7.5 | 10.489 (0.5 %) | 160.9 (0.7 %) | 62.2 (0.4 %) | 0.39 |
| W | 183.84 | 4.5 | 19.21 (0.5 %) | 186.9 (1.0 %) | 69.2 (0.4 %) | 0.37 |
| Pb | 207.2 | 6.7 | 11.26 (0.8 %) | 193.3 (1.1 %) | 62.5 (0.7 %) | 0.32 |
A remotely operated rotating target holder placed each different target in the beam sequentially, with a target change every hour or so. This feature allowed us to balance time-dependent effects among different exposures, reducing to a negligible level the systematic uncertainties related to beam characteristics.
The hadron absorber separating the target region from the muon spectrometer was made of 60 cm of Al2O3, followed by 400 cm of carbon and 80 cm of iron. The overall beam time allocated to the measurements reported in this paper was only 4 days, forcing us to run with a high intensity proton beam (3– protons per 3.2 s burst). Nevertheless, the data acquisition worked with average lifetimes between 99 % and 96 %, depending on the specific trigger rate of each target exposure. The time stability of the targeting efficiency was continuously monitored by three scintillator telescopes pointing to the target, with axes orientation at 90∘ relative to the beam line, one vertical and two horizontal. The intensity of the incident proton beam was redundantly measured, for continuous cross-checking purposes, by three independent ionization chambers placed upstream of the target, with a sensitive transverse size which ensured that they intercepted all the incoming beam. The ionization current is integrated during every burst and the total collected charge is proportional to the number of crossing protons. These detectors have been precisely calibrated in a dedicated low intensity data collection using a coincidence of two scintillators equipped with very fast electronics. Their linearity was checked up to the highest beam intensity used in the experiment and a 3% systematic uncertainty on the number of incident protons has been estimated [13].
Two measurements of the dimuon trigger efficiency, made in dedicated runs at the beginning and middle of the data taking period, gave () % and () %, respectively. From the study of several different observables as a function of time, a 2.3 % systematic error has been deduced.
The reconstruction efficiency depends on the occupancy of the spectrometer Multi Wire Proportional Chambers which is a function of the luminosity of each exposure (target length and beam intensity). It was determined, with its corresponding error, from the individual efficiencies of each of the two sets of 12 wire planes detecting uncurved tracks, upstream and downstream from the magnet, and cross-checked with a Monte-Carlo study in which generated dimuons embedded into real events are processed through the same reconstruction algorithm as applied to real data [14]. The final absolute experimental values vary between 77% and 84%, with a 0.2% systematic uncertainty, depending on the individual short time exposure.
The dimuon events are selected according to the standard quality criterium used in NA50, mostly driven by geometrical arguments. In particular, each single muon must cross the air core toroidal magnet (ACM) of the spectrometer in one of the six air-sectors, and it must point to the target. The latter condition is assured by a cut on the variable, where is the momentum of the muon and is the transverse distance, in the plane containing the centre of the target, between the beam line and the intercept of the extrapolated muon track. Phase space regions where the acceptance is less than 10 % of its maximum value are removed by applying the following kinematical cuts: and , where is the dimuon center of mass rapidity and is the polar angle in the Collins-Soper frame.
A small fraction of dimuons from collisions upstream or downstream of the target survives the selection criteria. They are estimated from data samples collected with no target in place, after proper normalisation to the luminosity integrated in the standard runs. The contribution of such spurious dimuons in the mass region GeV/ is less than 3 % for the lightest target and less than 1 % for the heaviest one. In spite of their small number, they must be carefully taken into account because the reconstruction program assumes that these dimuons are produced in the target and, therefore, their reconstructed invariant mass is shifted to regions where they may contribute more significantly to the total number of events (in particular at around 2.8 GeV/, as seen in Fig. 1 below).
| Data set | |||
|---|---|---|---|
| () | (2.7–3.5) | ||
| p-Be | 6.355 | 0.736 | 38 627 |
| p-Al | 6.522 | 0.719 | 48 614 |
| p-Cu | 3.496 | 0.686 | 44 984 |
| p-Ag | 2.979 | 0.680 | 41 560 |
| p-W | 3.380 | 0.681 | 49 476 |
| p-Pb | 5.258 | 0.691 | 69 388 |
Table 2 presents, for each data sample, the total number of incident protons, the average efficiency (affected by a 2.3 % systematic uncertainty), and the number of reconstructed opposite-sign muon pairs in the mass region GeV/ after the selection cuts.
3 Data analysis
The opposite-sign muon pair invariant mass distributions are analysed as a superposition of several contributions. For masses lower than 2 GeV/, the mass spectrum is dominated by uncorrelated decays of pions and kaons. This background can be estimated from the number of measured like-sign pairs, according to the standard formula:
where ACM and ACM denote the magnetic field polarities used to collect the events. This relation is valid if the probability to detect a muon in the apparatus (acceptance) is independent of its charge. An additional offline cut is therefore imposed which rejects events where one (or both) of the muon tracks would not be accepted if it had the opposite charge (or if the magnetic field had the opposite polarity). accounts for charge correlations. It tends to unity in events of very high charged track multiplicities, where such correlations can be neglected. In the case of our data samples, varies between 1.03 and 1.05, depending on the target, as estimated by fitting the mass region 1.5–2.3 GeV/, where the combinatorial background is dominant. These values are very close to unity because the beam intensities we have used are so high that it frequently happens that the two muons of a given triggered event come from a different p-A collision and are, therefore, uncorrelated.
For dimuon masses above 2.7 GeV/, the combinatorial background contributes less than 1 % of the total number of events. In this mass region the relevant contributions are Drell-Yan dimuons and the J/ and resonances. We have also taken into account the contribution from semimuonic decays of D meson pairs, although it is significantly smaller. Figure 1 shows the opposite-sign muon pair distribution collected in p-Pb collisions, compared to the superposition of the different contributions, with yields obtained through a multi-step fit procedure, explained below.

The J/, , Drell-Yan and open charm contribution shapes have been obtained by Monte-Carlo simulation, using a detailed description of the experimental setup and of the effects induced by multiple scattering, energy loss, trigger requirements, etc. The simulated events were reconstructed with the same programs as the real data and had to survive the same selection criteria.
The Drell-Yan and open charm contributions were generated with the Monte-Carlo event generator PYTHIA [15] (version 6.125) using the GRV 94 LO set of parton distribution functions [16] and a primordial Gaussian distribution, with width 0.8 GeV/ and 1.0 GeV/ for Drell-Yan and open charm, respectively [17].
The J/ and events were generated with a uniform distribution and with Gaussian rapidity distributions, of mean and width , common to all targets. These numerical values were obtained from the analysis of proton-nucleus data samples previously collected by NA50, at 450 GeV, with about 10–15 times higher statistics (the “HI 96/98” data sets, described in detail in Section 6). The distributions were generated according to a superposition of a thermal function in transverse mass, (good for low ), with a harder component, , to describe the high tail. The measured distributions were well described with values ranging from 266 MeV (for Be) to 288 MeV (for Pb) and a common GeV/ parameter. Figure 2 compares the measured and simulated and distributions, for dimuons in the mass region GeV/, where the J/ contributes more than 95 % of all events.

|

|
The dimuon mass distributions of the J/ and resonances, obtained separately for each target, are completely determined by experimental effects (multiple scattering and energy loss). Their mass shapes are extracted from a fit to the reconstructed Monte-Carlo events using a pseudo-Gaussian parameterization, i.e., a Gaussian function with a mass-dependent width which allows to properly describe the tails of the distorted peak. Given the very high statistics of the measured samples in the mass window of the resonances, even a small discrepancy between the simulated shapes and the measured data would significantly increase the fit and, thus, affect the fitting results. Therefore, the parameters of the function describing the widths and tails of the charmonia mass distributions are eventually left free and adjust on the observed real data (see details in Ref. [13]).
The Monte-Carlo simulation also provides the detection acceptances of each relevant physics process, as the ratio between reconstructed and generated events, in the kinematical domain mentioned above, which amount to 13.5 %, 16.2 % and 14.4 %, respectively for the J/, and Drell-Yan dimuons (in the mass window 2.9–4.5 GeV/). The Monte Carlo generation functions used to compute the charmonia acceptances were tuned in such a way that they describe the experimental data (see again Fig. 2). Since our final results have shown to be essentially insensitive to reasonable small changes of the Monte-Carlo distributions, no other systematic uncertainty has been assigned to the acceptance calculation apart from the one arising from the finite generated sample, reported in Table 5. The Drell-Yan acceptances change by 0.5–1.5% in the 2.9-4.5 GeV/c2 mass region, systematically for all targets, when computed using PYTHIA and different parameterizations of parton distribution functions.
The opposite-sign dimuon mass spectra were fitted, independently for each data sample, to the superposition of the contributions previously mentioned, in the mass region between 1.5 and 8.0 GeV/, using the maximum likelihood method. The combinatorial background and the empty target components were kept fixed, while the normalisations of the “signal contributions” (J/, , Drell-Yan and open charm) were left as free parameters. The systematic uncertainties in the extraction of the number of events were investigated fitting the mass spectra under different approaches, such as various descriptions of the mass range below 2.3 GeV/, changing the final fit mass range, checking the influence of reasonable parameterizations of J/ tails under the continuum, using different parton distribution functions for Drell-Yan generation, etc. From the previous study, we were able to select the best inputs for the fit procedure based on the stability of the results as well as on a /ndf criterium. However, the /ndf insensitiveness to the used parton distribution functions and to reasonable different tails of the J/ resonance led to somewhat arbitrary choices. As a consequence, systematic uncertainties due to these sources must be assigned to the measured number of events, as described in Section 4 and numerically presented in Table 5. The final adopted analysis procedure provides the best overall description of the experimental data. Table 3 reports the number of J/, and Drell-Yan events (with their statistical error) fitted from each data set, together with the corresponding /ndf values showing the good quality of the fits.
| Data set | /ndf | |||
|---|---|---|---|---|
| p-Be | 37509 204 | 786 38 | 756 43 | 0.75 |
| p-Al | 47341 229 | 1070 44 | 999 50 | 1.02 |
| p-Cu | 44224 220 | 849 40 | 1002 49 | 1.18 |
| p-Ag | 40738 212 | 784 40 | 1000 49 | 1.19 |
| p-W | 48570 232 | 835 43 | 1233 56 | 1.11 |
| p-Pb | 67958 275 | 1200 51 | 1644 64 | 1.01 |
4 Cross-sections results
The production cross-sections are derived from the fitted number of events, the integrated luminosity, the detection acceptances and from the different efficiencies affecting our measurement and analysis procedure, already discussed and presented in the previous sections.
Table 4 shows the resulting J/, and Drell-Yan production cross-sections, per target nucleon, in the phase space window of our measurement. The values for charmonia include the branching ratios of their decay into muons. The Drell-Yan production cross-sections presented in this table (given for the mass range 2.9–4.5 GeV/) have been multiplied by “isospin correction factors” [6] between 0.954 and 0.947. The isospin corrected cross-sections are equivalents to the ones that would have been measured if the target nuclei were made of protons only.
| / | / | / | |
|---|---|---|---|
| (nb/nucleon) | (pb/nucleon) | (pb/nucleon) | |
| p-Be | 4.717 0.026 (2.1%) | 82.3 4.0 (2.1%) | 86.4 5.0 (2.1%) |
| p-Al | 4.417 0.022 (2.1%) | 83.5 3.4 (2.1%) | 84.2 4.4 (2.1%) |
| p-Cu | 4.280 0.022 (2.1%) | 68.2 3.2 (2.7%) | 86.7 4.3 (2.2%) |
| p-Ag | 3.994 0.022 (2.1%) | 63.9 3.3 (2.1%) | 86.9 4.4 (2.1%) |
| p-W | 3.791 0.019 (2.1%) | 53.9 2.9 (2.5%) | 84.4 3.9 (2.1%) |
| p-Pb | 3.715 0.016 (2.1%) | 54.3 2.4 (2.6%) | 79.1 3.2 (2.2%) |
Since the data were collected with relatively frequent target changes, most time-dependent systematic effects (such as the ones affecting the beam intensity measurement) should be identical among the six data sets. With respect to the data samples previously collected by NA50, when each p-A system was studied in a different data taking period (often meaning different years), this running mode significantly reduces the systematic uncertainty in the determination of the nuclear dependences, where only the relative changes of the production yields, from target to target, are important. This is the reason why the systematic errors quoted in Table 4 only refer to uncertainties specific to each data set. These uncertainties may be separated in two different kinds of sources: the ones originated by the experimental setup performance ( 0.4–0.7 % from the target material properties; 0.2 % from the reconstruction efficiencies; 2.3 % from the dimuon trigger efficiency), and the ones related to the extraction of the physical yields, as described in the Section 3 (0.2 % “resp. 0.4 %” for the charmonia “resp. Drell-Yan” acceptance and 0.4–1.8 % “resp. 1 %” for “resp. Drell-Yan” due to the J/ high mass tail uncertainty). Still concerning the Drell-Yan yields, their low statistics do not allow us to choose which set of parton distribution functions better describes the experimental results. This gives rise to a -0.3% to +2.8 % uncertainty (including acceptance corrections), to be considered when comparing our results with those obtained from other data sets, and which affects systematically changes the results of each and every target in the same way.
Finally, the luminosity was computed from the integrated number of incident protons within the spectrometer lifetime (see Section 2 for details) and from the effective number of target particles per unit surface. The uncertainty on the number of incoming protons was estimated to be 3 % based on the systematic error of the latest calibration of the ionization chambers [13]. This value also affects all targets in the same way and was not included in Table 4. However, it must be taken into account when comparing these results with those obtained from data collected in previous years, in what concerns their absolute normalisation.
All the different sources specific to each of the targets are summarized in Table 5 and a detailed discussion can be found in Ref. [13].
| Sources | p-Be | p-Al | p-Cu | p-Ag | p-W | p-Pb |
| Experimental setup uncertainties | ||||||
| (%) | 2.3 | 2.3 | 2.3 | 2.3 | 2.3 | 2.3 |
| (%) | 0.2 | 0.2 | 0.2 | 0.2 | 0.2 | 0.1 |
| (%) | 0.5 | 0.4 | 0.4 | 0.4 | 0.5 | 0.7 |
| Yields uncertainties | ||||||
| (J/, ) (%) | 0.2 | 0.2 | 0.2 | 0.2 | 0.2 | 0.2 |
| (DY2.9-4.5) (%) | 0.4 | 0.4 | 0.4 | 0.4 | 0.4 | 0.4 |
| J/ high tail; J/ (%) | 0.1 | 0.1 | 0.1 | 0.1 | 0.1 | 0.1 |
| J/ high tail; (%) | 0.4 | 0.5 | 1.8 | 0.5 | 1.4 | 1.5 |
| J/ high tail; DY2.9-4.5 (%) | 0.2 | 0.3 | 0.8 | 0.2 | 0.4 | 0.4 |
Table 6 presents the ratios between the J/, and Drell-Yan production cross-sections. Their uncertainties are dominated by the statistical errors of the Drell-Yan and values.
| p-Be | 54.6 3.2 (0.5%) | 0.953 0.082 (0.5%) | 1.745 0.085 (0.6%) |
|---|---|---|---|
| p-Al | 52.5 2.8 (0.6%) | 0.991 0.076 (0.5%) | 1.889 0.078 (0.7%) |
| p-Cu | 49.3 2.5 (0.9%) | 0.786 0.063 (1.1%) | 1.593 0.076 (1.9%) |
| p-Ag | 46.0 2.4 (0.5%) | 0.735 0.061 (0.6%) | 1.599 0.084 (0.7%) |
| p-W | 44.9 2.1 (0.6%) | 0.639 0.052 (1.1%) | 1.422 0.076 (1.5%) |
| p-Pb | 47.0 1.9 (0.7%) | 0.687 0.047 (1.2%) | 1.461 0.064 (1.6%) |
5 Nuclear dependences
The main topic of this work is the study of the nuclear dependence of the J/ and production cross-sections. It is generally accepted that charmonia production, essentially due to gluon fusion, is a hard process and, therefore, is basically independent of the amount of nuclear matter surrounding the production point. This is also the case of high mass dimuon (Drell-Yan) production, where a linear scaling of the production cross-section with the target nucleus mass number, in p-A collisions, has been observed [2, 18]. This linearity is usually expressed by saying that is unity, where is the exponent in the power law (the “ parameterization”). It has been observed that decreases as a function of and increases as a function of (the “Cronin effect”). Since these changes affect Drell-Yan production (where no final state effects are expected), they are attributed to initial state effects: nuclear modifications of the parton distribution functions (shadowing, etc.) and energy loss of the incoming partons as they traverse the target nucleus [8]. Charmonia production, besides these initial state effects, is also sensitive to nuclear absorption of the produced bound state, before and after forming the final J/ or resonances, through strong interactions with the nuclear environment on their way out of the target nucleus.
The left panel of Fig. 3 shows the Drell-Yan production cross-section, per target nucleon, as a function of the target mass number, as extracted from our six data samples. The flat pattern confirms the linear scaling previously observed in several proton-nucleus experiments [2, 18], including NA50 [6], indicating that initial state effects play a negligible role in Drell-Yan production at our energies and in the NA50 phase space window (mid-rapidity). From the present analysis we extract . The right panel of Fig. 3 shows the corresponding results for the J/ and production cross-sections, which lead to values smaller than unity: and .

|

|
A much more accurate formalism to describe the observed charmonium production cross-sections is provided by the Glauber model [19]. Within this framework, a proton-nucleus or nucleus-nucleus interaction is considered as a set of independent interactions between the projectile and target nucleons, assuming that the properties of the nucleons do not change after the first collision and that they can interact further with the same cross-section. The basic input for the Glauber formalism in p-A collisions is the target nuclear thickness, , representing the number of nucleons per unit surface at impact parameter . The nuclear density profiles of light nuclei () were parameterized using the Fermi oscillator model. For the other nuclei we used Woods-Saxon distributions, with the parameters given in [20], except for the Ag nucleus, missing in those tables, for which we have used the parameterization of the FRITIOF 7.02 Monte Carlo code [21]. The data were then fitted with the expression
leaving as free parameters the normalisations, , and the interaction cross-sections of the J/ or on their way through the nuclear matter, .
The resulting fits to the J/ and production cross-sections are presented in Figs. 3 (right) and 4, respectively as a function of , the target mass number, and , the average distance of nuclear matter crossed by the charmonium states on their way out of the nucleus. The solid lines join together the results of the Glauber calculations, made independently for each individual target, while the dotted lines represent the error bands resulting from the uncertainties on the normalisations and absorption cross-sections.
The detailed Glaubel model formalism can be approximated, in first order, by the “ parameterization”,
where is the (approximate) absorption cross-section of the charmonia state and the density of the nuclear matter. is computed, for each target nucleus, in the framework of the Glauber model, as explained in [7]. The corresponding fits, shown in Fig. 4 as dashed lines, are almost indistinguishable from the full Glauber calculations, contrary to what happens with the parameterization, which significantly diverges from the correct calculation in the region of very light nuclei, as shown in Fig. 3 (right) and discussed in detail in [7, 14]. The results of the fits are collected in Table 7.

| fit | /ndf | ||
|---|---|---|---|
| J/ | 5.6 0.2 nb/nuc | 0.8 | |
| 123 q0 pb/nuc | 2.0 | ||
| Glauber fit | (mb) | /ndf | |
| J/ | 5.1 0.1 nb/nuc | 4.6 0.6 | 0.4 |
| 101 6 pb/nuc | 10.1 1.6 | 1.7 | |
| fit | (mb) | /ndf | |
| J/ | 5.0 0.1 nb/nuc | 4.1 0.5 | 0.3 |
| 99 5 pb/nuc | 8.21.0 | 1.5 | |
We see that the suffers a stronger nuclear absorption than the J/. However, the relative differences between the nuclear dependences of the two charmonium states can be studied with better accuracy through the ratio , shown in Fig. 5 as a function of (left) and (right). This ratio cancels out part of the systematic uncertainties, which affect both charmonium states in the same way.

|

|
Fitting these measurements as a function of the target mass number, with the parameterization, or as a function of , with the parameterization, we can directly obtain the parameters which characterize the relative nuclear dependences: and . It is not possible to directly extract with a Glauber fit. The corresponding results are collected in Table 8.
| fit | (%) | /ndf | |
|---|---|---|---|
| 1.9 | |||
| fit | (%) | (mb) | /ndf |
| 1.7 | |||
The nuclear absorption of the charmonium states can also be studied through the ratios of their production cross-sections with respect to the Drell-Yan cross-section, J/ / DY and / DY. Under the assumption (supported by existing results [2, 6]) that Drell-Yan production has negligible initial and final state effects, the values extracted from these ratios should be essentially identical to those obtained from the J/ and absolute production cross-sections. The rather low Drell-Yan statistics of the data samples collected in year 2000, however, do not allow us to make significant comparisons between the two approaches. For instance, the Glauber formalism applied to the J/ / DY ratios gives mb, while the absolute J/ cross-section analysis gives mb. Nevertheless, for completeness, we give the values extracted from the analysis of the J/ / DY and / DY ratios at the end of the next section (Table 13), together with the values extracted from the simultaneous analysis of all NA50 p-A data sets.
6 Comparison with previous NA50 p-A results
We will now compare the results shown in the previous sections with those obtained by NA50 using proton-nucleus data collected in previous years. For the purpose of this comparison, we will label the data sets analysed in detail in the present paper as “HI 2000” (given the “high intensity” of the proton beam and the year of data taking).
NA50 collected its first p-A data sets between 1996 and 1998, with a high intensity 450 GeV proton beam. Five different targets were used (Be, Al, Cu, Ag and W), each one during a period of around one week. These data samples, referred as “HI 96/98”, are the ones with the highest statistics (between 10 and 15 times higher than the data sets analysed in the present paper).
The high intensity beam induced high hit multiplicities in the wire chambers, which the standard offline reconstruction software used by NA50 in the first years had difficulties in handling properly. This motivated a significant upgrade of the reconstruction software, after which the data could be reconstructed with higher efficiency. The analysis details and results can be found in [7, 14].
In parallel, new p-A data samples were collected at a reduced beam intensity ( 1–5 protons per burst). The energy of the beam was 450 GeV and the targets used were the same as before. These data sets, referred hereafter as “LI 98/00”, have 20–30 % of the statistics of the previous ones. Two independent analyses were performed using these data, in slightly different kinematical windows, and the results have been published in [6, 7].
Given the improvements in the reconstruction software, the “HI 2000” data sets were collected at high beam intensities, even slightly higher than those of the “HI 96/98” samples. However, the short beam time available prevented the collection of sizeable statistics. On the other hand, the use of all the targets in the same data taking period significantly contributes to a decrease in the systematic uncertainties, when determining the nuclear dependences of the production cross-sections.
Given the slightly different analysis procedures used, the three data samples cannot be directly compared without first performing a few corrections. There are three main differences among the “HI 96/98”, “LI 98/00” and “HI 2000” data sets or analyses. First, the rapidity window considered for the extraction of the 450 GeV results is either or (we remind that the 400 GeV probe the range ). Second, the Drell-Yan calculations were done with different parton distribution functions: MRS G [22], MRS A (Low Q2) [23] and GRV 94 LO [16]. Third, the Monte Carlo simulations of the charmonium states used somewhat different and distributions.
For a coherent comparison of all the three data sets, we corrected the 450 GeV results to a common rapidity domain, , and also so that they correspond to the conditions used in the “HI 2000” analysis, as described in the previous sections of this paper: GRV 94 LO parton distribution functions and improved charmonia rapidity and distributions. These corrections, described in detail in [13], are rather small: 0.9 % (0.2 %) for the charmonia (Drell-Yan) window, between % and % for the Drell-Yan shape imposed by the different PDFs and 1 % for the charmonia kinematical distributions. Finally, the HI 96/98 Drell-Yan results were corrected by 6.91.6%, in order to account for their systematically lower normalisation with respect to the other data sets, as reported in [14].
The change in the function used to generate the rapidity distribution of the charmonium states is worth being explained in some detail. The analyses of the “HI 96/98” and “LI 98/00” data sets were done assuming that the J/ mesons were produced with a centre of mass rapidity distributed according to a Gaussian centred at mid-rapidity and with a r.m.s. of 0.75 [14] or 0.60 [24], independently of the target. After these analyses were published [6, 7], we tried to understand better the specific issue of the rapidity distributions, from a more detailed look at our measurements, despite the fact that our rapidity coverage is relatively narrow (only one unit in rapidity). Figure 6 shows the rapidity distributions (corrected for acceptance) of events in the mass range GeV/, from the “HI 96/98” (highest statistics) data sample. These distributions were fitted to Gaussians with free widths and either centred at mid-rapidity (, dashed lines) or with a free mean (solid lines). All the five different targets, from Be to W, systematically prefer a significantly negative mean value, , and a common width, , with reasonable fit quality, –3. On the contrary, forcing the distributions to be centered at mid-rapidity leads to a bad description of the measured data, with values between 18 and 51, depending on the target. The Monte Carlo simulation done in the present work (for the J/ and the ) used Gaussian rapidity distributions with mean and . Nevertheless, we have seen that the final results are essentially insensitive to reasonable changes in the rapidity distributions used for the event generation.
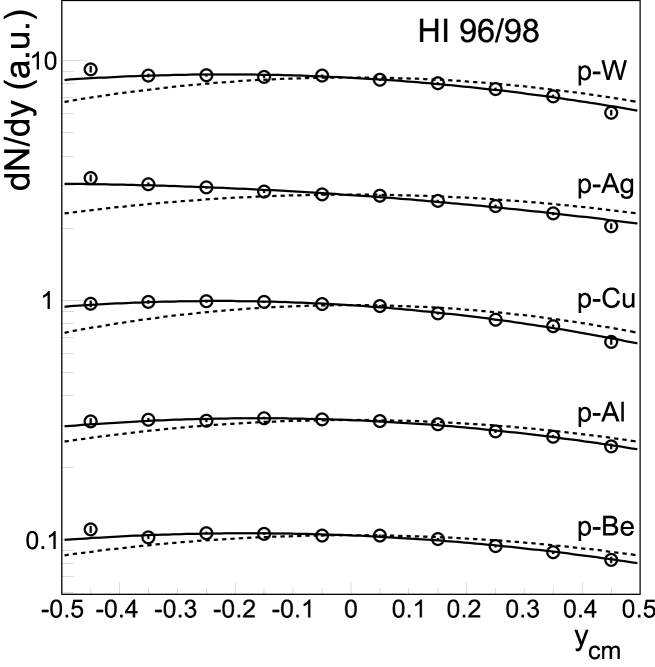
Table 9 compiles the “HI 96/98” and “LI 98/00” results, after the corrections just mentioned. The “LI 98/00” results shown here are the average of the two independent analyses mentioned above, since they are in agreement with each other, when compared in a coherent way.
| /A | /A | /A | ||||
| (nb/nucleon) | (pb/nucleon) | (pb/nucleon) | ||||
| HI 96/98 | LI 98/00 | HI 96/98 | LI 98/00 | HI 96/98 | LI 98/00 | |
| Be | 5.110.18 | 5.270.23 | 88.23.8 | 89.45.3 | 93.34.1 | 96.65.6 |
| Al | 4.880.23 | 5.140.21 | 84.34.6 | 88.04.8 | 96.15.0 | 104.05.9 |
| Cu | 4.740.18 | 4.970.22 | 77.73.4 | 82.14.9 | 101.34.6 | 97.36.8 |
| Ag | 4.450.15 | 4.520.20 | 69.82.7 | 72.84.3 | 94.33.7 | 100.45.3 |
| W | 4.050.15 | 4.170.37 | 61.72.6 | 66.37.9 | 92.74.0 | 96.38.9 |
Table 10 shows the results of each of the three data sets, independently, in what concerns the nuclear dependences of the J/ and production cross-sections, as determined using the detailed Glauber formalism. It also shows, in the last line, the results obtained from a simultaneous fit to the three data sets, with a common absorption cross-section, , and two different normalisations, accounting for the different energies and rapidity domains (we remind that the 400 GeV data is analysed in the window ). The “HI 2000” absolute cross-section systematic errors, affecting all targets in the same way, are not considered in the global fit, since the 400 GeV data has its own free normalisation.
| /ndf | /ndf | |||||
| (nb/nuc) | (mb) | (pb/nuc) | (mb) | |||
| HI 96/98 | 5.5 0.2 | 4.4 1.0 | 0.9 | 101 5 | 7.6 1.4 | 1.3 |
| LI 98/00 | 5.7 0.3 | 4.1 1.4 | 0.6 | 100 7 | 5.7 2.0 | 0.6 |
| HI 2000 | 5.1 0.1 | 4.6 0.6 | 0.4 | 101 6 | 10.1 1.6 | 1.7 |
| 450 GeV | 5.6 0.1 | 4.5 0.5 | 0.7 | 106 4 | 8.3 0.9 | 1.3 |
| 400 GeV | 5.1 0.1 | 95 4 |
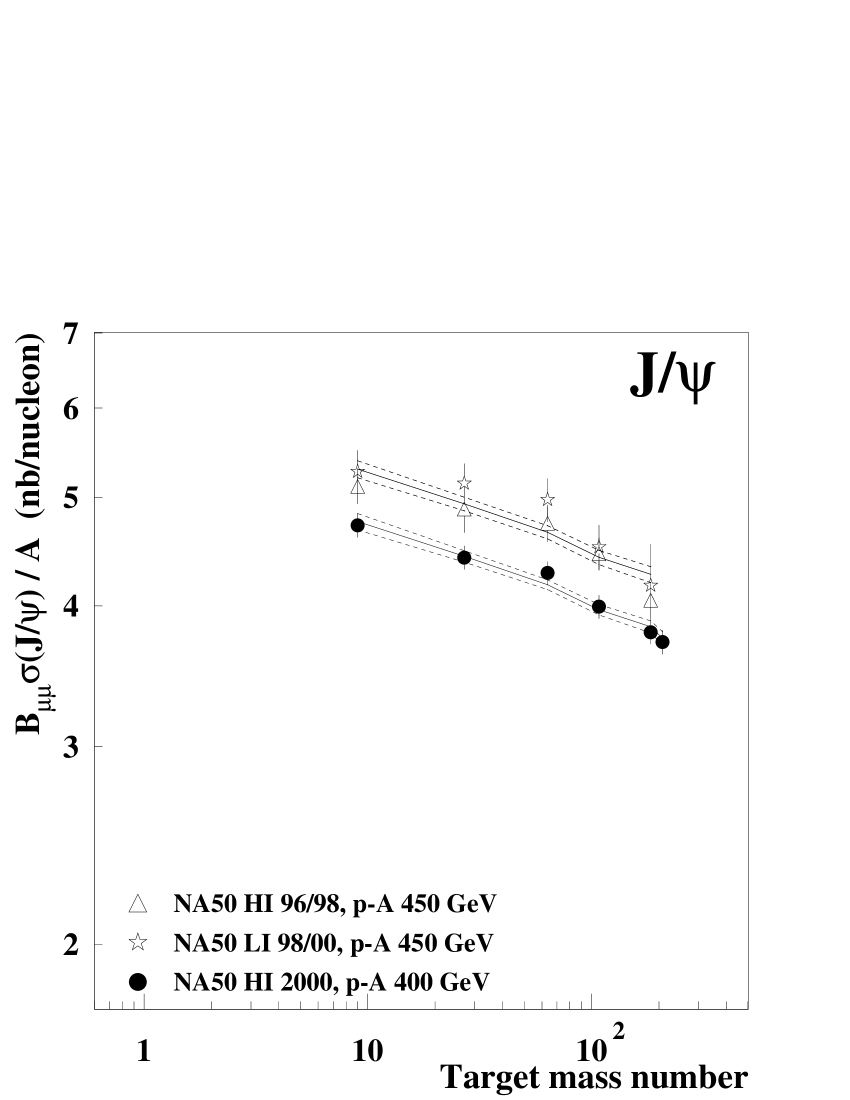
Figure 7 shows together all the J/ (left) and (right) absolute production cross-sections measured by NA50 in p-nucleus collisions, as collected in Tables 4 and 9. The curves are the result of the simultaneous Glauber fits to all the data points and the error bands represent the uncertainties in the absorption cross-section and in the normalisations (see Table 10 for the numerical values).
|

|
If instead of using the full Glauber calculation we use the approximate parameterization, does not change but the values are smaller, by 10 % for the J/ and by 15 % for the .
The parameterization is particularly useful to determine the relative absorption cross-section of the with respect to that of the J/, . In the same way, the parameterization is also used to quantify the relative charmonia absorption through the study of the parameter.
| /ndf | /ndf | |||||
|---|---|---|---|---|---|---|
| (%) | (mb) | (%) | ||||
| HI 96/98 | 1.830.06 | 2.60.6 | 0.5 | 1.950.09 | -0.0450.011 | 0.7 |
| LI 98/00 | 1.790.08 | 1.91.0 | 0.4 | 1.870.13 | -0.0320.017 | 0.5 |
| HI 2000 | 1.980.10 | 4.21.0 | 1.7 | 2.210.17 | -0.0760.018 | 1.9 |
| Global | 1.850.04 | 2.80.5 | 0.9 | 1.980.07 | -0.0480.008 | 1.0 |
Table 11 shows the and values independently obtained from each of the three data sets and also when we perform a simultaneous fit to all the data, assuming that the ratio between the and the J/ production cross-sections does not change from 400 to 450 GeV. We can see that the values given by the global fit, mb and , are essentially the same as the ones determined from the high statistics “HI 96/98” data set, on its own.
From the global fits leading to Table 10, we see that the ratio between the charmonia production cross-sections at 400 GeV, in the window, and at 450 GeV, in the window, is 0.90 (with a 3 % relative error bar). This value is in perfect agreement with the expectation of a NLO QCD calculation made in the Color Evaporation Model framework [25]. Using the “Schuler parameterization” [26], which provides a phenomenological description of J/ production cross-sections as a function of , we would expect , a value which includes the corresponding changes in the distributions and that is quite close to the result derived from our analysis.
As already briefly mentioned at the end of the previous section, it is interesting to study the J/ and nuclear dependences using the ratios of production cross-sections and . In what concerns the “HI 2000” data set, these values have already been presented in Table 6. The corresponding values for the two other data sets are collected in Table 12. They were obtained from the analyses described in the references [6, 7, 14] and corrected, where appropriate, as explained above.
| HI 96/98 | LI 98/00 | HI 96/98 | LI 98/00 | HI 96/98 | LI 98/00 | |
|---|---|---|---|---|---|---|
| Be | 54.71.5 | 54.61.8 | 0.9460.039 | 0.9320.051 | 1.730.05 | 1.700.07 |
| Al | 50.81.2 | 49.91.7 | 0.8760.030 | 0.8590.044 | 1.730.04 | 1.710.07 |
| Cu | 46.71.0 | 51.02.0 | 0.7680.024 | 0.8480.044 | 1.640.03 | 1.660.05 |
| Ag | 47.21.0 | 45.51.3 | 0.7400.021 | 0.7350.034 | 1.570.03 | 1.610.05 |
| W | 43.70.9 | 43.61.7 | 0.6660.020 | 0.6650.044 | 1.530.04 | 1.520.07 |
From the cross-section ratios of Tables 6 and 12 we can extract the nuclear absorption parameters, using the Glauber formalism, as we have done from the absolute cross-sections (in Table 10). The results are summarised in Table 13, where the last line shows the values resulting from a global fit to the three data sets. The derivation of the charmonia nuclear absorption parameters using the ratios of cross-sections, and , is very important to establish the “normal nuclear absorption curve” in heavy-ion collisions, where the suppression pattern of the J/ and resonances is determined, for each centrality bin, using the ratio of their production yields to the corresponding yield of Drell-Yan events.
| /ndf | /ndf | |||||
| (nb/nuc) | (mb) | (nb/nuc) | (mb) | |||
| HI 96/98 | 57.7 1.7 | 4.3 0.7 | 1.5 | 1.07 0.05 | 7.8 1.2 | 0.8 |
| LI 98/00 | 58.2 2.3 | 4.4 1.0 | 0.9 | 1.05 0.07 | 6.8 1.7 | 0.8 |
| HI 2000 | 57.2 3.4 | 3.4 1.2 | 0.4 | 1.14 0.11 | 8.8 2.3 | 0.9 |
| 450 GeV | 57.5 1.3 | 4.2 0.5 | 0.7 | 1.07 0.04 | 7.7 0.9 | 0.7 |
| 400 GeV | 59.3 1.8 | 1.09 0.05 |
It is important to note that the J/ absorption cross-section derived from the J/ / DY ratios, mb, is in excellent agreement with the value derived from the absolute production cross-sections, mb (Table 10). Also the values obtained in the two alternative approaches are in very good agreement, mb (Table 13) and mb (Table 10). When defining the normal nuclear absorption curve, as a function of centrality, in heavy-ion collisions, to compare with the J/ suppression pattern obtained in those collisions through the J/ / DY cross-section ratio, the value mb should be used, for consistency. This value is in agreement with previous published results [6, 27] but it should be noticed that when NA51 pp and pD charmonia measurements [28] were included in the Glauber fit [27], a 10% systematic error had to be added due to the different analysis techniques used in NA51 data. The inclusion of the pp and pD values in the Glauber fit has a strong influence on the derived value of and since a coherent analysis including NA51 points cannot be performed any more due to raw data unavailability, these results were excluded from the analysis reported here.
As a final remark, the energy and kinematical dependence was also investigated using other p-A production cross-sections, published by experiments with similar spectrometers: NA3 [1] and NA38 [3], at GeV. These values, fitted with the full Glauber model, lead to mb, which, within the present precision, is compatible with our present measurement. The inclusion of these points in the global Glauber fit using J/ cross-sections does not change the final value. Nevertheless, the energy dependence of the absorption cross-section remains, today, an open question.
7 Summary and conclusions
This paper presents the J/, and Drell-Yan production cross-sections in proton-nucleus collisions, as extracted from data collected by NA50 in year 2000, with 400 GeV protons and six different targets: Be, Al, Cu, Ag, W and Pb. The frequent rotation of the target material facing the beam significantly decreases the time-dependent systematic uncertainties related to beam stability, trigger system, etc. The accumulated statistics, however, suffers from the very short beam time available, which affects in particular the and Drell-Yan production results.
The nuclear dependence of the charmonium states production is studied, as a function of the target nucleus, with three different descriptions: the parameterization, the detailed Glauber formalism and its “” approximation. The J/ and absorption cross-sections obtained with the Glauber model, from the 400 GeV data sets, are: mb and mb.
A detailed comparison with previous NA50 p-A data samples, collected at 450 GeV with five different nuclear targets, shows that all data can be described with common absorption cross-sections. The “HI 2000” data set is particularly important in the determination of from the study of the absolute production cross-sections, given the lower systematic uncertainties on the beam normalisations. On the other hand, the two data sets previously collected by NA50 have more statistics and, therefore, lead to more accurate measurements of the and cross-section ratios, which are insensitive to the beam normalisation. Global fits to the cross-section values give: mb and mb. The corresponding results from the and cross-section ratios are in excellent agreement: mb and mb. The fact that the two alternative ways of deriving the charmonia absorption cross-sections, through absolute production cross-sections or through their ratios, are in such good agreement (furthermore, being mostly determined from different data sets), is an independent and accurate indication that, at our energies and in our kinematical phase space window, Drell-Yan production is not sensitive to nuclear effects, including initial state effects such as nuclear modifications of the quark distribution functions and energy loss of the incident nucleons. It would be interesting to see if a similar study made as a function of the dimuon or would modify this observation.
For consistency reasons, the values mb and mb should be used in the comparison with the cross-section ratios measured in heavy ion collisions. A significantly stronger absorption of the resonance with respect to the J/ is seen through the study of the relative production yields between the two charmonium states, in our phase space window.
The results presented in this paper were obtained assuming that final state nuclear absorption of the charmonium states, as calculated through detailed Glauber calculations with a single free parameter, , is the only nuclear effect influencing the production of these resonances in p-nucleus collisions. If future measurements (for instance, of open charm production cross-sections in p-nucleus collisions) demonstrate the existence of nuclear effects (such as anti-shadowing) on the gluon distribution functions at SPS energies, the numerical values given in this paper should be seen as effective values, resulting from the convolution of initial and final state nuclear effects.
Acknowledgements
This work was partially supported by the Fundação para a Ciência e a Tecnologia, Portugal.
References
- [1] J. Badier et al. (NA3 Coll.), Zeit. Phys. C20 (1983) 101.
- [2] D.M. Alde et al. (E772 Coll.), Phys. Rev. Lett. 66 (1991) 133.
-
[3]
M.C. Abreu et al. (NA38 Coll.),
Phys. Lett. B444 (1998) 516.
Phys. Lett. B446 (1999) 408. - [4] M.J. Leitch et al. (E866 Coll.), Phys. Rev. Lett. 84 (2000) 3256.
- [5] A. Gribushin et al. (E672/E706 Coll.), Phys. Rev. D62 (2000) 012001.
- [6] B. Alessandro et al. (NA50 Coll.), Phys. Lett. B553 (2003) 167.
- [7] B. Alessandro et al. (NA50 Coll.), Eur. Phys. J. C33 (2004) 31.
- [8] See, for example, R. Vogt, Phys. Rep. 310 (1999) 197 and references therein, and R. Vogt, Phys. Rev. C61 (2000) 035203.
- [9] N. Brambilla et al., Heavy Quarkonium Physics, CERN Yellow Report 2005-005, hep-ph/0412158
- [10] M.C. Abreu et al. (NA50 Coll.), Phys. Lett. B410 (1997) 327.
- [11] T. Matsui and H. Satz, Phys. Lett. B178 (1986) 416.
- [12] A.S. Carroll et al., Phys. Lett. B80 (1979) 319.
- [13] G. Borges, PhD Thesis, Instituto Superior Técnico, Lisbon, 2005; available at http://cern.ch/NA50/theses.html.
- [14] R. Shahoian, PhD Thesis, Instituto Superior Técnico, Lisbon, 2001; available at http://cern.ch/NA50/theses.html.
- [15] T. Sjöstrand, Comp. Phys. Comm. 82 (1994) 74.
- [16] M. Glück et al., Z. Phys. Rev. C67 (1995) 433.
- [17] L. Capelli, PhD Thesis, Université Claude Bernard, Lyon, 2001; available at http://cern.ch/NA50/theses.html.
- [18] D.M. Alde et al. (E772 Coll.), Phys. Rev. Lett. 64 (1990) 2479.
- [19] R.J. Glauber, Lectures in Theoretical Physics, NY, 1959, Vol. 1, 315.
-
[20]
C.W. De Jager et al., Atomic Data and Nuclear
Data Tables 14 (1974) 479.
H. De Vries et al., Atomic Data and Nuclear Data Tables 36 (1987) 495. -
[21]
B. Andersson, G. Gustafson and B. Nielson-Almquist,
Nucl. Phys. B281 (1987) 289.
B. Nielson-Almquist and E. Stenlund, Comp. Phys. Comm. 43 (1987) 387. - [22] A.D. Martin et al., Phys. Lett. B354 (1995) 155.
- [23] A.D. Martin et al., Phys. Rev. D51 (1995) 4756.
- [24] P. Cortese, PhD Thesis, Università Degli Studi Di Torino, Torino, 2000; available at http://cern.ch/NA50/theses.html.
- [25] R. Vogt and S. Frixione (editors), Heavy Flavour Physics, in CERN Yellow Report 2004-009, “Hard probes in heavy-ion collisions at the LHC”, 274–365.
- [26] G.A. Schuler, Habilitationsschrift, Univ. Hamburg, Germany, 1994, CERN-TH-7170-94, hep-ph/9403387.
- [27] B. Alessandro et al. (NA50 Coll.), Eur. Phys. J. C39 (2005) 335.
- [28] M.C Abreu et al. (NA51 Coll.), Phys. Lett. B38 (1998) 35.