The NA49 Collaboration
Centrality and system size dependence of multiplicity fluctuations
in nuclear collisions at GeV
Abstract
The centrality and system size dependence of multiplicity fluctuations of charged particles produced in nuclear collisions at GeV was studied by the NA49 collaboration. Centrality selected Pb+Pb collisions, semi-central C+C and Si+Si collisions as well as inelastic p+p interactions were analyzed. The number of projectile participants determined on an event-by-event basis was used to characterize the collision centrality. The scaled variance of the multiplicity distribution obtained in the forward rapidity region () shows a significant increase towards peripheral collisions. The results are similar for negatively and positively charged particles and about larger for all charged particles. String-hadronic models of nuclear reactions without the fusion process do not reproduce the rise of fluctuations from central towards peripheral collisions. The measured centrality dependence can be reproduced in superposition models with the assumption of contributions from target participants to particle production in the forward hemisphere or in string models with fusion.
.
I Introduction
Nucleus-nucleus collisions at relativistic energies have been intensely studied over the last two decades. The main goal of these efforts is to understand the properties of strongly interacting matter under extreme conditions of high energy and baryon densities for which the creation of a quark-gluon plasma (QGP) is expected Collins:1974ky ; Shuryak:1980tp . Various collision characteristics and their collision energy dependence suggest that a transient state of deconfined matter is created at collision energies as low as GeV Gazdzicki:2004ef . Fluctuations of physical observables in heavy ion collisions have been a topic of interest for some years as they may provide important signals regarding the formation of a QGP. With the large number of particles produced in heavy ion collisions at CERN SPS and BNL RHIC energies it has now become feasible to study fluctuations on an event-by-event basis Heiselberg:2000fk . In a thermodynamical picture of the strongly interacting system formed in the collision, the experimentally studied fluctuations of particle multiplicities Aggarwal:2001aa ; Afanasev:2000fu ; Roland:2004pu ; Adams:2003st ; Chai:2005fj , mean transverse momenta Anticic:2003fd ; Adamova:2003pz ; Adams:2003uw ; Adler:2003xq , and other global observables, are related to fundamental properties of the system, such as specific heat Stodolsky:1995ds ; Stephanov:1999zu , chemical potential, and matter compressibility Mrowczynski:1997kz . These, in turn, may reveal information on the properties of the equation of state near the QCD phase boundary Stephanov:1998dy ; Stephanov:1999zu ; Gazdzicki:2003bb .
The main objective of this work is to study how the multiplicity fluctuations change with the varying number of nucleons participating in the collision, with centrality and system size. First results on the centrality dependence in Pb+Pb collisions at GeV published by the WA98 collaboration Aggarwal:2001aa indicated that the scaled variance of the multiplicity distribution near midrapidity increases towards peripheral collisions. Our analysis extends such measurements to C and Si nuclei and carefully addresses the contribution from fluctuations of the number of participants which can dominate the fluctuations of extensive quantities such as the produced particle multiplicity. Furthermore an extensive comparison of the results to available models is performed. The data sample consists of centrality tagged minimum bias Pb+Pb, semi-central C+C and Si+Si as well as minimum bias p+p collisions registered by the NA49 detector at the CERN SPS. The multiplicity fluctuations were studied in the forward rapidity region (). The collision centrality was characterized by the number of projectile participants derived from the projectile spectator energy measured in a forward calorimeter. Selection of narrow intervals in this energy minimizes the variation of the number of projectile participants. Although the number of projectile and target participants are closely correlated, the number of target participants cannot be tightly constrained with this procedure. The implications of this problem will be discussed in detail.
The paper is organized as follows. In Sec. II the method of measuring multiplicity fluctuations is introduced and discussed. The NA49 set-up is presented in Sec. III. Experimental procedures, in particular event and particle selection, detector acceptance and centrality determination are discussed in Sec. IV. The results on centrality and system size dependence of multiplicity fluctuations are presented in Sec. V. In Sec. VI our results are compared with those of other experiments. Possible explanations of our results are discussed in Sec. VII. The paper closes with a summary and conclusions.
II Multiplicity fluctuations
II.1 Observables
Let be the multiplicity distribution, then
| (1) |
is the mean value of the distribution. The variance of the multiplicity distribution is defined as
| (2) |
Note, that for a Poisson distribution the variance equals the mean value, . Mean value and variance of multiplicity distributions are the only observables used in this analysis.
II.2 Participants and spectators
In a description of nuclear collisions the concept of participant and spectator nucleons is very useful. The participants are nucleons which are removed from the Fermi spheres of target or projectile nuclei due to the collision. The remaining nucleons are called spectators. In the case of central nucleus-nucleus collisions, where the impact parameter is relatively small, almost all nucleons participate in the collision. In particular, the number of projectile participants, , approximately equals the total number of projectile nucleons . If the collision is peripheral (with large impact parameter ) almost all nucleons are spectators, . The number of projectile spectators is given by .
II.3 Multiplicity fluctuations in superposition models
Superposition models of nuclear collisions, which are frequently used, assume that secondary particles are emitted by independent sources. A prominent example is the Wounded Nucleon Model Bialas:1976ed , in which the sources are wounded nucleons, i.e. the nucleons that have interacted at least once. In this model the number of participants would be equal to the number of wounded nucleons.
In superposition models the total multiplicity is given by
| (3) |
where denotes the number of sources and is the multiplicity of secondaries from the th source. When the sources are identical and independent from each other, the mean total multiplicity equals
| (4) |
where is the mean number of sources and is the mean multiplicity from a single source. The variance of the multiplicity distribution is
| (5) |
where and denote the variance of the distribution of single-source multiplicity and the variance of the distribution of source number, respectively.
The scaled variance of the multiplicity distribution is a useful measure of the multiplicity fluctuations. From Eqs. (4) and (5) one gets
| (6) |
Thus, in superposition models the measured scaled variance of the multiplicity distribution is the sum of two contributions. The first one describes the multiplicity fluctuations from a single source while the second one accounts for the fluctuations of the number of sources. To infer the fluctuations of main interest given by the first term in Eq. (6) we try to minimize the contribution of the second term. In this experiment events with a fixed number of projectile participants can be selected in which, however, the number of target participants can still fluctuate. The effect of the fluctuation of target participant number at fixed number of projectile participants was theoretically studied in Gazdzicki:2005rr . Multiplicity fluctuations are measured in a forward rapidity window in which one mainly expects particles produced from projectile participants. Nevertheless the effect of remaining fluctuations of the number of target participants can remain important, if participants produce particles over a wide rapidity range. We return to this point in Secs. IV.6 and VII.
III NA49 experimental set-up
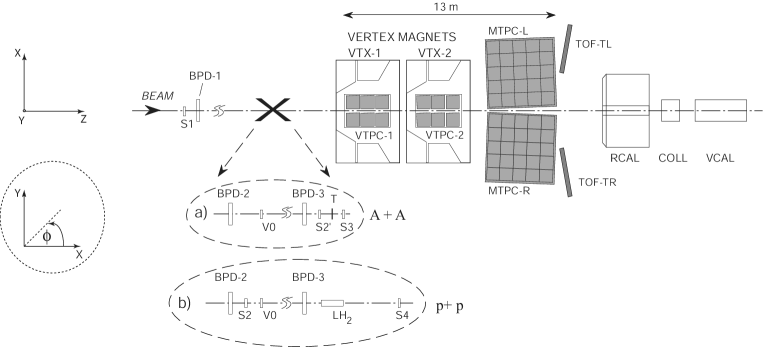
The NA49 experiment is a large acceptance hadron spectrometer at the CERN-SPS (see Fig. 1 and na49_nim ) used to study the final hadronic states produced in collisions of beam particles (Pb directly from the SPS, C and Si via fragmentation of the primary Pb beam, p as secondary beam from the 450 GeV proton beam in the SPS) with a variety of fixed targets. The main tracking devices are four large volume Time Projection Chambers (TPCs) which are capable of detecting 60% of some 1500 charged particles created in a central Pb+Pb collision at GeV. Two of them, the Vertex TPCs (VTPC-1 and VTPC-2), are located inside the magnetic field of two super-conducting dipole magnets ( and T, respectively) and two others (MTPC-L and MTPC-R) are positioned downstream of the magnets symmetrically to the beam line. The results presented here are analysed with a global tracking scheme na49_global , which combines track segments that belong to the same physical particle but were detected in different TPCs. The NA49 TPCs allow precise measurements of particle momenta with a resolution of (GeV/c)-1. The set–up is supplemented by two Time of Flight (TOF) detector arrays and a set of calorimeters.
The targets - C (561 mg/cm2), Si (1170 mg/cm2) discs and a Pb (224 mg/cm2) foil for ion collisions and a liquid hydrogen cylinder (length 20.29 cm) for elementary interactions - are positioned about 80 cm upstream from the VTPC-1.
Pb beam particles are identified by means of their charge as seen by a Helium Gas-Cherenkov counter (S2’) in front of the target. The protons were identified by Cherenkov counters farther upstream of the target. The study of C+C and Si+Si reactions is possible through the generation of a secondary fragmentation beam which is produced by a primary target (1 cm carbon) in the extracted Pb-beam. Setting the beam line momentum accordingly, a large fraction of all fragments are transported to the NA49 experiment. On-line selection based on a pulse height measurement in a scintillator beam counter (S2) is used to select particles with (C, N) and (Al, Si, P). Off-line clean-up is achieved by using in addition the energy loss measured by beam position detectors (BPD-1/2/3 in Fig. 1). These detectors consist of pairs of proportional chambers and are placed along the beam line for a precise measurement of the transverse positions of the incoming beam particles.
For p beams, interactions in the target are selected by anti-coincidence of the incoming beam particle with a small scintillation counter (S4) placed on the beam trajectory between the two vertex magnets. For p+p interactions at GeV this counter selects a (trigger) cross section of 28.23 mb out of 31.78 mb of the total inelastic cross section pp_inelastic . For Pb-ion beams an interaction trigger is provided by anti-coincidence with a Helium Gas-Cherenkov counter (S3) directly behind the target. The S3 counter is used to select minimum bias collisions by requiring a reduction of the Cherenkov signal by a factor of about 6. Since the Cherenkov signal is proportional to , this requirement ensures that the Pb projectile has interacted, with a minimal constraint on the type of interaction. This set-up limits the triggers on non-target interactions to rare beam-gas collisions, the fraction of which proved to be small after cuts, even in the case of peripheral Pb+Pb collisions.
The centrality of A+A collisions is selected by using information from a Veto Calorimeter (VCAL), which measures the energy of the projectile spectator nucleons. The geometrical acceptance of the Veto Calorimeter is adjusted in order to cover the projectile spectator region by a proper setting of the collimator (COLL).
Details of the NA49 detector set-up and performance of tracking software are described in na49_nim .
IV Data selection and analysis
IV.1 Data sets
Multiplicity fluctuations are studied for negatively, positively and all charged particles selecting events within narrow intervals of energy measured by the VCAL (predominantly energy of projectile spectators). The experimental material used for the analysis consists of samples of p+p, C+C, Si+Si and Pb+Pb collisions at GeV. The number of events in each sample is given in Tab. 1. For Pb+Pb interactions a minimum bias trigger was used allowing a study of centrality dependence.
| Data Set | No of events | |
|---|---|---|
| p+p | 319 000 | 0.9 |
| C+C | 51 000 | 0.153 |
| Si+Si | 59 000 | 0.122 |
| Pb+Pb | 165 000 | 0.6 |
IV.2 NA49 acceptance
The NA49 apparatus detects mainly the particles produced in the forward rapidity hemisphere. Fig. 2 shows the rapidity distribution of negatively charged particles in the NA49 acceptance calculated assuming that all particles are pions. This distribution is compared to an acceptance corrected rapidity distribution of negatively charged particles from Afanasiev:2002mx . As seen, the rapidity region where almost all particles are measured is .

The NA49 detector was designed for a large acceptance in the forward hemisphere. However, also in this region the geometrical acceptance is not complete. The acceptance limits in the transverse momentum and azimuthal angle were parameterized by a simple function
| (7) |
where the values of , and depend on the rapidity interval, see Anticic:2003fd . Only particles within the curves are used in this analysis. This well defined acceptance is essential for later comparison of the results with models and other experiments. Only forward rapidity tracks (, rapidity calculated assuming pion mass for all particles) with GeV/c have been used in this analysis.
IV.3 Event and particle selection
The aim of the event selection criteria is to reduce contamination from non-target collisions. The primary vertex was reconstructed by fitting the intersection point of the measured particle trajectories. Only events with a proper quality and position of the reconstructed vertex were accepted for further analysis. The vertex coordinate along the beam had to satisfy , where the nominal vertex position and cut parameter values are: and 5.5 cm, and 1.5 cm, and 0.8 cm, and 0.6 cm for p+p, C+C, Si+Si and Pb+Pb collisions, respectively. The vertex position in the transverse , coordinates had to agree with the incoming beam position as measured by the BPD detectors.
In order to reduce the contamination of particles from secondary interactions, weak decays and other sources of non-vertex tracks, several track cuts were applied. The accepted particles were required to have measured points in at least one of the Vertex TPCs. A cut on the extrapolated distance of closest approach to the fitted vertex of the particle at the vertex plane was applied ( cm and cm). Moreover the particle was accepted only when the potential number of points (calculated on the basis of the geometry of the track) in the detector exceeded 30. The ratio of the number of points on a track to the potential number of points had to be higher than 0.5 to avoid split tracks (double counting).
IV.4 Centrality selection
In order to reduce the effect of fluctuations in the number of participants (and thus of particle sources ), the multiplicity fluctuations were analyzed in narrow centrality bins defined by the energy measured in the VCAL. This procedure minimizes the variation of the number of projectile participants . Although the number of projectile and target participants are closely correlated, the number of target participants cannot be constrained with the NA49 detector. This leads to a remaining fluctuation in the total number of participants, i.e. particle sources .
For C+C and Si+Si interactions, three and five narrow centrality bins were selected respectively. In the case of Pb+Pb collisions, 58 narrow centrality bins were chosen. For each centrality bin the number of projectile participants was estimated by
| (8) |
where is the energy deposited in the Veto Calorimeter; is the energy carried by single projectile nucleons. The resolution of , which is recalculated into the resolution of , is discussed in Sec. IV.6.
The effect of smearing of energy carried by spectator nucleons due to their Fermi momentum was estimated. The effect was found to be significantly smaller than the resolution of the VCAL and for this reason can be neglected.
We also studied the contribution of non-spectator particles to the energy measured by the veto calorimeter 111The acceptance of the VCAL at 158A GeV is approximately deg for neutral particles (e.g. neutrons and photons) and due to the magnetic field GeV/c, GeV/c for protons. with detailed simulations using VENUS and UrQMD events. The net result was a reduction of the scaled variance of the multiplicity distribution by about for central Pb+Pb collisions when the non-spectator contribution to the VCAL energy is taken into account. With increasing number of spectators the effect becomes much smaller due to this effect. No corrections were applied to the experimental results, nor were the non-spectator contributions taken into account in the calculations of model predictions.
IV.5 Multiplicity distributions
The multiplicity distribution depends on the selected interval (its position and width ; see Fig. 3 for definitions) and the kinematic acceptance selected for the analysis.
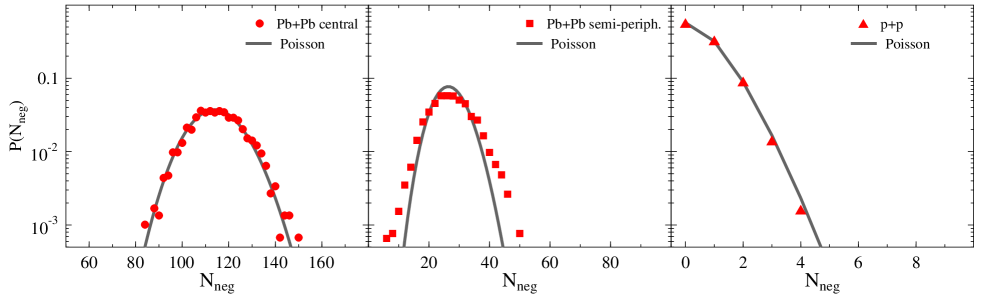
In the centrality intervals and acceptance selected for this analysis, multiplicity distributions show approximately Poissonian behavior for p+p and central Pb+Pb collisions (see Fig. 4). For semi-peripheral collisions the multiplicity distribution is significantly broader than a Poissonian distribution.
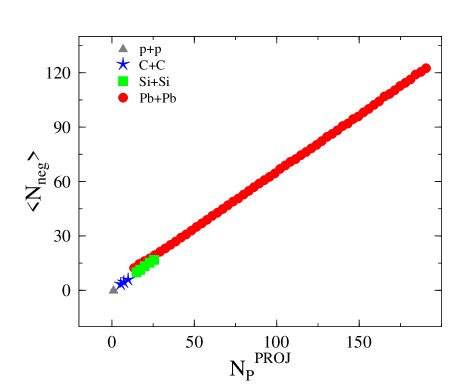
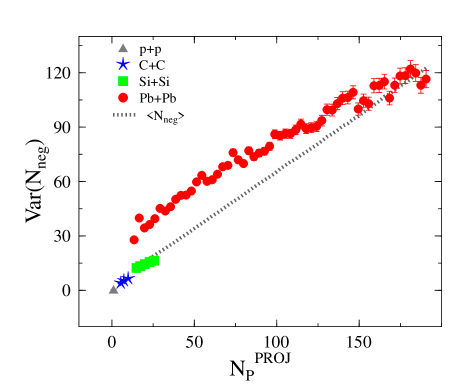
In Figs. 5 and 6 the measured mean value and the variance of the multiplicity distributions as a function of the number of projectile participants are presented. The quantities are not corrected for the fluctuations of the number of projectile participants, as discussed in the next subsection. One can see from these plots that the mean multiplicity shows an approximately linear dependence on the number of projectile participants, whereas the variance of the multiplicity distributions calculated from the data exceeds the variance of the Poisson distributions.
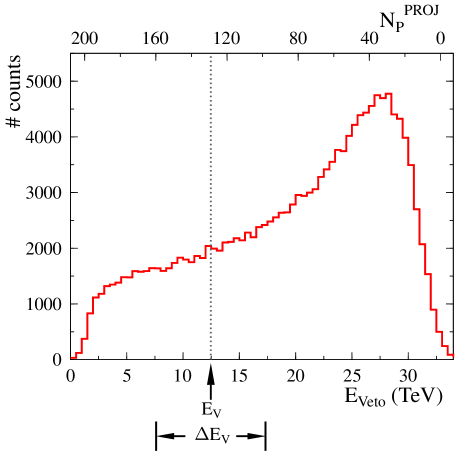
IV.6 Scaled variance of the multiplicity distribution
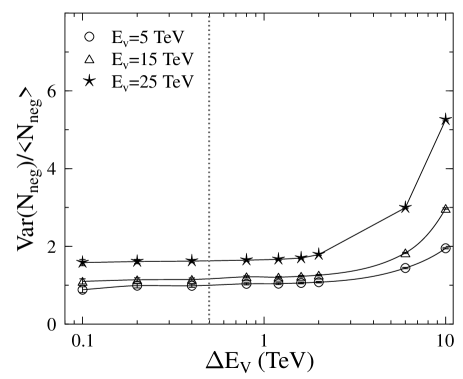
The scaled variance of the multiplicity distribution depends, among other variables, on the width of the energy interval selected in the VCAL. For very broad intervals the measured scaled variance of the multiplicity distribution has a large value because of significant fluctuations in the number of projectile participants . Narrowing the interval results in decreasing fluctuations in the number of projectile participants and consequently in a reduction of the scaled variance as shown in Fig. 7. For smaller than about TeV the measured scaled variance of the multiplicity distribution is almost independent of . Note that even for very small values of the number of projectile spectators fluctuates due to the finite resolution of the VCAL. In the following the scaled variance will be calculated in the intervals GeV (the choice of the width of the interval is a compromise between minimizing correction for the finite interval width and sufficient statistics) and then corrected for fluctuations in the number of projectile participants due to the finite width of the interval and the finite resolution of the Veto Calorimeter.
Within the superposition model leading to Eq. (6), the correction to the scaled variance, which takes into account the finite value of and the calorimeter resolution, is calculated as
| (9) |
where is the variance of due to the finite width of the bin, is the variance of due to the VCAL resolution, is the mean value of in the bin and GeV is the total beam energy. was calculated from the distribution of energy in a given interval. with expressed in GeV was parameterized using calibration measurements MR_PHD as:
| (10) |
The resolution of is easily propagated to the resolution of using Eq. (8).


Finally, the corrected scaled variance is calculated as
| (11) |
where is the measured variance, the measured mean value of the multiplicity distribution in a given bin, and represents the corrections for fluctuations in the number of projectile participants. The dependence of on for some values of are presented in Fig. 8, while the total correction as a function of number of projectile participants is presented in Fig. 9. Using the same procedure, corresponding corrections were determined for C+C and Si+Si collisions. The corrected values of the scaled variance from Eq. (11) are plotted in Fig. 11.
Let us discuss in more detail the physical meaning of the scaled variance displayed in Fig. 11 which is the main result of our study. As already stressed, fluctuations of the number of projectile participants contribute to the multiplicity fluctuations of interest. However, the scaled variance of the multiplicity distribution can be split within the superposition model according to formula (6), that is into the contributions coming from a single participant (or equivalently from a fixed number of participants) and from the varying number of participants - the first and the second term in Eq. (6), respectively. Since the correction represents the contribution from the fluctuating number of projectile participants, the corrected scaled variance shown in Fig. 11 describes fluctuations at fixed number of projectile participants.
If the number of projectile participants uniquely determines the number of particle sources, which contribute to the rapidity interval under study, the scaled variance from Fig. 11 represents the multiplicity fluctuations of particles coming from a single source. However, the number of particle sources can fluctuate even at fixed number of projectile participants. For example, the number of strings, which decay into particles, is a random variable in some models. The number of particle sources can also fluctuate due to the fluctuating number of target participants which are not observed in the NA49 detector. Thus, we stress that the scaled variance shown in Fig. 11 represents the multiplicity fluctuations at fixed number of projectile participants and may still contain some contribution from fluctuations in the number of particle sources.
IV.7 Statistical errors
In general, the variance of a quantity expressed by the fraction is given as
| (12) |
where the symbol means an average over events, denotes the statistical error of or , and is the covariance between and . The statistical error of the quantity is given by .
For the calculation of the statistical errors of the scaled variance, we have , and
| (13) |
where is the kurtosis, is the th central moment of the multiplicity distribution, and is the number of events.
The statistical errors of our results are usually much smaller than the systematic uncertainties discussed in Sec. IV.9.
IV.8 Stability for event cuts and track selection
In this section the stability of our results with respect to variations of the event and track selection criteria is described. All tests were performed for negatively charged particles produced in Pb+Pb minimum bias collisions for the centrality bin corresponding to the number of projectile participants .
The event and track selection criteria are designed to reduce the contamination from the background. To check the stability of the results obtained for the cut parameters were varied within reasonable ranges. In addition, results obtained from the analysis of data taken at two different magnetic field polarities as well as during different running periods have been compared.
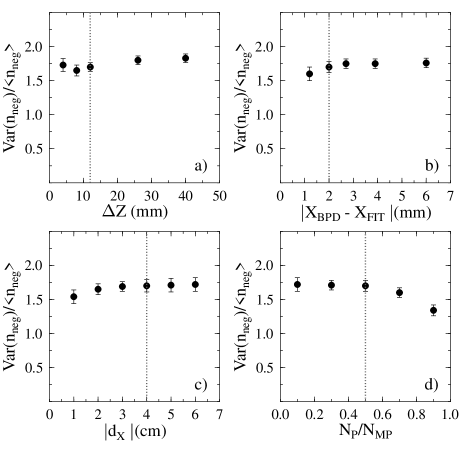
Event cuts are used to reject contamination by non-target interactions. Fig. 10a shows the scaled variance as a function of the maximally accepted distance between fitted and nominal position of the primary vertex. As one can see, the scaled variance of the multiplicity distribution is stable with respect to a small contamination by non-vertex tracks.
Fig. 10b shows the scaled variance as a function of the maximally allowed difference of the and position of the fitted main vertex from the transverse beam position given by the beam position detectors (cf. Fig. 1). Also in this case the scaled variance is stable.
The majority of tracks selected by the track selection criteria are main vertex tracks and the remaining fraction originates predominantly from weak decays and secondary interactions with the material of the detector. To estimate the influence of this contamination on the multiplicity fluctuations, the maximally accepted distance between the extrapolated track and the reconstructed primary vertex in the target plane was varied (see Fig. 10c).
Losses of tracks due to reconstruction inefficiency and track selection cuts influence the measured multiplicity fluctuations. In order to estimate this effect, the dependence of on the ratio of the number of points on a track to the potential number of points was determined (see Fig. 10d).
In summary, the values of the scaled variance appear stable with respect to reasonable variations in the event and track selection cuts.
IV.9 Systematic uncertainties
There are several sources of systematic uncertainties of our results. The systematic error due to the contamination of non-vertex interactions, tracks from weak decays and secondary interactions as well as reconstruction inefficiencies and biases were estimated by varying event and track selection cuts and simulations as discussed in the previous section. The systematic error due to the above mentioned effects was estimated to be .
The main source of a possible systematic bias, however, is the uncertainty in the measurement of the energy deposited in VCAL. To estimate the influence of this uncertainty on the scaled variance of the multiplicity distribution the analysis of so-called beam only events was performed. Here, the Pb beam hits into VCAL without interactions with target nuclei. The measured resolution was ( in GeV) MR_PHD . However, the beam impinges on a small spot in the VCAL, and the resolution estimated by using beam only events does not take into account the VCAL non-uniformity 222The response of the VCAL is different for different positions of the spectator’s hits. It is caused by the construction of the calorimeter. The four photomultipliers, which gain the signal, are situated outside of the active area of the calorimeter sectors. Thus, the amplitude of the signal depends on the horizontal position, where the signal was generated, because of the absorption of the ultraviolet light in the scintillator.. To estimate it, the correlation between signals deposited in different sectors of the VCAL were studied. From the result the resolution (see Eq. (10)) of the Veto calorimeter was derived MR_PHD . The systematic error due to the finite resolution and non-uniformity of the VCAL was estimated to be smaller than for and for .
Finally, the systematic error of the results in Pb+Pb collisions was set to be equal to for and for . The resulting estimates are shown by the outer error bars in Fig. 11. For semi-central C+C and Si+Si collisions we assume systematic error (cf. Figs. 12-13). In p+p interactions the centrality selection does not apply and the systematic error was estimated by varying event and track selection cuts yielding error.
V Results
The results discussed in this section refer to the accepted particles, i.e. particles that are registered by the detector and pass all kinematic cuts and track selection criteria. The data cover a broad range in ( GeV/c). The center-of-mass rapidity of accepted particles is restricted to the interval where the azimuthal acceptance given by Eq. (7) is large.
V.1 Multiplicity fluctuations in Pb+Pb collisions
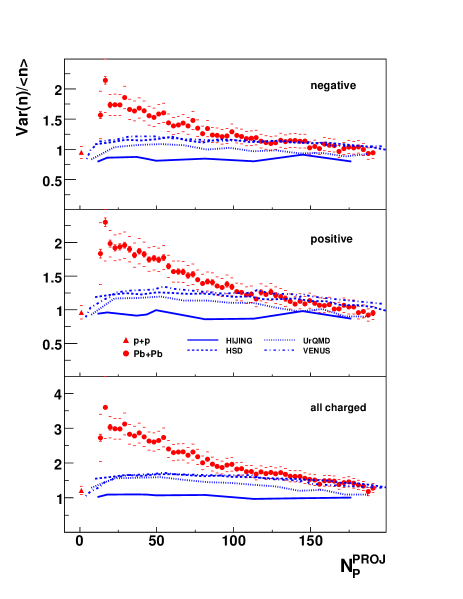
The corrected scaled variance of the multiplicity distribution for negatively, positively and all charged accepted particles produced in minimum bias Pb+Pb collisions as a function of centrality is shown in Fig. 11 (cf. Gazdzicki:2004ef ; Rybczynski:2004yw ) and compared to HIJING Gyulassy:1994ew , HSD Cassing:1999es , UrQMD Bleicher:1999xi and VENUS Werner:1993uh simulations. In the model calculations a realistic simulation of the determination of the number of projectile participants was included. The models produce approximately Poissonian multiplicity distributions independent of centrality. The data points, in contrast, indicate a strong increase towards peripheral collisions possibly with a maximum at about projectile participants. We note that by chance the scaled variance is approximately for p+p collisions at GeV, although the multiplicity distribution in p+p collisions is not Poissonian both at lower and higher energies (cf. Sec. VI and Gazdzicki:1990bp ).
The scaled variances for positively and negatively charged particles are similar. The corresponding values for all charged particles are larger. Assuming that negatively and positively charged particles in the experimental acceptance are correlated with a correlation factor , one gets
| (14) |
where , and are multiplicities of negatively, positively and all charged particles, respectively, and, for simplicity, we assumed . As seen, the scaled variance for charged particles is times as large as that for positives or negatives (see also Begun:2004gs ). The positive value of the correlation factor required by the data () may reflect the effect of electric charge conservation.
V.2 Multiplicity fluctuations in C+C and Si+Si collisions

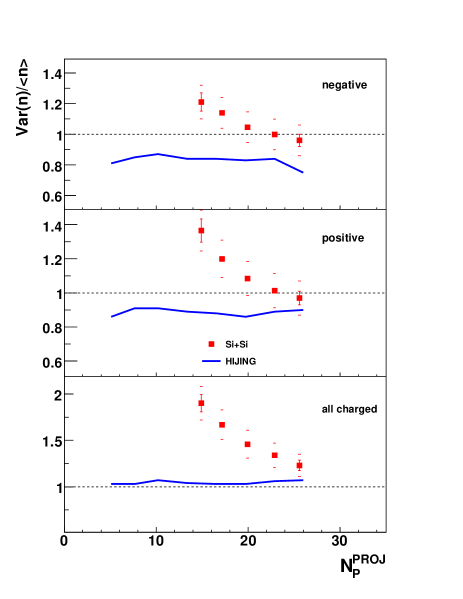
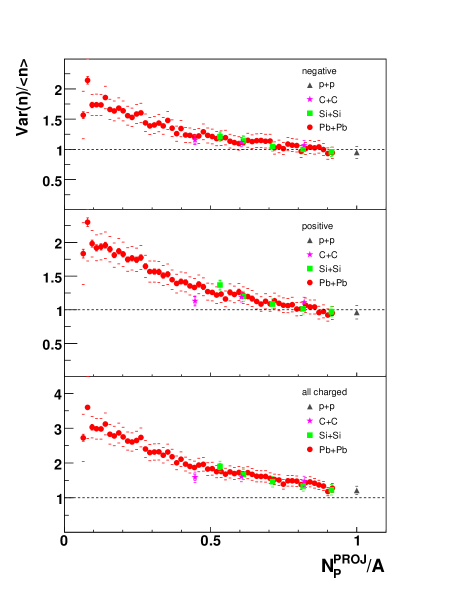
The corrected scaled variances of multiplicity distributions for negatively, positively and all charged accepted particles produced in semi-central C+C and Si+Si collisions as a function of centrality are presented in Figs. 12 and 13. The data are compared with results from a HIJING simulation. The scaled variance for negative and positive hadrons shows almost Poissonian fluctuations in C+C as well as in Si+Si collisions, similarly to the observed multiplicity fluctuations in central Pb+Pb interactions. The multiplicity fluctuations for all charged accepted particles are much larger than for the like sign, as also observed in Pb+Pb collisions. Since data on peripheral C+C and Si+Si collisions are not available, it is difficult to speculate about the centrality dependence of the scaled variance. However, it seems that there is a scaling seen in the variable , the fraction of nucleons participating in the collision (Fig. 14). In order to validate this very suggestive scaling data on minimum bias collisions of C+C and Si+Si would be necessary.
VI Comparison with results from other experiments
Assuming that the produced particles are emitted independently in momentum space, the mean multiplicity in a limited acceptance can be expressed through the mean multiplicity in the full acceptance as , where is the fraction of registered particles. The variance of the multiplicity distribution in a limited acceptance can be written as . The probability that a given fraction of produced particles is registered is given by the binomial distribution. Using the above formulas, one easily finds the scaled variance in a limited acceptance
| (15) |
which depends linearly on the fraction of registered particles.
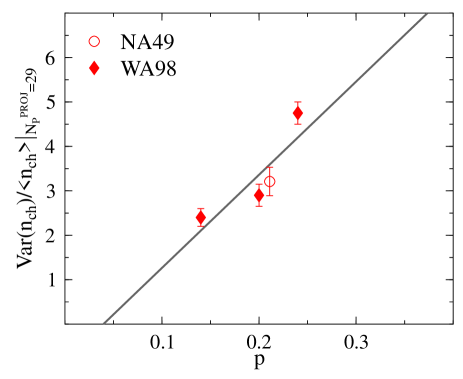
In order to compare to results obtained by other experiments, the NA49 results were extrapolated to the full azimuthal acceptance in the rapidity interval . The extrapolation was done by means of Eq. (15) and values of obtained from a HIJING simulation which included the NA49 acceptance filter. Fig. 15 shows the scaled variance of the multiplicity distribution of all charged particles for from the NA49 and WA98 Aggarwal:2001aa experiments plotted versus the fraction of registered particles in the NA49 experiment and in the WA98 experiment Aggarwal:2001aa . The latter measured the multiplicity fluctuations of charged particles produced in Pb+Pb collisions at GeV in the central rapidity region. The predicted linear dependence of Eq. (15) is seen to agree with WA98 results Aggarwal:2001aa . The WA98 experiment used a centrality determination method which is different from NA49, i.e. the total transverse energy in the forward rapidity region was used to fix the centrality in the WA98 experiment. Nevertheless the results of NA49 and WA98 at the same value of agree (see Fig. 15).
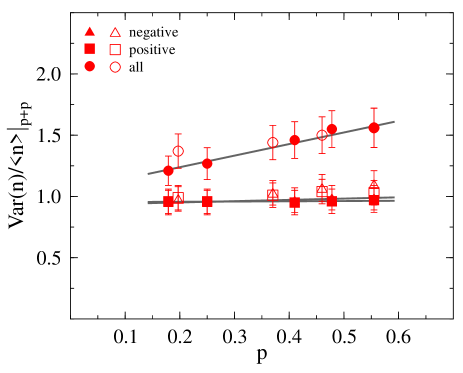
The NA49 detector registers a fraction of all produced particles. The fraction of registered particles can be decreased by cuts in the rapidity distribution. In the case of p+p interactions, the scaled variance of the multiplicity distribution was calculated in the following rapidity intervals : (1.1, 2.6), (0.85, 3.8), (0.0, 3.8), (-0.4, 3.8) and (-2.4, 3.8) which correspond to fractions of registered particles equal to 0.18, 0.25, 0.41, 0.48 and 0.55, respectively. Instead of cutting in rapidity one can change the fraction of registered particles by selecting a range in transverse momentum of the registered particles. The scaled variance of the multiplicity distribution was then calculated in the following (GeV) intervals: (0.0, 0.2), (0.0, 0.4), (0.0, 0.6) and in the full range corresponding to equal 0.2, 0.37, 0.41 and 0.55, respectively.
Fig. 16 shows the scaled variance of the multiplicity distribution for negatively, positively and all charged particles produced in p+p collisions at GeV as a function of the fraction of registered particles chosen by changing the rapidity and transverse momentum intervals. One can clearly see the linear dependence described by Eq. (15). The dependence of the scaled variance on the fraction of registered particles is independent of the choice of rapidity or transverse momentum as cut variable.
The rise of the scaled variance of all charged particles with increasing acceptance can be presumably attributed to the effect of resonances which predominantly decay into oppositely charged particles.
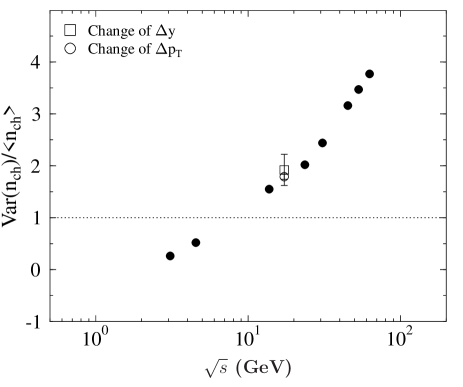
Multiplicity distributions were measured in p+p interactions in numerous experiments in a wide range of collision energies. An excellent compilation of p+p data can be found in Thome:1977ky ; Whitmore:1973ri ; Whitmore:1976ip . Fig. 17 shows the scaled variance of multiplicity distributions of all charged particles in full phase-space as a function of the collision energy. The extrapolated result from NA49 (Eq. (15)) is also shown in Fig. 17. The corrected scaled variance of all particles reaches a value of about 2 and fits well to the other data shown in this plot.
VII Comparison with models and discussion
Before closing our considerations we discuss possible origins of the strong dependence of on the collision centrality. In this context, it should be stated that the strong centrality dependence of the scaled variance found in our experimental study was completely unexpected. We do not know of any theoretical considerations that would have predicted the effect. However, after release of our preliminary data Gazdzicki:2004ef ; Rybczynski:2004yw several attempts to explain them have been formulated Rybczynski:2004zi ; Cunqueiro:2005hx ; Brogueira:2005cn ; Gazdzicki:2005rr ; Konchakovski:2005hq . Below the attempts are briefly presented.
We start the discussion with a reminder that the multiplicity fluctuations presented in this study were observed for a fixed number of the projectile participants. Although the average numbers of participants from the projectile and from the target are approximately equal in the collisions of identical nuclei, the number of target participants fluctuates even though the number of projectile participants is kept fixed. We also note that the multiplicity fluctuations were measured in the forward hemisphere (). Keeping these remarks in mind, we note that the large multiplicity fluctuations seen in the forward rapidity window are caused either by dynamical fluctuations of the particle production process, which are present even at fixed number of projectile participants, or the multiplicity fluctuations in the forward hemisphere result from the fluctuations of target participant number (the number is not experimentally fixed) which are transferred to the forward hemisphere due to an unknown collision mechanism. The mechanism has to strongly couple the forward and backward hemispheres.
For the purpose of the further discussion, it is useful to divide the models of nucleus-nucleus collisions into three categories as proposed in Gazdzicki:2005rr . There are transparency models where the projectile (target) participants, which are excited in the course of interaction, mostly contribute to the particle production in the forward (backward) hemisphere. Furthermore, there are (rather unrealistic) reflection models when the projectile (target) participants mostly contribute to the backward (forward) hemisphere. Finally, there are mixing models in which the projectile and target participants contribute significantly to both the backward and forward hemispheres.
In the transparency models, the observed multiplicity fluctuations can be caused only by the already mentioned dynamical fluctuations of the production process. In the reflection and mixing models, the fluctuations of the target participant number contribute to the multiplicity fluctuations in the forward hemisphere in addition to possible dynamical fluctuation. The models, which are represented in Figs. 11, 12 and 13, that is HIJING Gyulassy:1994ew , HSD Cassing:1999es , and UrQMD Bleicher:1999xi all belong to the transparency class. The results of VENUS Werner:1993uh are very similar to those of HIJING, HSD and UrQMD, even though the correlation between the forward and backward hemispheres is somewhat stronger in VENUS. The model calculations were performed with proper simulation of the VCAL response and the NA49 acceptance. The energy of a model event was calculated as the energy of the projectile spectators smeared by a Gaussian distribution with the width given by Eq. (10). The models, which produce approximately Poissonian multiplicity distributions independently of centrality, highly underestimate the observed multiplicity fluctuations in non-central collisions. The models are unable to reproduce even qualitatively the centrality dependence of the scaled variance. This remark applies not only to the Monte Carlo models as HIJING Gyulassy:1994ew , HSD Cassing:1999es , and UrQMD Bleicher:1999xi , which are based on string excitation and decay, but to any transparency model which does not assume correlations among secondary particles. For example, within a statistical model with fixed volume, where the electric charge is strictly conserved, the scaled variance of positive or negative particles varies in the range Begun:2004gs . The actual value depends on the thermal system’s volume and the acceptance in which the multiplicity fluctuations are observed.
As already noted, the transparency models can produce large multiplicity fluctuations, if there are built in correlations among produced particles. The problem can be formulated in a quite general way.
The average multiplicity of secondaries is roughly proportional to the number of nucleons participating in the collision (cf. Fig. 5). Assuming that is proportional to the system’s volume , we have with being the constant density of produced particles. Defining the correlation function through the equation , where is the two-particle density, we get the desired formula
| (16) |
which tells us that the multiplicity fluctuations are related to the inter-particle correlations. The multiplicity distribution is Poissonian, if the particles are emitted independently from each other ( = 0).
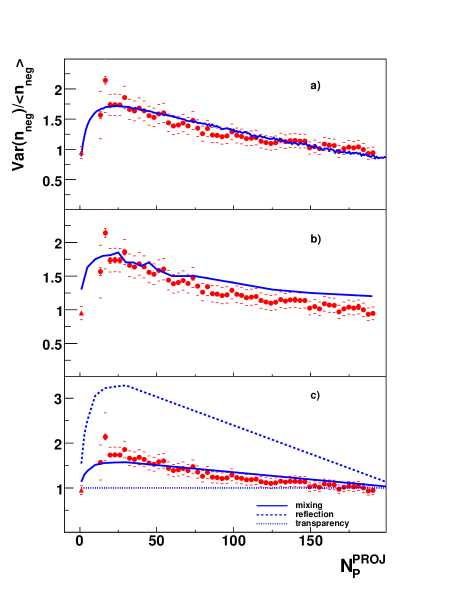
It is not difficult to invent a correlation function which substituted in Eq. (16) reproduces the data shown in Fig. 11. Some functions are discussed in Rybczynski:2004zi . The correlation function has to be positive at small distances (attractive interaction) and negative at larger distances (repulsive interaction). For Pb+Pb collisions the sign of the correlation changes at which corresponds to when reaches its maximum. For the correlation function vanishes. Possible mechanisms responsible for such a correlation function were discussed in Rybczynski:2004zi . They include: a combination of attractive and repulsive interaction (the prediction of this model is shown in Fig. 18a), percolation, dipole-dipole interaction, and non-extensive thermodynamics.
Specific percolation models, which produce strong correlations among secondaries and thus provide large multiplicity fluctuations, were discussed in Cunqueiro:2005hx ; Brogueira:2005cn . The color strings, which are stretched in the course of the interaction, form multi-string clusters. In p+p collisions there are single-string clusters but in central Pb+Pb collisions the density of strings is so high that the strings overlap and form one big cluster. The decrease of the scaled variance as a function of centrality is in this picture associated with the percolation phase transition, i.e. the appearance of the large cluster. The prediction of the model Cunqueiro:2005hx is shown in Fig. 18b and reproduces the qualitative behavior of our experimental results.
While the transparency models require strong inter-particle correlations to comply with our data, the mixing and reflection models can produce large multiplicity fluctuations in the forward hemisphere due to the fluctuations of target participant number which is not fixed in our measurement. In Fig. 18c we show the prediction of the reflection and mixing models Konchakovski:2005hq . In the reflection model the target participants contribute to the forward hemisphere, and thus the fluctuations of the target participant number produce the multiplicity fluctuations of secondaries. As seen in Fig. 18c, the reflection model strongly overestimates the observed scaled variance but the mixing models, where the target as well as projectile participants equally contribute to the forward and backward hemispheres, approximately agree with the data. The question arises whether the mixing models properly represent the dynamics of nucleus-nucleus collisions at high-energies. A recent theoretical analysis of d+Au collisions at RHIC Bialas:2004su suggests that the contribution of projectile participants indeed extends to the backward hemisphere while that of target participants to the forward hemisphere.
In principle, the discussed models can predict multiplicity fluctuations not only in Pb+Pb collisions but also in p+p, C+C and Si+Si reactions. It remains to be seen whether they can provide a consistent description of the fluctuations in all reactions.
Finally we note that the transverse momentum fluctuations measured in nuclear collisions at GeV Anticic:2003fd and quantified by the show a similar centrality dependence with a maximum located close to that of the scaled variance of the multiplicity distribution. This behavior of the transverse momentum fluctuations as a function of collision centrality was related in a superposition model Mrowczynski:2004cg to the centrality dependence of the multiplicity fluctuations using the correlation of average and multiplicity observed in p+p collisions Anticic:2003fd . Moreover, we note that the percolation string model also describes qualitatively the centrality dependence of Ferreiro:2003dw .
VIII Summary and conclusions
Multiplicity fluctuations in the forward hemisphere were analyzed by studying the scaled variance of the multiplicity distributions in p+p, C+C, Si+Si, and Pb+Pb collisions. A strong centrality dependence is seen for negatively, positively and all charged particles. The number of projectile participants was used to determine the collision centrality. The scaled variance is close to unity for p+p, C+C, Si+Si and central Pb+Pb collisions. However it increases significantly towards peripheral Pb+Pb collisions. The magnitude of the scaled variance is similar for positively and negatively charged particles and is about times larger for all charged particles.
The string-hadronic models of nuclear collisions (with or without
color exchange and without string fusion) predict no dependence of
the scaled variance on the number of projectile participants, and
thus the models qualitatively disagree with the data. A maximum of
the scaled variance appears for semi-peripheral collisions when
the forward and backward hemispheres are strongly coupled and
fluctuations of the number of target participants contribute to
the forward rapidity window. The observed scaled variance can also
be reproduced within the models which assume strong dynamic
correlations as, for example, in percolation phase transitions.
Acknowledgements.
This work was supported by the US Department of Energy Grant DE-FG03-97ER41020/A000, the Bundesministerium fur Bildung und Forschung, Germany (06F140), the Virtual Institute VI-146 of Helmholtz Gemeinschaft, Germany, the Polish State Committee for Scientific Research (1 P03B 097 29, 1 P03B 121 29, 1 P03B 127 30), the Hungarian Scientific Research Foundation (T032648, T032293, T043514), the Hungarian National Science Foundation, OTKA, (F034707), the Polish-German Foundation, the Korea Science & Engineering Foundation (R01-2005-000-10334-0) and the Bulgarian National Science Fund (Ph-09/05).References
- (1) J. C. Collins and M. J. Perry, Phys. Rev. Lett. 34, 1353 (1975).
- (2) E. V. Shuryak, Phys. Rept. 61, 71 (1980).
- (3) M. Gaździcki et al. [NA49 Collaboration], J. Phys. G 30, S701 (2004) [arXiv:nucl-ex/0403023].
- (4) H. Heiselberg, Phys. Rept. 351, 161 (2001) [arXiv:nucl-th/0003046].
- (5) M. M. Aggarwal et al. [WA98 Collaboration], Phys. Rev. C 65, 054912 (2002) [arXiv:nucl-ex/0108029].
- (6) S. V. Afanasev et al. [NA49 Collaboration], Phys. Rev. Lett. 86, 1965 (2001) [arXiv:hep-ex/0009053].
- (7) C. Roland et al. [NA49 Collaboration], J. Phys. G 30, S1381 (2004) [arXiv:nucl-ex/0403035].
- (8) J. Adams et al. [STAR Collaboration], Phys. Rev. C 68, 044905 (2003) [arXiv:nucl-ex/0307007].
- (9) Z. w. Chai et al. [PHOBOS Collaboration], J. Phys. Conf. Ser. 27, 128 (2005) [arXiv:nucl-ex/0509027].
- (10) T. Anticic et al. [NA49 Collaboration], Phys. Rev. C 70, 034902 (2004) [arXiv:hep-ex/0311009].
- (11) D. Adamova et al. [CERES Collaboration], Nucl. Phys. A 727, 97 (2003) [arXiv:nucl-ex/0305002].
- (12) J. Adams et al. [STAR Collaboration], Phys. Rev. C 71, 064906 (2005) [arXiv:nucl-ex/0308033].
- (13) S. S. Adler et al. [PHENIX Collaboration], Phys. Rev. Lett. 93, 092301 (2004) [arXiv:nucl-ex/0310005].
- (14) L. Stodolsky, Phys. Rev. Lett. 75, 1044 (1995).
- (15) M. Stephanov, K. Rajagopal and E. Shuryak, Phys. Rev. D 60, 114028 (1999) [arXiv:hep-ph/9903292].
- (16) St. Mrówczyński, Phys. Lett. B 430, 9 (1998) [arXiv:nucl-th/9712030].
- (17) M. Stephanov, K. Rajagopal and E. Shuryak, Phys. Rev. Lett. 81, 4816 (1998) [arXiv:hep-ph/9806219].
- (18) M. Gaździcki, M. I. Gorenstein and St. Mrówczyński, Phys. Lett. B 585, 115 (2004) [arXiv:hep-ph/0304052].
- (19) A. Białas, M. Błeszyński and W. Czyż, Nucl. Phys. B 111, 461 (1976).
- (20) M. Gaździcki and M. Gorenstein, Phys. Lett. B 640, 155 (2006) [arXiv:hep-ph/0511058].
- (21) S. Afanasiev et al. (NA49 Collaboration), Nucl. Instrum. Meth. A 430, 210 (1999)
- (22) L. S. Barnby et al. (NA49 Collaboration), J. Phys. G 25, 469 (1999)
- (23) C. Alt et al. (NA49 Collaboration), Eur. Phys. J. C 45, 343 (2006)
- (24) S. V. Afanasiev et al. [The NA49 Collaboration], Phys. Rev. C 66, 054902 (2002) [arXiv:nucl-ex/0205002].
- (25) M. Rybczyński, Ph. D. Dissertation, Kielce, 2005.
- (26) M. Rybczyński et al. [NA49 Collaboration], J. Phys. Conf. Ser. 5, 74 (2005) [arXiv:nucl-ex/0409009].
- (27) M. Gyulassy and X. N. Wang, Comput. Phys. Commun. 83, 307 (1994) [arXiv:nucl-th/9502021].
- (28) W. Cassing and E. L. Bratkovskaya, Phys. Rept. 308, 65 (1999).
- (29) M. Bleicher et al., J. Phys. G 25, 1859 (1999) [arXiv:hep-ph/9909407].
- (30) K. Werner, Phys. Rept. 232, 87 (1993).
- (31) M. Gaździcki, R. Szwed, G. Wrochna and A. K. Wróblewski, Mod. Phys. Lett. A 6, 981 (1991).
- (32) V. V. Begun, M. Gazdzicki, M. I. Gorenstein and O. S. Zozulya, Phys. Rev. C 70, 034901 (2004) [arXiv:nucl-th/0404056].
- (33) V. P. Konchakovski, S. Haussler, M. I. Gorenstein, E. L. Bratkovskaya, M. Bleicher and H. Stoecker, Phys. Rev. C 73, 034902 (2006) [arXiv:nucl-th/0511083].
- (34) W. Thome et al. [Aachen-CERN-Heidelberg-Munich Collaboration], Nucl. Phys. B 129, 365 (1977).
- (35) J. Whitmore, Phys. Rept. 10, 273 (1974).
- (36) J. Whitmore, Phys. Rept. 27, 187 (1976).
- (37) M. Rybczyński and Z. Włodarczyk, J. Phys. Conf. Ser. 5, 238 (2005) [arXiv:nucl-th/0408023].
- (38) L. Cunqueiro, E. G. Ferreiro, F. del Moral and C. Pajares, Phys. Rev. C 72, 024907 (2005) [arXiv:hep-ph/0505197].
- (39) P. Brogueira and J. Dias de Deus, Phys. Rev. C 72, 044903 (2005) [arXiv:hep-ph/0506081].
- (40) A. Białas and W. Czyż, Acta Phys. Polon. B 36, 905 (2005) [arXiv:hep-ph/0410265].
- (41) St. Mrówczyński, M. Rybczyński, and Z. Włodarczyk, Phys. Rev. C 70, 054906 (2004) [arXiv:nucl-th/0407012].
- (42) E. G. Ferreiro, F. del Moral and C. Pajares, Phys. Rev. C 69, 034901 (2004) [arXiv:hep-ph/0303137].