Onset of Deconfinement in Pb+Pb Collisions at the Cern SPS P. Seyboth for the NA49 Collaboration Presented at the XLVI Cracow School of Theoretical Physics, Zakopane, Poland, May 27 - June 5, 2006 (to be published in Acta Physica Polonica B)
Abstract
The NA49 fixed-target experiment studied high energy–density matter produced in nucleus–nucleus reactions at the CERN SPS. In central Pb+Pb collisions at 158 GeV the energy density at the early stage substantially exceeds the threshold for quark deconfinement predicted by lattice QCD. The produced matter shows strong transverse and longitudinal flow. Ratios of yields of produced particles are approximately consistent with statistical equilibration. An energy scan through the SPS range revealed structure in the energy dependence of and K yields as well as of the inverse slopes of transverse mass distributions. These features suggest that a deconfined phase starts to be produced at around 30 GeV in central Pb+Pb collisions. The analysis of fluctuations and correlations has not yet provided evidence for the predicted critical point of QCD.
PACS numbers: 25.75.-q, 25.75.Dw, 25.75.Gz, 25.75.Ld, 25.75.Nq
C. Alt9, T. Anticic23, B. Baatar8,D. Barna4, J. Bartke6, L. Betev10, H. Białkowska20, C. Blume9, B. Boimska20, M. Botje1, J. Bracinik3, R. Bramm9, P. Bunčić10, V. Cerny3, P. Christakoglou2, P. Chung19, O. Chvala14, J.G. Cramer16, P. Csató4, P. Dinkelaker9, V. Eckardt13, D. Flierl9, Z. Fodor4, P. Foka7, V. Friese7, J. Gál4, M. Gaździcki9,11, V. Genchev18, G. Georgopoulos2, E. Gładysz6, K. Grebieszkow21, S. Hegyi4, C. Höhne7, K. Kadija23, A. Karev13, D. Kikola22, M. Kliemant9, S. Kniege9, V.I. Kolesnikov8, E. Kornas6, R. Korus11, M. Kowalski6, I. Kraus7, M. Kreps3, A. Laszlo4, R. Lacey19, M. van Leeuwen1, P. Lévai4, L. Litov17, B. Lungwitz9, M. Makariev17, A.I. Malakhov8, M. Mateev17, G.L. Melkumov8, A. Mischke1, M. Mitrovski9, J. Molnár4, St. Mrówczyński11, V. Nicolic23, G. Pálla4, A.D. Panagiotou2, D. Panayotov17, A. Petridis2, W. Peryt22, M. Pikna3, J. Pluta22, D. Prindle16, F. Pühlhofer12, R. Renfordt9, C. Roland5, G. Roland5, M. Rybczyński11, A. Rybicki6,10, A. Sandoval7, N. Schmitz13, T. Schuster9, P. Seyboth13, F. Siklér4, B. Sitar3, E. Skrzypczak21, M. Slodkowski22, G. Stefanek11, R. Stock9, C. Strabel9, H. Ströbele9, T. Susa23, I. Szentpétery4, J. Sziklai4, M. Szuba22, P. Szymanski10,20, V. Trubnikov20, D. Varga4,10, M. Vassiliou2, G.I. Veres4,5, G. Vesztergombi4, D. Vranić7, A. Wetzler9, Z. Włodarczyk11 I.K. Yoo15, J. Zimányi4
1NIKHEF, Amsterdam, Netherlands.
2Department of Physics, University of Athens, Athens, Greece.
3Comenius University, Bratislava, Slovakia.
4KFKI Research Institute for Particle and Nuclear Physics, Budapest, Hungary.
5MIT, Cambridge, USA.
6Institute of Nuclear Physics, Cracow, Poland.
7Gesellschaft für Schwerionenforschung (GSI), Darmstadt, Germany.
8Joint Institute for Nuclear Research, Dubna, Russia.
9Fachbereich Physik der Universität, Frankfurt, Germany.
10CERN, Geneva, Switzerland.
11Institute of Physics Świ etokrzyska Academy, Kielce, Poland.
12Fachbereich Physik der Universität, Marburg, Germany.
13Max-Planck-Institut für Physik, Munich, Germany.
14Inst. of Particle and Nuclear Physics, Charles Univ., Prague, Czech Republic.
15Department of Physics, Pusan National University, Pusan, Republic of Korea.
16Nuclear Physics Laboratory, University of Washington, Seattle, WA, USA.
17Atomic Physics Department, Sofia Univ. St. Kliment Ohridski, Sofia, Bulgaria.
18Institute for Nuclear Research and Nuclear Energy, Sofia, Bulgaria.
19Department of Chemistry, Stony Brook Univ. (SUNYSB), Stony Brook, USA.
20Institute for Nuclear Studies, Warsaw, Poland.
21Institute for Experimental Physics, University of Warsaw, Warsaw, Poland.
22Faculty of Physics, Warsaw University of Technology, Warsaw, Poland.
23Rudjer Boskovic Institute, Zagreb, Croatia.
1 Introduction
Qualitative considerations based on the finite size of hadrons [1] as well as quantum chromodynamics (QCD) calculations on the lattice [2, 3] predict that at sufficiently high energy density strongly interacting matter will transform into a state of quasi-free quarks and gluons, the quark gluon plasma (QGP). Theoretical investigations also found [4] that this phase transition is of first order for finite quark masses and large non–zero baryon density. The phase boundary is predicted to end in a critical point and turn into a rapid crossover as the net baryon density decreases.
The initial stage of high energy collisions of large nuclei provides the best environment to produce the deconfined phase of matter in the laboratory [5, 6]. Lead ions first became available at the CERN SPS in 1994. In the first publication from this programme [7] NA49 demonstrated that in central Pb+Pb collisions at top SPS energy the initial energy density exceeds the critical value of 1 GeV/fm3. The SPS experiments found that the reactions produced an explosively expanding fireball. Moreover, originally proposed signatures of the QGP, i.e. suppression, strangeness enhancement, and possibly thermal photons and dileptons were observed [8]. However, these signatures are not specific for deconfinement. The NA49 collaboration therefore performed an energy scan from 20 - 158 GeV in order to search for structure in the energy dependence of hadron production characteristics which could indicate the onset of deconfinement [9]. The measurements indeed suggest structure around 30 GeV [10] which will be discussed below. NA49 also searched for fluctuations which might occur if distinct phases coexisted in the early stage of the reactions or if hadrons froze out close to the critical point estimated [3] to lie in a region accessible at the SPS.
2 Experiment NA49 at the CERN SPS
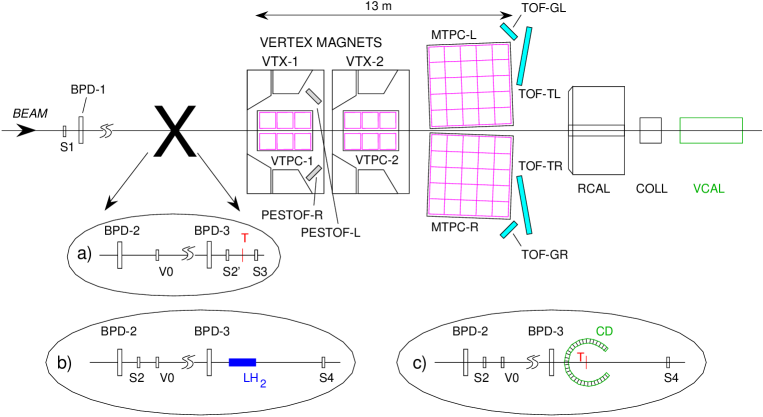
The main features of the NA49 experiment [11] located in the H2 beam line of the North Experimental Hall (see fig. 1) are large acceptance precision tracking ((GeV/c)-1) and particle identification in the central and forwards rapidity regions using time projection chambers (TPCs). Charged particles (, K, p, ) are identified mostly from the measurement of their energy loss in the TPC gas (accuracy 3 – 6 %). Yields are obtained by fitting a sum of Gaussian functions for the various particle species to the dE/dx distributions in small bins of momentum p and transverse momentum . At central rapidity the identification is further improved by measurement of the time-of-flight (resolution 60 ps) to arrays of scintillation counter tiles. Strange particles (K, , , ) are detected via decay topology and invariant mass measurement. A forward calorimeter measures the energy of the projectile spectators from which the impact parameter in A+A collisions and the number of participating nucleons are deduced. Also reactions of C and Si ions as well as of deuterons were studied. These beams were produced by fragmentation of the primary Pb beam and selected by magnetic rigidity and by specific energy loss in transmission detectors in the beam line. In addition NA49 pursued an extensive program of proton induced collisions for a study of the evolution of particle production from p+p via p+Pb to Pb+Pb reactions.
3 Analysis procedure
All events used for physics analysis were required to have a good vertex in the respective target. Tracks of accepted particles had to fulfill quality requirements on the number of measured points and the distance of closest approach to the event vertex. Particle yields have been corrected for acceptance, reconstruction efficiency and feed-down contamination from weak decays. Results on particle yields for the upper 3 energies have been published in [12, 13, 14] where more details on the analysis procedures may be found. Results at 20 and 30 GeV are preliminary.
4 Thermal freezeout parameters from spectra and correlations
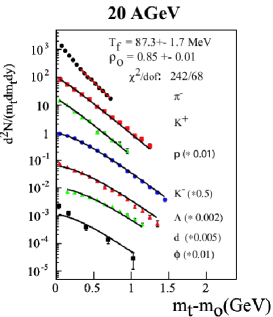
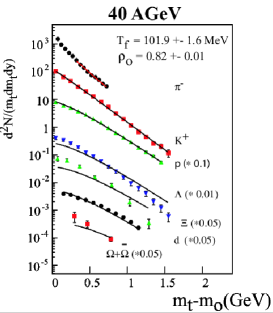
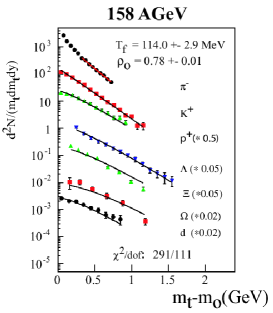
Midrapidity invariant yields as a function of the transverse mass are shown in fig. 2 at 20, 40 and 158 GeV as examples for the large variety of particle species measured by NA49. The spectra become progressively flatter with increasing particle mass, a fact that can be explained by the combined effect of the random thermal momentum distribution and strong radial flow in the produced matter droplet. The development of collective flow is generally attributed to the hydrodynamic pressure generated in the dense early stage [15]. A hydrodynamically based ”blast wave” parameterization [16] indeed provides a reasonable description of all the spectra with two parameters: a temperature T (90 - 110) MeV and a radial flow velocity of 0.8 c at the surface. These parameters characterize the thermal/kinetic freezeout of the fireball. The pion spectrum overshoots the model curve at low due to the feed-down contribution from resonance decays and this region was therefore not used in the fit. More detailed analyses [17, 14] seem to suggest an earlier freezeout of multistrange hyperons at higher temperature and smaller radial flow velocity.
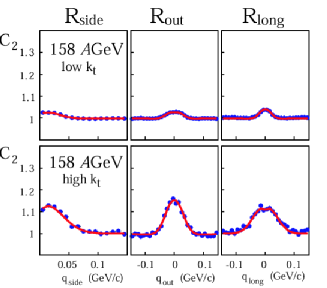
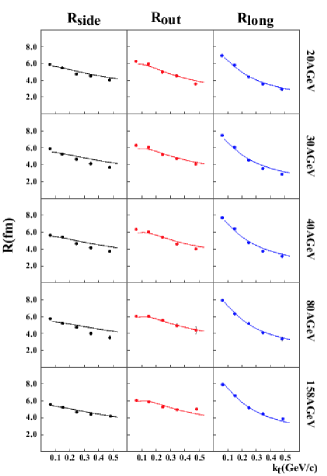
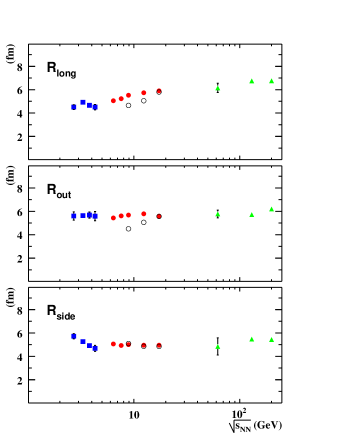
Collective flow also affects quantum statistics induced correlations of identical particles. For negative pion pairs the range of these Bose-Einstein (BE) correlations in momentum difference, which is inversely proportional to the effective pion source size, is reduced by flow. This reduction gets stronger with increasing transverse momentum (see fig. 3 (left)). In the NA49 publication [18] this effect together with the spectrum of pions was used for the first time to demonstrate strong collective radial flow in Pb+Pb collisions, i.e. the correlation of the radial position of the emission points with the transverse momentum of the produced particle. This information cannot be obtained from transverse mass spectra alone. The fitted effective source sizes, the so-called radius parameters R, are shown as a function of averaged transverse momentum of the pion pairs for all the SPS energies in fig. 3 (right). The decrease of R with increasing due to radial flow is clearly observed. On the other hand, as shown in fig. 4 (left) the radius parameters show remarkably little energy dependence over the whole energy range from AGS to RHIC. In particular, there is no indication of an increase of R at the SPS which might be expected from a first order phase transition. In fact, hydrodynamic calculations with a simple freezeout procedure overpredict the values of R and R [15]. A solution of this so-called HBT puzzle seems to lie in a more sophisticated treatment of the frezzeout process [19].
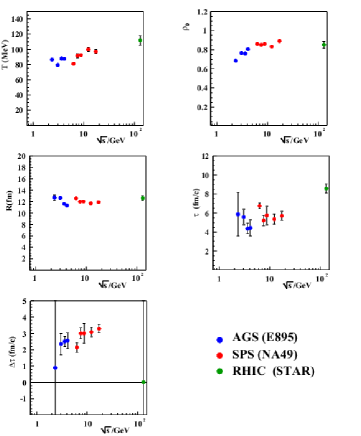
The hydrodynamics inspired blast wave parameterisation provides a comprehensive description of the kinetic freezeout stage of nucleus–nucleus reactions. The parameterization [16] assumes a uniform pion emission density in a cylinder of radius R and a radial flow velocity increasing linearly with radius to a surface maximum of . Further parameters of the model are the kinetic freezeout temperature T (mainly determined by the spectra), the lifetime of the fireball (derived mostly from R) and the duration of the pion emission burst (obtained from the difference of R and R). Resulting parameter values from simultaneous fits to radii and spectra from AGS to RHIC energies are plotted versus collision energy in fig. 4 (right). The corresponding radius parameters at the SPS are shown as curves in fig. 3 (right). The fit results demonstrate that the matter droplet at freezeout has increased radially by a factor of two and has attained strong collective radial flow. While frezeout temperature and fireball lifetime appear to to increase slowly with energy, the surface radial flow velocity seems to saturate at SPS energies.
While radial flow manifest in spectra and BE correlations builds up over the full lifetime of the fireball, anisotropic flow generated in non-central collisions is particularly sensitive to the properties of the produced matter during the early phase of the reaction. In the almond shaped interaction region anisotropic pressure gradients and rescattering lead to an azimuthally anisotropic momentum distribution. Since the spatial anisotropy disappears quickly, the momentum anisotropy is generated predominantly at early times in the reaction. The pressure rise with initial energy density is qualitatively expected to slow down when deconfinement sets in. Anisotropic flow is quantified by the Fourier expansion coefficients of the azimuthal angular distribution with respect to the reaction plane. At midrapidity the dominant effect is observed in the second coefficient v2, termed elliptic flow.
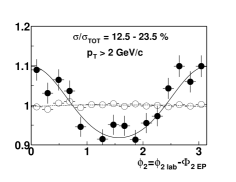
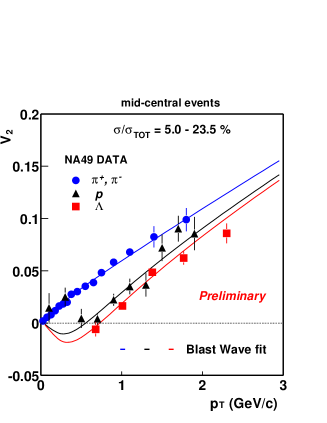
NA49 measured anisotropic flow of pions and protons in Pb+Pb collisions at 40 and 158 GeV [20] and of hyperons [21] at 158 GeV. An example of the azimuthal distribution with respect to the reaction plane as determined from pions is displayed in fig. 5 (left). The elliptic flow coefficient v2 at midrapidity is plotted versus transverse momentum for the different particle species in fig. 5 (right). One observes a strong increase with and a clear mass hierarchy as predicted by hydrodynamic models [15]. Values of v2 are about 30 % higher at RHIC (not shown) than at SPS. Both at the SPS and at RHIC the observed elliptic flow v2 can be reproduced by the blast wave model parameterisation [16] with parameters consistent with those describing spectra and Bose–Einstein correlations [21]. Pure hydrodynamic model calculations overpredict v2 particularly at SPS energies. However, coupling of a hadronic rescattering phase to the initial deconfined hydrodynamic phase results in reasonable description of the measured energy dependence from SPS to RHIC [22].

5 Hadron freezeout parameters from particle yields
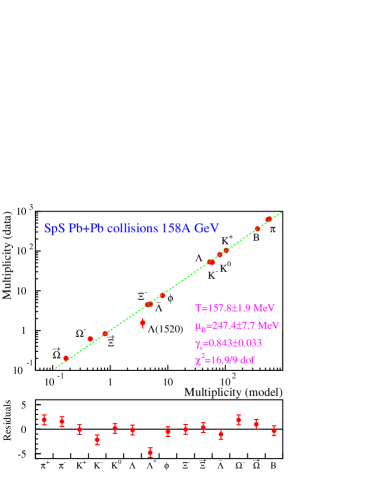
The large acceptance of the NA49 detector allows measurements of rapidity spectra from midrapidity up to almost beam rapidity (see fig. 6). Rapidity distributions of most particles are peaked at midrapidity. Only hyperons, sharing a valence quark with the projectile, show a flattening at higher collision energy. Due to the reflection symmetry of Pb+Pb collisions 4 yields can be determined. Particle yield ratios in A+A (as well as elementary) collisions are consistent with statistical model predictions from threshold to the highest energies using only 3 parameters: a temperature T, a baryo-chemical potential and a strangeness suppression parameter . These parameters characterize the freezeout of particle composition after which only the momentum distributions further evolve via elastic scattering. An example of the results of the fit with the statistical model for central Pb + Pb collisions at 158 GeV [23] is shown in fig. 7 (left).
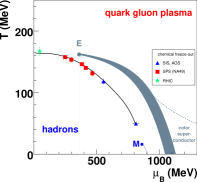
The resulting parameters T and [23] are plotted in the phase diagram of hadronic matter in fig. 7 (right) together with the phase boundary predicted by lattice QCD [3]. One observes that the freezeout points at SPS energies approach the phase boundary and and are closest to the critical point at about 60 GeV.


6 Indications for the onset of deconfinement
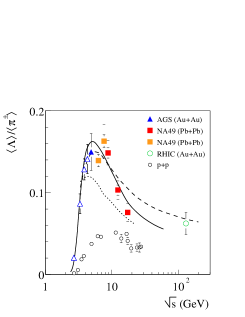
A detailed overview of the energy dependence of strangeness production is presented in fig. 8. The K/ ratio (left) shows a steep rise from the threshold of kaon production, a maximum around the lowest SPS energy and a decrease to a somewhat lower plateau value. Although the microscopic transport models RQMD, UrQMD [25] and the statistical hadron gas model (full equilibrium version () supplemented by the freezeout condition 1 GeV/hadron [24]) follow the gross trend, they do not reproduce the pronounced peak of the K/ ratio at the SPS. Since anti-baryon production yields are small, K counts essentially half of all quarks in the final state (the other half is contained in K0). In contrast quarks are distributed between anti-kaons and hyperons (mainly ) because of the large net baryon density at SPS energies. As a consequence of the rapid decrease of the net baryon density over the SPS energy range, the sharp peak in K/ is reflected in a break in the energy dependence of the K/ ratio (fig. 8 (center)) and a wider maximum in the ratio (fig. 8 (right)).

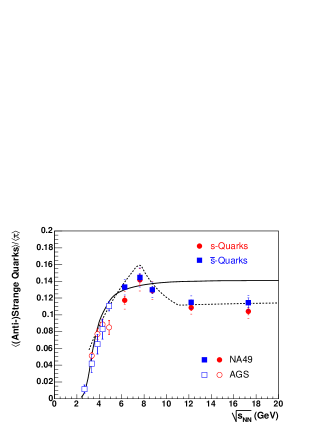
Using isospin symmetry as well as predictions from the hadron gas model for some unmeasured strange particle species one can obtain an estimate of the number of and valence quarks contained in the produced particles. The result shown in fig. 9 (left) demonstrates that there is a break in the energy dependence of total strangeness production at 30 GeV. Dividing by the pion multiplicity (fig. 9 (right)) confirms the sharp peak already seen in the K/ ratio. It has been pointed out that these features coincide with a transition from a baryon to a meson dominated final state [26]. However, as seen from the statistical model curve in fig. 9 (right) this effect cannot adequately describe the measurements.


A close approximation of the total strangeness to pion production ratio can also be calculated from measured yields via the observable E which is plotted in fig. 10 (left) as a function of collision energy. As expected, it shows the same sharp peak followed by a plateau as the K/ ratio, which is not seen in p+p collisions and not reproduced by hadronic models. On the other hand this feature can be understood in a reaction scenario with the onset of deconfinement around 30 GeV as proposed in the statistical model of the early stage (SMES [9], dash-dotted curve in fig. 10 (left)). ES reflects the behavior of the ratio of the number of s + quarks to entropy in the model. It shows a steep threshold rise while the system stays in the hadron phase but drops to the value expected in the QGP at higher collision energies when the fireball initially reaches the deconfined partonic phase. At the same transition energy of 30 GeV the rate of increase of the number of produced pions per participating nucleon (a measure of the entropy per baryon in the model) was predicted to increase. As seen in fig. 10 (center), this seems to be confirmed by the measurements for collisions of heavy nuclei, while there is no change in energy dependence for p+p reactions.
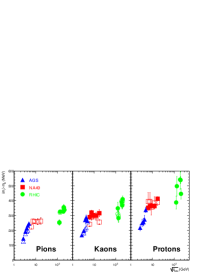
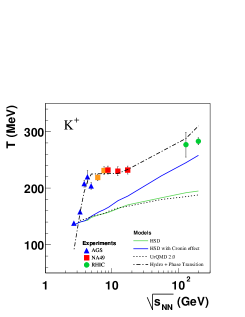
The transverse mass spectrum of kaons is well described by an exponential function . As shown in fig. 10 (right) for K+ the inverse slope parameter T rises steeply at low energies, stays at an approximately constant value through the SPS energy range and ends up slighly higher at RHIC energy. Similar behavior is seen for K- (not shown), but is not observed in p+p collisions. These features have been attributed [27] to the constant pressure and temperature when a mixed phase is present in the early stage of the reaction. In fact, a hydrodynamic calculation [28] modeling both the deconfined and the hadronic phases can provide a quantitative description (dash-dotted curve in fig. 10 (right)). The spectra of other abundantly produced particles are not well fitted by exponential functions (see e.g. fig. 2) but their shape can be characterised by the average value of the transverse mass minus the rest mass m0. The results in fig. 11 show that the near constancy of the slope of the spectra in the SPS energy range is a common feature for all these particles species.
7 Results on fluctuations
If the fireball freezeout occurs close to the boundary of a first order phase transition or near the QCD critical point then large event-to-event fluctuations may be expected. The NA49 detector was therefore designed with a large acceptance to allow for a wide range of fluctuation and correlation measurements.
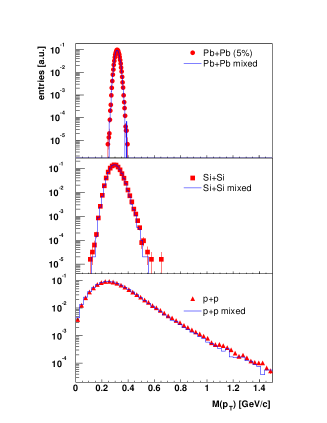
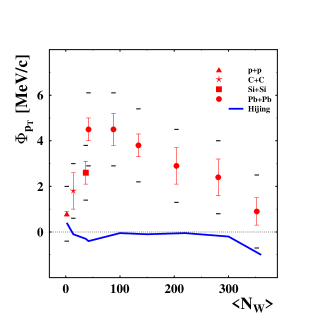
The average transverse momentum in the event is related to the temperature and radial flow in the fireball. The latter might fluctuate with the initial energy density and the fraction of deconfined matter at the early stage of the collision. The distributions for event-wise are shown in fig. 12 (left) for central Pb+Pb , Si+Si and p+p collisions at 158 GeV by the data points [29]. These are compared to results from mixed events (histograms) in which correlations are destroyed by construction while preserving the inclusive and multiplicity distributions. Clearly, the fluctuations are close to the statistical limit as represented by the mixed events and no distinct event classes are observed. A quantitative analysis was performed using the quantity which is defined to vanish for purely statistical fluctuations and which is furthermore independent of the number of collison participants in superposition models. The results for in the rapidity range are plotted versus collision system size in fig. 13 (left). The measured values are smaller than 5 MeV/c and thus below a few percent of the . Interestingly a significant system size dependence is observed with a maximum for peripheral Pb+Pb collisions. A similar dependence was found for the fluctuations of the multiplicity of negatively charged particles [10]. The two observations may be related due to a possible correlation between and multiplicity [30].
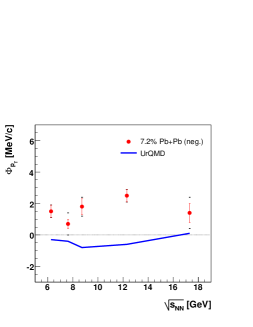
The energy dependence of the fluctuation measure at the SPS for central Pb+Pb collisions is plotted in fig. 13 (right). The observed values are small and approximately constant. Somewhat larger results have been obtained near midrapidity by experiment NA45 [31]. At RHIC the fluctuations increase substantially due to the rise of jet production [32].
Fluctuations of the K/ ratio are believed to increase near the critical point. It has also been pointed out [33] that at the onset of deconfinement there could be a significant decrease. The majority of strange quarks in the produced particles are contained in kaons at SPS and RHIC energies. The mass of strangeness carriers in the hadron phase (kaons) is much larger than the temperature whereas in the deconfined phase (strange quarks) it is smaller. Therefore fluctuations in the initial energy density at fixed collision energy are expected to lead to large fluctuations of the K/ ratio when the system stays in the hadronic phase. However, these K/ ratio fluctuations should significantly decrease if deconfinement occurs during the early stage of fireball evolution [9, 33]. The SMES model curve in fig. 10 (left) provides an illustration of this generic prediction when one looks at the change of the K/ ratio for small variations of the energy variable F in the respective regions.
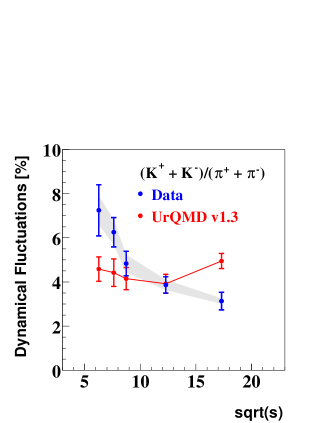
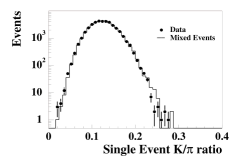
The (as well as ) ratio was extracted event by event with a maximum likelihood fit method for particles with laboratory momenta larger than 3 GeV/c in central Pb+Pb collisions at the five SPS energies [34]. The momentum cut is necessary to allow identification by specific energy loss of the particles in the TPCs. This leads to acceptances which shift to larger cms rapidities with increasing particle mass. An example of the distribution of the ratio at 158 GeV is shown in fig. 12 (right) where it is also compared to the results from mixed events (histogram) [35]. Clearly, both distributions are very similar and indicate that non-statistical fluctuations are small. Quantitatively, dynamical fluctuations were calculated by comparing the width of the ratio distribution to the one obtained for mixed events from the formula . As seen from fig. 14 (left) the dynamical fluctuations of the ratio amount to only around 5 % of the average ratio (about 0.15), but they show a decrease towards higher energy. Preliminary results from the STAR experiment at RHIC for higher energies also indicate values close to those at the highest SPS energy [36]. Such a behaviour is not seen in typical reaction models, e.g. UrQMD, but is consistent with the qualitative expectations from the onset of deconfinement [33].
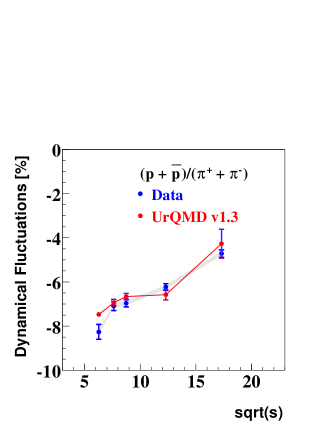
The dynamical fluctuations of the ratio are plotted for the five SPS energies in fig. 14 (right). The observed negative values are described quantitatively by the UrQMD model and are most likely due to the correlated production of p and via baryon resonances.
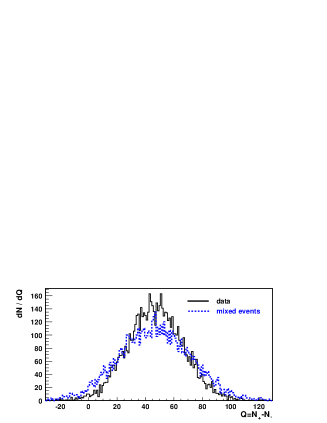
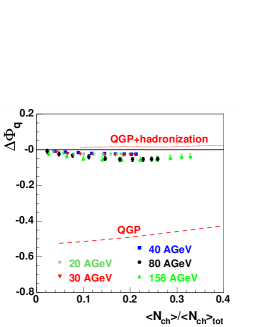
Electric charge fluctuations were predicted to be strongly reduced if the fireball passed through a QGP phase [37]. Fig. 15 (left) depicts the distribution of net charge in the papidity range for central Pb+Pb collisions at 158 GeV as an example. As a consequence of charge conservation the data (full histogram) display a narrower distribution than mixed events in which this effect is removed. Fig. 15 (right) shows the measurements of electric charge fluctuations in terms of the variable [38] in which effects of global charge conservation are subtracted. Neither significant energy dependence nor the predicted reduction are observed. However, more recent model calculations suggest that hadronisation effects [39] and at SPS also resonance decays [40] probably mask the reduction.

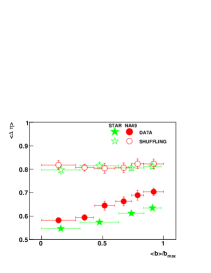
A first order phase transition from the deconfined to the hadronic phase during the early stage of Pb+Pb collisions is expected to result in a softening of the equation of state and consequently in a long lifetime of the mixed phase. The study of the balance function (BF) was suggested as a method to investigate the time of hadron formation [41]. In many models pions are assumed to be created in charge neutral pairs. Due to the buildup of longitudinal flow and rescattering during the evolution of the fireball, the rapidity correlation of opposite charges will be diluted for pairs formed early in the process but will remain narrow for late hadronisation as expected in a mixed phase scenario. This correlation is quantified by the BF which is plotted as a function of the pseudorapidity difference of the pairs in fig. 16 (left). The data are compared to shuffled events, in which the pseudo rapidities of the particles are scrambled while the charges are retained. In this way one obtains an estimate of the maximum decorrelation under the condition of charge conservation. It is evident that the data show increasingly shorter range opposite charge correlations beyond the effects of charge conservation as the centrality of Pb+Pb collisions increases.
The widths are calculated numerically from the BF distributions and the results are plotted in fig. 16 (right,top) for the top SPS energy [42] and for RHIC [43]. The width decreases by 17 % respectively 14 % for central compared to peripheral collisions for data while it remains constant for shuffled events. Thus the predicted narrowing is observed, although it is now believed that a large part of this effect is due to the increasing strength of radial flow. In fact a model assuming hadron formation by quark coalescence as well as collective radial flow can reproduce the observed width of the BF [44].
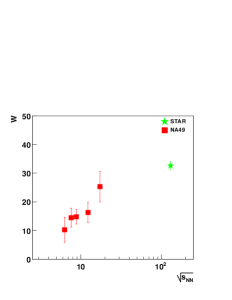
In order to be able to compare measurements at different energies and with different acceptance one may calculate the normalized difference (in percent) W = )/ of the widths of the BF for shuffled and real events. The energy dependence of the normalised narrowing parameter W is plotted in fig. 16 (right,bottom). It shows a steady rise, i.e. more narrowing of the BF with respect to uncorrelated particle production throughout the SPS energy range up to RHIC. One does not observe a significant structure at 30 GeV, where other observables suggest the onset of deconfinement.
8 Conclusions
Results from a comprehensive study of nucleus–nucleus collisions in the SPS energy range were presented. The produced matter shows strong transverse and longitudinal flow. Ratios of yields of produced particles are approximately consistent with statistical equilibration. The freezeout parameters of the hadron composition are close to the phase boundary predicted by QCD. The main charcteristics of nucleus–nucleus collisions at the highest SPS energy are quite similar to those found at RHIC.
The energy scan of central Pb+Pb collisions revealed that at around 30 GeV the ratio of strangeness to pion production shows a sharp maximum, the rate of increase of the produced pion multiplicity per wounded nucleon increases and the effective temperature of pions and kaons levels to a constant value. These features are not reproduced by present hadronic models but find a natural explanation in a reaction scenario with the onset of deconfinement in the early stage of the reaction at low SPS energy. Further support for this scenario is provided by the decrease of fluctuations of the K/ ratio in the SPS energy range. On the other hand, measurements of fluctuations of the average transverse momentum, of the electric charge, as well as of correlations such as the balance function and Bose-Einstein correlations exhibit a smooth energy dependence.
The present results suggest that further study of the role of the initial volume in the onset of deconfinement and the search for the predicted critical point of QCD are of great interest. This led to an initiative for a low energy program at RHIC [45] and the proposal of a future light-ion program at the SPS [46, 47].
9 Acknowledgement
My sincere thanks to the organizers of the XLVI School of Theoretical Physics in Zakopane 2006 for supporting my attendance and inviting me to present a review of results from the NA49 experiment. I would also like to express my gratitude to all members of the NA49 collaboration for their hard and diligent work that produced the comprehensive results presented in this lecture.
References
- [1] J. Collins and M. Perry, Phys. Rev. Lett. 34 1353 (1975).
- [2] F. Karsch, E. Laermann and A. Peikert, Nucl. Phys. B605 290 (2002).
- [3] Z. Fodor and S. Katz, J. High Energy Phys., JHEP 0404 50 (2004).
- [4] M. Stephanov, K. Rajagopal and E. Shuryak, Phys. Rev. Lett. 81 4816 (1998).
- [5] for review of recent results see Proceedings of the 17th International Conference on Ultra–Relativistic Nucleus–Nucleus Collisions, Quark Matter 2004, eds.: H. G. Ritter and X.–N. Wang, J. Phys. G 30 (2004).
- [6] review of QGP signatures: J. Harris and B. Müller, Annu. Rev. Nucl. Part. Sci. 46 (1996) 71.
- [7] T. Alber et al., Phys. Rev. Lett. 75 3814 (1995).
- [8] see: http://cern.web.cern.ch/CERN/Announcements/2000/NewStateMatter/
- [9] M. Gaździcki and M. I. Gorenstein, Acta Phys. Polon. B30 2705 (1999).
- [10] M. Gazdzicki (NA49 collaboration), J. Phys. G 30 S701 (2004).
- [11] S. Afanasiev et al., Nucl. Instrum. Meth. A430 210 (1999).
- [12] S. Afanasiev et al., Phys. Rev. C66 054902 (2002); T. Anticic et al., Phys. Rev. Lett. 93 022302 (2004); C. Alt et al., J. Phys. G30 S119 (2004).
- [13] H. Appelshäuser et al., Phys. Lett. B444 523 (1998); T. Anticic et al., Phys. Rev. Lett. 93 022302 (2004).
- [14] C. Alt et al., Phys. Rev. Lett. 94 192301 (2005).
- [15] see e.g. U. Heinz and P .Kolb, Phys. Rev. C65 054909 (2000).
- [16] F. Retiere and M. Lisa, Phys. Rev. C70 044907 (2004).
- [17] F. Antinori et al., J. Phys. G30 823 (2004).
- [18] H. Appelshäuser et al., Eur. Phys. J. C2 661 (1998).
- [19] M. Borysova et al., Phys. Rev. C73 024903 (2006).
- [20] C. Alt et al., Phys. Rev. C68 034903 (2003).
- [21] G. Stefanek (NA49 collaboration), Nucl. Phys. A774 499 (2006).
- [22] D. Teaney et al., Phys. Rev. Lett. 86 4783 (2001).
- [23] see e.g. F. Becattini et al., Phys. Rev. C69 024905 (2004).
- [24] J. Cleymans and K. Redlich, Phys. Rev. Lett. 81 5284 (1998).
- [25] RQMD: F. Wang et al., Phys. Rev. C61 064904 (2000); UrQMD: H.Weber et al., Phys. Lett. B545 285 (2002).
- [26] J. Cleymans et al., Phys. Lett. B615 50 (2005).
- [27] M. Gorenstein, M. Gazdzicki and K. Bugaev, Phys. Lett. B567 175 (2003).
- [28] F. Hama et al.,Acta Phys. Polon. B35 179 (2004).
- [29] T. Anticic et al., Phys. Rev. C70 034902 (2004).
- [30] St. Mrowczynski et al., Phys. Rev. C70 054906 (2004).
- [31] D. Adamova et al., Nucl. Phys. A 727 97 (2003).
- [32] J. Adams et al., Phys. Rev. C71 064906 (2005).
- [33] M. Gorenstein et al., Phys. Lett. B585, 237 (2004).
- [34] C. Roland (NA49 collaboration), J. Phys. G: Nucl. Part. Phys. 30 S1381 (2004).
- [35] H. Appelshäuser et al.,Phys. Lett. B459 679 (1999).
- [36] S. Das (STAR collaboration), nucl-ex/0503023 (contribution SQM2005) and contribution SQM2006.
- [37] S. Jeon and V. Koch, Phys. Rev. Lett. 85 2076 (2000); M. Asakawa et al., Phys. Rev. Lett. 85 2072 (2000).
- [38] C. Alt et al., Phys. Rev. C70 064903 (2004).
- [39] A. Bialas, Phys. Lett. B532 249 (2002).
- [40] J. Zaranek, Phys. Rev. C66 024905 (2002).
- [41] S. Bass et al., Phys. Rev. Lett. 85 2689 (2000).
- [42] C. Alt et al., Phys. Rev. C71 034903 (2005).
- [43] J. Adams et al., Phys. Rev. Lett. 90 172301 (2003).
- [44] A. Bialas, Phys. Lett. B579 31 (2004).
-
[45]
Proceeding of the RIKEN BNL Workshop: Can we Discover the QCD
Critical Point at RHIC ?, BNL-75692-2006
website: https://www.bnl.gov/riken/QCDRhic . - [46] J. Bartke et al., A new experimental programme with nuclei and proton beams at the CERN SPS, CERN-SPSC-2003-038(SPSC-EOI-01) and presentations at the Villars workshop (2004).
- [47] N. Antoniou et al., Study of hadron production in collisions of protons and nuclei at the CERN SPS, CERN-SPSC-2006-001(SPSC-I-235).