Energy Dependence of Multiplicity Fluctuations
in Heavy Ion Collisions
Abstract:
The energy dependence of multiplicity fluctuations was studied for the most central collisions at , , , and GeV by the NA49 experiment at the CERN SPS. The multiplicity distribution for negatively and positively charged hadrons is significantly narrower than Poisson one for all energies. No significant structure in energy dependence of the scaled variance of multiplicity fluctuations is observed. The measured scaled variance is lower than the one predicted by the grand-canonical formulation of the hadron-resonance gas model. The results for scaled variance are in approximate agreement with the string-hadronic model UrQMD.
1 Introduction
At high energy densities () a phase transition from hadron gas to quark-gluon-plasma (QGP) is expected to occur. There are indications that at RHIC and top SPS energies quark-gluon-plasma is created at the early stage of heavy ion collisions [1, 2]. The energy dependence of various observables show anomalies at low SPS energies which might be related to the onset of deconfinement [3]. Lattice QCD calculations suggest furthermore the existence of a critical point in the phase diagram of strongly interacting matter which separates the line of the first order phase transition from a crossover. Models predict an increase of multiplicity fluctuations near the onset of deconfinement [4] or the critical point [7].
This motivates a vigorous experimental and theoretical study of multiplicity fluctuations in high energy nuclear collisions [5, 6]. In addition to the effects mentioned above also the “background” statistical fluctuations are interesting to study. In a grand-canonical statistical model scaled variance 111 a commonly used measure of fluctuations, , where and are variance and mean of multiplicity distributions, respectively. is close to one. In the past it was commonly believed that the result of the grand-canonical, canonical and micro-canonical ensemble should be similar in the infinite volume limit, like it is for mean quantities. Recent calculations showed that this assumption is wrong. The scaled variance in the infinite volume limit is largest for the grand-canonical ensemble and smallest for the micro-canonical one [8, 9]. It is because the fluctuations in the canonical and micro-canonical ensembles are reduced by conservation laws and this reduction is, unlike for the mean, volume independent for .
The first preliminary results on the energy dependence of multiplicity fluctuations in central collisions at SPS energies were presented in this paper in order to look for experimental signatures of increased fluctuations due to a phase transition or the critical point and for the predicted reduction of fluctuations in relativistic hadron gas due to conservation laws.
2 The NA49 Experiment
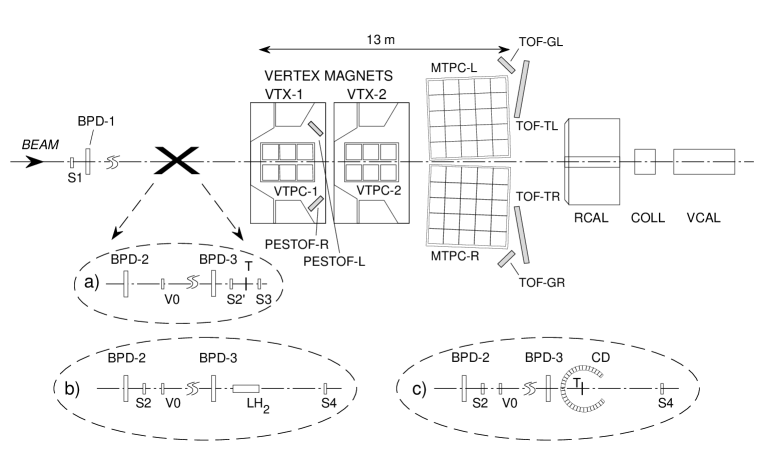
The NA49 detector [10] (see figure 1) is a large acceptance fixed target hadron spectrometer. Its main devices are four large time projection chambers (TPCs). Two of them, called vertex TPCs, are located in two superconducting dipole magnets with a total bending power of Tm. The other two TPCs are installed behind the magnets left and right of the beam line allowing precise particle tracking in the high density region of heavy ion collisions. The measurement of the energy loss allows particle identification and a good rejection of electrons in a large momentum regime.
A large variety of different colliding systems was studied. Beams of p and Pb are available at the CERN SPS directly, C and Si beams were produced via fragmentation of the primary Pb beam. Targets of liquid hydrogen or solid foils of different materials were used. Data on central collisions at , , , and GeV were recorded and analysed for this analysis.
2.1 Centrality Determination
The downstream veto calorimeter, originally designed for NA5, allows a determination of the centrality of a collision by measuring the energy in the projectile spectator region [11].
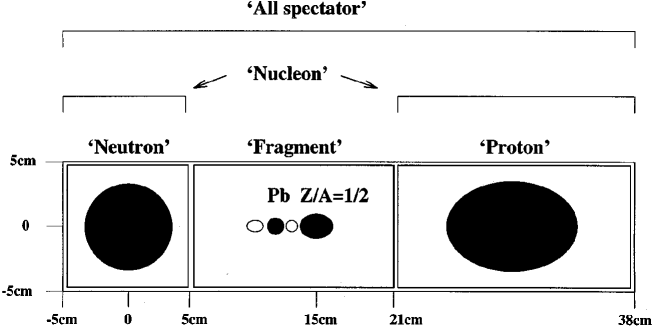
A collimator is located m downstream from the target and is adjusted for each energy in such a way that all projectile spectator protons, neutrons and fragments can reach the veto calorimeter. For GeV the hole in the collimator is with respect to the beam axis cm in vertical direction and cm and cm in horizontal direction taking into account the deflection of charged particles by the magnetic field (figure 2). For and GeV the hole is cm in vertical and cm respectively cm in horizontal direction. For and GeV the ring calorimeter with a hole of radius cm and positioned m away from the target and cm away from beam axis in horizontal direction is used as a collimator. For higher energies the ring calorimeter is positioned cm off in horizontal direction and has only a small influence on the acceptance of the veto calorimeter.
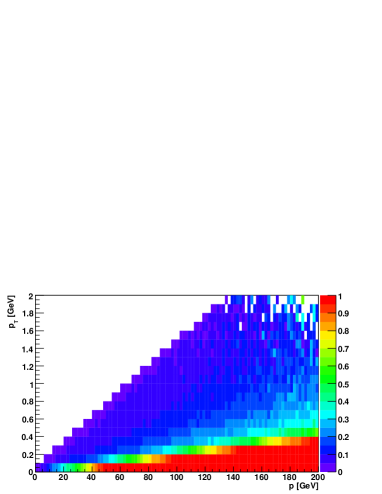
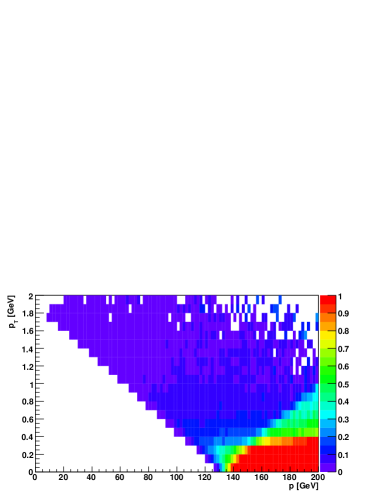
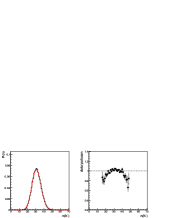
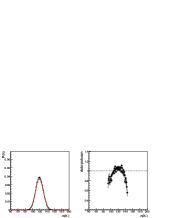
For the following analysis the collisions are selected according to their energy in the veto calorimeter. A large fraction of the Veto energy is due to projectile spectators. However also a fraction of non-spectator particles, mostly protons and neutrons, contribute to Veto energy. The acceptance of the Veto calorimeter at GeV is shown in figure 3 for neutral and positively charged particles.
The centrality of an event with a veto energy can be calculated using the known trigger centrality and the veto energy distribution as:
| (1) |
where is the Veto energy distribution for a given trigger.
2.2 Track Selection
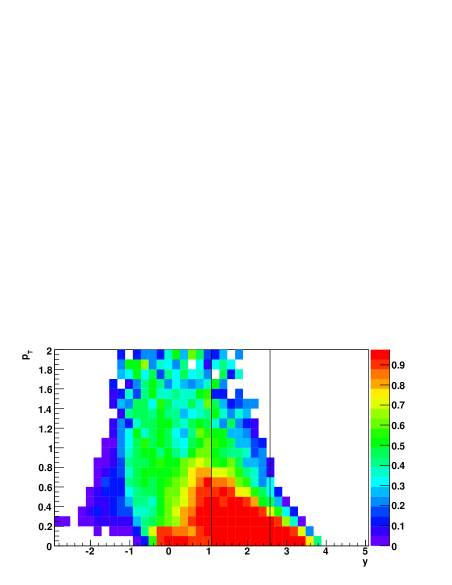
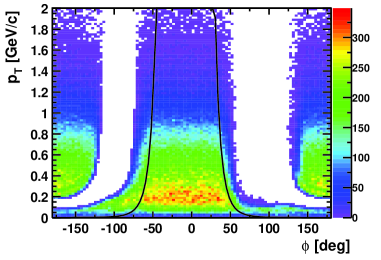
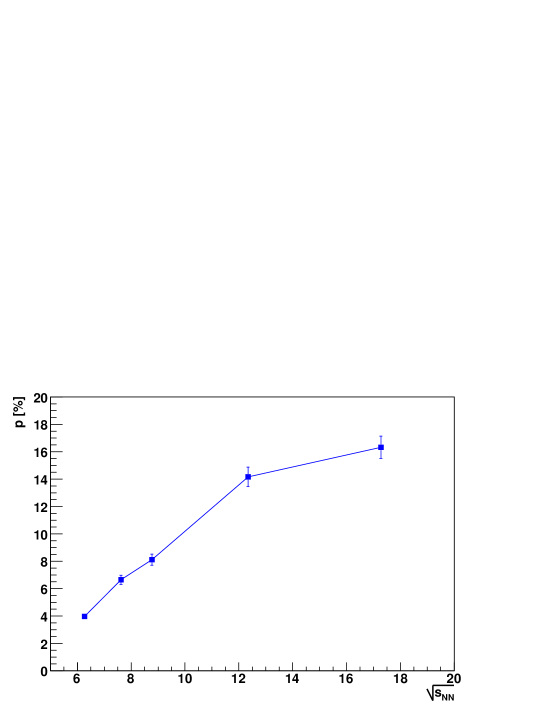
Since detector effects like track reconstruction efficiency might have a large influence on multiplicity fluctuations, it is important to select a very clean track sample for the analysis (figure 4). Therefore the acceptance for this analysis is limited to a part of the forward hemisphere, where the NA49 detector has the highest tracking efficiency. This was done by restricting the analysis to the rapidity interval 222Rapidity is calculated in the center of mass system assuming pion mass. for to GeV and for GeV333A different rapidity cut is used for this energy because of missing geometrical acceptance near beam rapidity [14].. In addition a cut on transverse momentum according to [13] was applied, which is dependent both on rapidity and azimuthal angle. This ensures that only tracks with sufficient points both in the vertex TPC 2 and in one of the main TPCs are used. For them the reconstruction efficiency is larger than . The disadvantage of this track selection is that the fraction of accepted tracks is small and depends on collision energy, see figure 5.
A cut on the distance between the interaction point and the track trajectory extrapolated to the target is used to reduce the background of secondary particles
originating from weak decays (track impact parameter)444The difference has to be smaller than cm orthogonal and cm parallel to the magnetic field direction..
Removing this cut would change the scaled variance by less than .
A cut on the energy loss of particles in the detector gas () removes electrons and allows the study of hadron multiplicity fluctuations only.
The scaled variance will be less than different if this cut is removed.
3 Fluctuation Analysis
The multiplicity distribution in central () collisions at GeV is shown in figure 6.
The measured distribution is significantly narrower than a Poisson one.
The basic measure of multiplicity fluctuations used in this analysis is the scaled variance:
| (2) |
where and are variance and mean of multiplicity distributions, respectively.
The scaled variance for positively (), negatively () and all charged hadrons () will be presented.


The scaled variance of a Poisson distribution is 1, independent of its mean multiplicity. A larger might indicate additional non-statistical fluctuations, a smaller might be a hint for a suppression of fluctuations e.g. due to conservation laws.
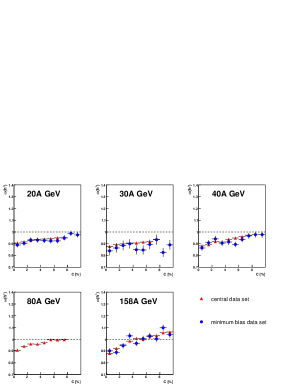
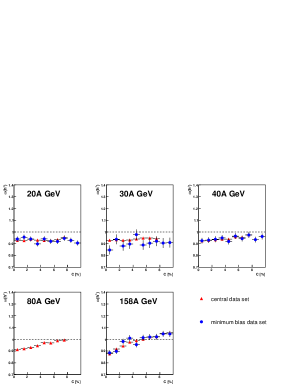
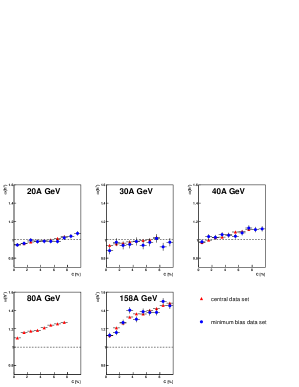
Figure 7 shows the centrality dependence of multiplicity fluctuations in collisions at different energies for central collisions. In general decreases with increasing centrality (i.e. decreasing Veto energy), this trend is stronger for higher energies.
The results for collisions selected by minimum bias and central on-line trigger are shown separately in figure 7 and they agree within errors. For further analysis the results for central data sets are used because of larger statistics in comparison to the minimum bias data sets.
3.1 Experimental Biases
In superposition models (e.g. the Wounded Nucleon Model [12]) the total number of particles produced in a collision is the sum of the number of particles produced by different independent particle production sources:
| (3) |
In these models the scaled variance has two contributions. The first is due to the fluctuations of the number of particles emitted by a single source , the second is due to the fluctuations in the number of sources :
| (4) |
where is the mean multiplicity of hadrons from a single source.
The number of sources related to projectile participants is fixed by fixing the
energy detected in the Veto Calorimeter and consequently the number of projectile spectators (see chapter 2.1).
For very central collisions analysed here the Veto energy is dominated by the energy of forward going participants and not spectators. For these collisions the number of projectile participants is in good approximation fixed and independent of Veto energy. Therefore no correction for the finite width of the Veto energy bins is applied.
The finite resolution of the Veto calorimeter introduces additional fluctuations in even for a fixed Veto energy. For very central collisions their influence on the scaled variance is estimated to be small, in contrast to peripheral collisions. The data is not corrected for this effect, introducing a correction would reduce the scaled variance by less than .
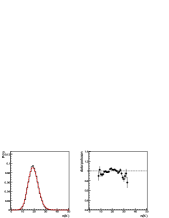
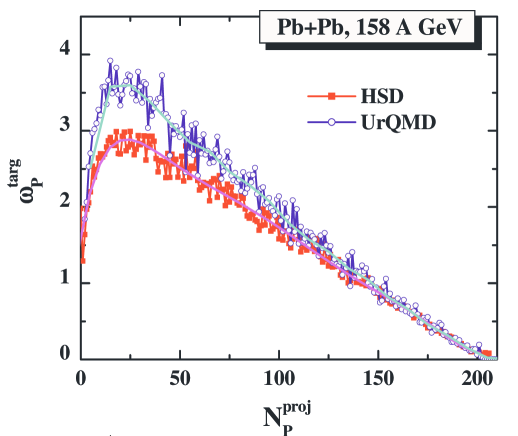
In the NA49 experiment the number of target participants is not fixed, it fluctuates substantially (see figure 8).
These fluctuations might contribute even to multiplicity fluctuations in the forward hemisphere and increase the scaled variance [14, 16].
Model calculations (HSD, UrQMD) [15] show that the scaled variance of target participant fluctuations
is
small for central collisions, and thus the corresponding increase of the scaled variance of multiplicity distributions is also expected to be small.
In order to minimize the contribution due to both Veto calorimeter resolution and fluctuations further analysis was done for very central collisions (, which corresponds to ).
The systematic error is estimated taking into account the influence of the track impact parameter cut (), the cut on electron rejection (), the effect of finite resolution of the Veto calorimeter () and possible remaining participant fluctuations due to the finite width of the selected centrality bin (). The total systematic error is estimated to be .
Model calculations (Venus and UrQMD) show that for higher energies ( and GeV) the details of centrality selection have a significant effect on multiplicity fluctuations. When the centrality is determined by fixing the number of projectile spectators the scaled variance obtained by these models is up to larger than the one obtained by fixing the energy in the Veto Calorimeter using a detailed simulation of its acceptance. For lower energies (- GeV) no significant difference of the scaled variance for different centrality selections was observed.
4 Results and Discussion
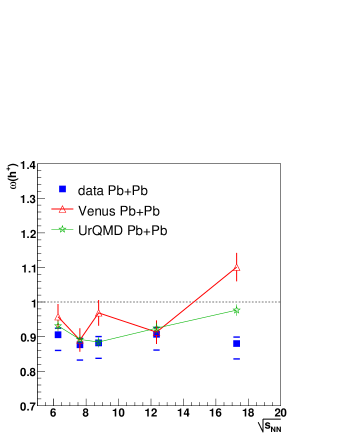
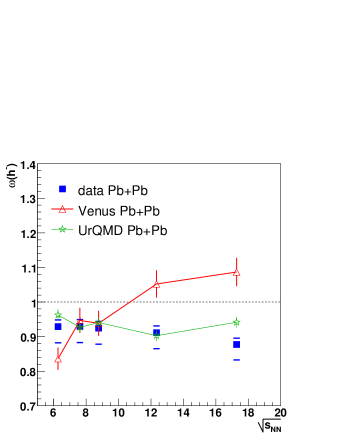
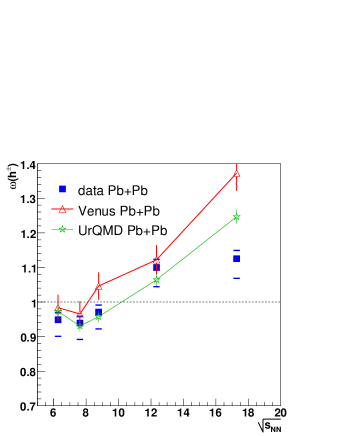
The results on energy dependence of multiplicity fluctuations in collisions are shown in figure 9. It can be seen that at all energies the scaled variance for positively and negatively charged hadrons is smaller than , the value for a Poissonian distribution.
A model independent comparison of results at different energies is not possible because the acceptance is different for each energy (figure 5).
The scaled variance for all charged hadrons is larger than the scaled variance for positively and negatively charged hadrons. This is probably due to the effect of resonance decays which correlated final state hadrons and thus leads to an increase of fluctuations. This effect is largest for all charged hadrons as the majority of resonances decay into one positively and one negatively charged daughter. It is smallest for negatively charged hadrons as only a very few resonances decay into two negatively charged hadrons (e.g. ).
The multiplicity fluctuations of all charged hadrons in collisions at the top SPS energy have been studied previously by WA98 [6]. A direct comparison of scaled variance of multiplicity distributions obtained in NA49 to the results of WA98 is not possible because of different experimental acceptance and centrality selection. The WA98 results were obtained in a pseudorapidity region around midrapidity (), whereas the NA49 results are obtained in the forward hemisphere (). The centrality of the collisions in WA98 was determined by fixing transverse energy in a calorimeter located in the pseudorapidity interval . In contrast in NA49 centrality is fixed using the energy in the forward Veto calorimeter (see section 2.1).
4.1 String- Hadronic Models
For a comparison of data to string hadronic models (Venus [17] and UrQMD [18]) the model predictions were calculated in the data acceptance. The centrality selection in the models is done in a similar way as in the data by a detailed simulation of the acceptance of the Veto Calorimeter.
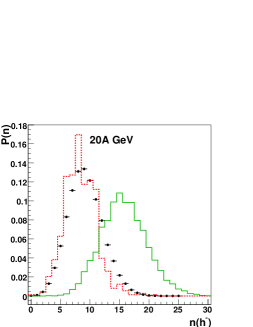
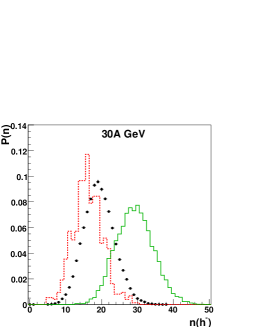
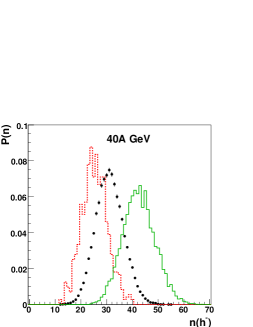
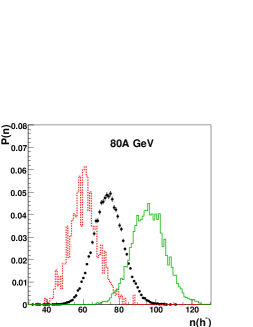
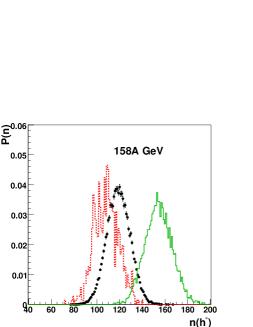
The multiplicity distributions for negatively charged hadrons in data and models are compared in figure 10. In comparison to data the multiplicity distributions in Venus are shifted towards lower multiplicities, whereas in UrQMD they are shifted towards higher multiplicities.
Figure 9 shows a comparison of the scaled variance between data and the predictions of the Venus and UrQMD model. The Venus model overpredicts scaled variance for central collisions at most energies. In general the scaled variance obtained by the UrQMD model is in agreement with data. Only for and at GeV as well as for at and GeV the differences are significant.
4.2 Acceptance Dependence
Only a fraction of all produced particles is used for scaled variance determination in the experiment. A simple parametrisation of the acceptance dependence of would be useful for comparison of different energies and a comparison to models. In Appendix A a derivation of a simple formula describing the dependence of the scaled variance on the acceptance is given. It is obtained under the assumption that all particles are produced independently in momentum space. If a fraction of all particles is accepted, the scaled variance is related to the scaled variance in as: (see equation 11).
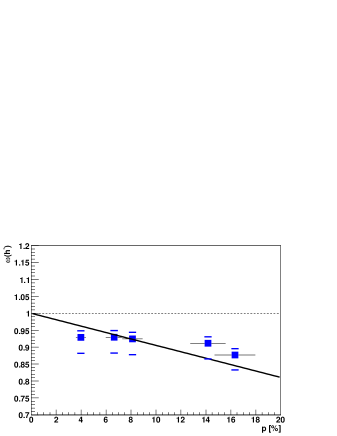
In figure 11 the fluctuations of negative hadrons for the five analysed energies are plotted as a function of the fraction of accepted tracks.
If the simple acceptance dependence 11 works and if the scaled variance in is similar for all energies, the data points
for all five energies should lie on a common straight line which starts at for .
It can be seen that the data seem to follow approximately the predicted scaling. A more detailed study of rapidity and transverse momentum dependence of multiplicity
fluctuations is in progress, but first results indicate that the acceptance scaling seen in figure 11
should be considered only as a rough approximation.
For this scaling does not work so well probably because a larger fraction of resonance decays (e.g. ) into two positively charged daughters,
introducing more correlation in momentum space.
The situation is even worse for because both daughters of a decay into two unlike sign charged hadrons (e.g. )
are used for the fluctuation analysis.
Therefore acceptance scaling plots are shown only for .
4.3 Statistical Models
Predictions of the statistical hadron-resonance gas model [19] on energy dependence of the scaled variance of negatively charged hadrons are shown in figure 12. In this model multiplicity fluctuations in were calculated for the limit of using both canonical and grand-canonical ensembles. The effects of resonance decays and quantum statistics are taken into account. The calculated value for the canonical ensemble is much lower than for the grand-canonical one in the SPS energy regime. In the canonical ensemble fluctuations are suppressed due to conservation laws of electric charge, baryon number and strangeness by about a factor of two. Preliminary calculations show a further suppression of fluctuations in the micro-canonical ensemble due to additional energy conservation.
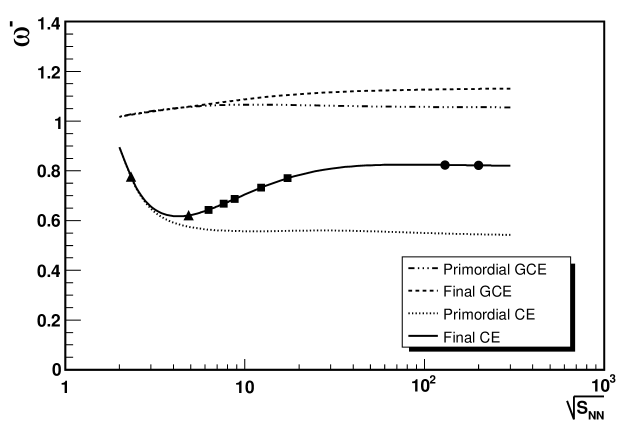
Figure 13 shows data on multiplicity fluctuations in comparison to the model calculations.
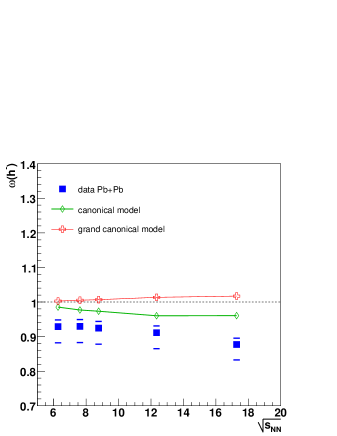
The scaled variance in the limited acceptance was extrapolated using equation 11 from the model results in full acceptance. As discussed above equation 11 may be considered as a reasonable approximation only for . Use of equation 11 introduces an uncertainty in the comparison of data and model. Note also that in the model calculations the volume of the fireball is fixed, but in data the energy in the Veto calorimeter.
The comparison in figure 13 shows that multiplicity fluctuations in data are much lower than predicted by the grand-canonical model. This is an indication of suppression of fluctuations in relativistic gases due to conservation laws. The predictions of the canonical ensemble are also higher than the data. Energy- momentum conservation and the finite volume of hadrons are expected to cause an additional suppression of fluctuations.
5 Summary
Multiplicity fluctuations in the most central collisions at , , , and GeV were studied by NA49 at CERN SPS. At all energies multiplicity distributions for positively and negatively charged hadrons are significantly narrower than a corresponding Poissonian distribution.
In comparison to data the multiplicity distributions in Venus are shifted towards lower multiplicities, whereas in UrQMD they are shifted towards higher multiplicities. The Venus model overpredicts scaled variance for central collisions at most energies, whereas the scaled variance obtained by the UrQMD model is in approximate agreement with data.
Non-monotonic energy dependence of fluctuations, which might be related to the onset of deconfinement or a critical point, is not observed in data.
The hadron-resonance gas model [19] in grand-canonical formulation overpredicts the measured scaled variance. Introduction of the material conservation laws (canonical model) improve agreement with the data.
The presented results may be the first experimental observation of the effect of conservation laws in relativistic gases.
Acknowledgements: Acknowledgements: This work was supported by the US Department of Energy Grant DE-FG03-97ER41020/A000, the Bundesministerium fur Bildung und Forschung, Germany, the Virtual Institute VI-146 of Helmholtz Gemeinschaft, Germany, the Polish State Committee for Scientific Research (1 P03B 006 30, 1 P03B 097 29, 1 PO3B 121 29, 1 P03B 127 30), the Hungarian Scientific Research Foundation (T032648, T032293, T043514), the Hungarian National Science Foundation, OTKA, (F034707), the Polish-German Foundation, the Korea Science & Engineering Foundation (R01-2005-000-10334-0) and the Bulgarian National Science Fund (Ph-09/05).
Appendix A Acceptance Dependence of Scaled Variance
Let us assume that particles are emitted independently in momentum space.
For a given total number of produced particles , the probability to measure a number of particles in a
fixed acceptance is a binomial distribution.
| (5) |
Consequently the mean number of accepted particles is
| (6) |
and the variance of the binomial distributions is
| (7) |
If one allows the total number of produced particles to vary according to distribution , the probability to measure a number of particles is
| (8) |
The mean number of particles the in acceptance is
| (9) |
The variance of is given by:
| (10) |
Finally the scaled variance is
| (11) |
or
| (12) |
where is the scaled variance of .
References
- [1] U. W. Heinz and M. Jacob, “Evidence for a new state of matter: An assessment of the results from the CERN lead beam programme,” arXiv:nucl-th/0002042.
- [2] M. Gyulassy and L. McLerran, “New forms of QCD matter discovered at RHIC,” Nucl. Phys. A 750 (2005) 30 [arXiv:nucl-th/0405013].
- [3] M. Gazdzicki et al. [NA49 Collaboration], “Report from NA49,” J. Phys. G 30 (2004) S701 [arXiv:nucl-ex/0403023].
- [4] M. Gazdzicki, M. I. Gorenstein and S. Mrowczynski, “Fluctuations and deconfinement phase transition in nucleus nucleus collisions,” Phys. Lett. B 585 (2004) 115 [arXiv:hep-ph/0304052].
- [5] M. Rybczynski et al. [NA49 Collaboration], “Multiplicity fluctuations in nuclear collisions at 158-A-GeV,” J. Phys. Conf. Ser. 5 (2005) 74 [arXiv:nucl-ex/0409009].
- [6] M. M. Aggarwal et al. [WA98 Collaboration], “Event-by-event fluctuations in particle multiplicities and transverse energy produced in 158-A-GeV Pb + Pb collisions,” Phys. Rev. C 65 (2002) 054912 [arXiv:nucl-ex/0108029].
- [7] M. A. Stephanov, K. Rajagopal and E. V. Shuryak, “Event-by-event fluctuations in heavy ion collisions and the QCD critical point,” Phys. Rev. D 60 (1999) 114028 [arXiv:hep-ph/9903292].
- [8] V. V. Begun, M. Gazdzicki, M. I. Gorenstein and O. S. Zozulya, “Particle Number Fluctuations in Canonical Ensemble,” Phys. Rev. C 70 (2004) 034901 [arXiv:nucl-th/0404056].
- [9] V. V. Begun, M. I. Gorenstein, A. P. Kostyuk and O. S. Zozulya, “Particle Number Fluctuations in the Microcanonical Ensemble,” Phys. Rev. C 71 (2005) 054904 [arXiv:nucl-th/0410044].
- [10] S. Afanasev et al. [NA49 Collaboration], “The NA49 large acceptance hadron detector,” Nucl. Instrum. Meth. A 430 (1999) 210.
- [11] H. Appelshauser et al. [NA49 Collaboration], “Spectator nucleons in Pb + Pb collisions at 158-A-GeV,” Eur. Phys. J. A 2 (1998) 383.
- [12] A. Bialas, M. Bleszynski and W. Czyz, “Multiplicity Distributions In Nucleus-Nucleus Collisions At High-Energies,” Nucl. Phys. B 111 (1976) 461.
- [13] C. Alt et al. [NA49 Collaboration], “Electric charge fluctuations in central Pb + Pb collisions at 20-AGeV, 30-AGeV, 40-AGeV, 80-AGeV and 158-AGeV,” Phys. Rev. C 70 (2004) 064903 [arXiv:nucl-ex/0406013].
- [14] M. Rybczynski et al. [NA49 Collaboration], “Centrality and System Size Dependence of Multiplicity Fluctuations,” this issue
- [15] V. P. Konchakovski, S. Haussler, M. I. Gorenstein, E. L. Bratkovskaya, M. Bleicher and H. Stoecker, “Particle number fluctuations in high energy nucleus nucleus collisions from microscopic transport approaches,” Phys. Rev. C 73 (2006) 034902 [arXiv:nucl-th/0511083].
- [16] M. Gazdzicki and M. Gorenstein, “Transparency, mixing and reflection of initial flows in relativistic nuclear collisions,” Phys. Lett. B 640 (2006) 155 [arXiv:hep-ph/0511058].
- [17] K. Werner, “Strings, pomerons, and the venus model of hadronic interactions at Phys. Rept. 232 (1993) 87.
- [18] S. A. Bass et al., “Microscopic models for ultrarelativistic heavy ion collisions,” Prog. Part. Nucl. Phys. 41 (1998) 225 [arXiv:nucl-th/9803035].
- [19] V. V. Begun, M. I. Gorenstein, M. Hauer, V. P. Konchakovski and O. S. Zozulya, “Multiplicity fluctuations in hadron-resonance gas,” Phys. Rev. C 74 (2006) 044903 [arXiv:nucl-th/0606036].