New measurement of neutron capture resonances of 209Bi
Abstract
The neutron capture cross section of 209Bi has been measured at the CERN nTOF facility by employing the pulse height weighting technique. Improvements over previous measurements are mainly due to an optimized detection system, which led to a practically negligible neutron sensitivity. Additional experimental sources of systematic error, like the electronic threshold in the detectors, summing of -rays, internal electron conversion, and the isomeric state in bismuth, have been taken into account. -Ray absorption effects inside the sample have been corrected by employing a non-polynomial weighting function. Since 209Bi is the last stable isotope in the reaction path of the stellar -process, the Maxwellian averaged capture cross section is important for the recycling of the reaction flow by decays. In the relevant stellar range of thermal energies between keV and 8 keV our new capture rate is about 16% higher than the presently accepted value used for nucleosynthesis calculations. At this low temperature an important part of the heavy Pb-Bi isotopes are supposed to be synthesized by the -process in the He shells of low mass, thermally pulsing asymptotic giant branch stars. With the improved set of cross sections we obtain an -process fraction of 193% of the solar bismuth abundance, resulting in an -process residual of 813%. The present () cross section measurement is also of relevance for the design of accelerator driven systems based on a liquid metal Pb/Bi spallation target.
pacs:
25.40.Lw,27.80.+w,97.10.CvI Introduction
209Bi is the end point isotope of the -process path. Its observed abundance has been finally understood in terms of the main -process component, operating in the He-shell of low mass, low metallicity, thermally pulsing asymptotic giant branch (agb) stars Travaglio et al. (1999, 2001).
However, the complex production pattern at the end of the -process path still hides important information, that can be unraveled by means of accurate neutron capture measurements. Capture on bismuth leads to the ground state of 210Bi, which -decays to 210Po that is -unstable, producing 206Pb (see Fig. 1).
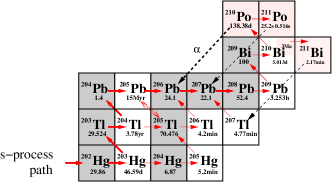
However, given the 210Po half-life of 138 days it can also act as a branching point by capturing another neutron and enhancing the abundance of 207Pb instead. Another contribution to 207Pb may be due to a long-lived isomer in 210Bi at 271 keV. Neutron capture on this isomer leads to 211Bi with an -decay half-life of 2.17 min. The two branchings, at 210Po and 210Bi, depend strongly on the stellar conditions of neutron density and temperature. Given an appropriate stellar model and accurate neutron capture cross sections, the abundances of the Pb/Bi isotopes can be more reliably determined, thus providing a better decomposition of the respective -process abundances and of the radiogenic contributions due to the Th/U decays. The latter information represents a viable constraint on the Th/U abundances calculation and its use as cosmochronometers Cowan et al. (1991); Kratz et al. (2004).
For the discussion of these astrophysical aspects, the present status of the 209Bi capture data is rather unsatisfactory Ratzel et al. (2004). Previous experiments exhibit significant discrepancies suggesting the existence of systematic uncertainties, which must be clearly reduced for a more quantitative assessment of the Pb/Bi abundances. Two capture resonance studies on 209Bi have been reported so far, one at ORNL Macklin and Halperin (1976) and the other at GELINA P. Mutti (1997); Mutti et al. (1998). In the former measurement, two strong s-wave resonances at low neutron energy could not be measured because of a low neutron energy cutoff at 2.6 keV. In addition, substantial corrections were needed for some of the resonances in order to account for the neutron sensitivity of the experimental setup employed. The GELINA measurement was also affected by significant corrections for neutron sensitivity.
The 209Bi () cross section has also a very practical application. Thanks to its properties of chemical inertness, high boiling point, low neutron moderation, and large scattering cross section, an eutectic mixture of lead and bismuth is presently considered as a very appropriate material for the spallation target and as the coolant for accelerator driven systems (ADS).
In a first sensitivity study of the neutron cross sections of the main materials used in this type of hybrid reactor C. Rubbia et al. (2000), severe discrepancies where found between different evaluated nuclear data files. As a consequence, a list of isotopes was tagged for high priority measurements. Initially, most of the requested cross sections corresponded to the fuel and cladding materials, and were focused on the elastic, inelastic and () channels. However, a recent extension of the same study Herrera et al. (2003) includes additional requests for the capture reactions in the spallation/coolant materials lead and bismuth. Comparing two evaluated data files, ENDF/B-VI.8 and JENDL 3.3, discrepancies in the neutron balance of 12.5% were identified to result from the uncertainties of the () cross section of 209Bi alone. Hence, the precise knowledge of the neutron capture cross sections of the lead and bismuth isotopes turned out to be of key relevance for the design of an ADS suited for the transmutation of radioactive residues and for energy production.
Apart from its contribution to the neutron balance, neutron capture on 209Bi affects the radiotoxicity as well. Build-up of the -emitters 210Bim ( = 3106 yr) and 210Po ( = 138 d) contributes to the long and short term radiotoxicity of the spallation target and of the coolant. These hazards can only be evaluated on the basis of a precise () cross section of bismuth and with accurate data concerning the partial cross sections leading to 210Bim and 210Po.
II Cross Section measurement
The neutron energy differential capture cross section of 209Bi has been measured at the nTOF installation of CERN using the time of flight (TOF) technique. Since this facility has been described in detail elsewhere The n_TOF Collaboration (2002), only the main features will be summarized in section II.1. The major motivation for this measurement was to overcome the systematic uncertainty related to the neutron scattering background, which arises in measurements on isotopes with a dominant scattering channel. Sample scattered neutrons are easily captured in the materials surrounding the detector or in the sensitive detector volume itself, producing -rays, which appear as a prompt, TOF-dependent background. This effect becomes particularly crucial for the broad -wave resonances in bismuth at low neutron energies between 0.8 keV and 12 keV, resulting in corrections as large as 50% in previous measurements Macklin and Halperin (1976).
For this reason the reaction yield of this isotope has been measured with a set of total energy detectors consisting of optimized C6D6 liquid scintillation detectors (section II.2). This setup turned out to be of pivotal importance for the efficient suppression of the background from scattered neutrons. Other sample-related corrections were significantly reduced by choosing a comparably small bismuth sample 20 mm in diameter and 6.1 mm in thickness. The cross section is determined relative to the 4.9 eV 198Au resonance by employing the saturated resonance technique Macklin et al. (1979). For this purpose a gold sample 1 mm in thickness and 20 mm in diameter was measured in regular intervals. A thorough analysis of the capture data, including extensive Monte Carlo simulations of the necessary corrections to the experimental data, allowed us to determine the final cross section with a systematic uncertainty of better than 3%.
II.1 The nTOF installation
At nTOF, neutrons are produced via spallation reactions induced by 20 GeV protons in a lead target. Pulses of (3-7)1012 protons with a duration of 6 ns (rms) hit the Pb-block with a typical repetition rate of 0.4 Hz. This very low duty cycle combined with the very high intensity in the beam pulses makes nTOF an ideal facility for TOF measurements on radioactive samples. The low repetition rate has allowed to implement an advanced data acquisition system with zero dead time based on Flash-amplitude-to-digital converters Abbondanno et al. (2005).
The number of neutrons arriving at the sample are monitored by means of a 200 g/cm2 thick 6Li-foil, centered in the beam. The particles emitted in the 6Li()3H reaction are registered with four silicon detectors surrounding the 6Li-foil outside of the beam. The neutron monitor Marrone et al. (2004) is mounted in an evacuated carbon fiber chamber 3 m upstream of the samples. The samples, which are positioned at a flight path of 185 m, are fixed on a sample changer, which is also made of carbon fiber.
The neutron intensity has been determined by means of two independent measurements, performed with the Si-monitor described above and with a calibrated fission chamber PTB group (2002). Two measurements were carried out with the latter detector, employing foils of 235U and 238U. Calibration of the absolute yield in () measurements via the saturated resonance method requires actually only the shape of the neutron flux, which can be directly determined from the Si-monitor and fission chamber measurements with an uncertainty below 2% C. Domingo-Pardo (2005).
The beam profile at the sample position has been determined to exhibit an approximate Gaussian shape with mm, slightly off centered ( mm) Pancin et al. (2004). The samples used in this measurement cover about 60% of the neutron beam.
The excellent neutron energy resolution of the nTOF facility is due to the long flight path of 185 m and to the short proton pulse width. The resolution function was determined by means of Monte Carlo simulations Coceva et al. (2002) and has been validated experimentally by measuring narrow - and -wave capture resonances on a sample of Fe.
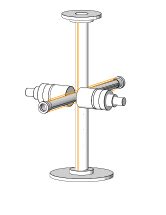
II.2 Experimental setup
A general view of the experimental setup is shown in Fig. 2. The detection system used with the pulse height weighting technique (PHWT) Macklin and Gibbons (1967) had been optimized with respect to the sensitivity for scattered neutrons, the most crucial source of background in () studies on neutron magic nuclei, which are characterized by particularly large scattering to capture ratios. Scattered neutrons may be subsequently captured in the detectors or in nearby materials, where they produce -rays, which are likely to be registered with high probability, thus mimicking true capture events in the sample.
In an effort to reduce the neutron sensitivity as much as possible, special C6D6 liquid scintillation detectors Plag et al. (2003) have been developed consisting of materials with low neutron capture cross sections. The main features of these detectors are thin-walled scintillator cells made of carbon fiber, which are directly glued onto the photomultiplier tubes, thus eliminating dead materials, e.g. the common quartz window of the scintillator cells. To avoid the additional material of a support, the detectors were hanging on thin cords fixed at the ceiling. Similarly, the sample changer was made of carbon fiber as was the frame of the sample-holder. The samples were mounted on thin Kapton foils, which were glued on the frame that was much larger than the diameter of the neutron beam. In this way, the neutron sensitivity in the critical energy range from 1 keV to 100 keV could be reduced by factors of three to ten Plag et al. (2003).
The two detectors were placed at an angle of 125∘ with respect to the sample in order to minimize the angular distribution effects of the primary capture rays. Also the background due to in-beam -rays scattered in the sample was considerably reduced in this configuration U. Abbondanno et al. (2003).
III Data analysis
In this section, the PHWT principle will be reviewed together with the related systematic uncertainties of relevance for this type of capture measurements, followed by the determination of the weighting factors. We describe the calculation of accurate yield corrections and the analysis procedure to determine resonance parameters.
III.1 Pulse height weighting technique
and systematic uncertainties
The PHWT is based on two conditions, that the detector efficiency so that at most only one -ray per capture cascade is registered, and that is proportional to the energy of the registered -ray, . Under these two conditions, the efficiency for detecting a capture event, i.e. a cascade composed of -rays, becomes proportional to the sum energy of that cascade. In this case one obtains
| (1) |
which is a constant independent of the actual de-excitation pattern of the nucleus produced in the capture reaction. It is worth noting that the approximations in Eq. 1 are the better justified the better conditions and are fulfilled.
The validity of Eq. 1 can be challenged by several experimental problems though. In particular, condition is violated if more than one -ray of the cascade is registered in the same detector. Moreover, the product as well as the sum over the -rays of the cascade is always incomplete because of the unavoidable loss of -rays due to electronic threshold applied to the detector signals, due to converted transitions, and due to partial population of the isomeric state in 210Bi at 271 keV.
For all these effects, which may influence the validity of Eq. 1, appropriate corrections have to be determined as is shown in the following subsections.
As far as condition is concerned, the proportional increase of the efficiency with -ray energy is enforced by an appropriate modification of the detector energy response distribution . This is achieved by application of a pulse height dependent weighting factor , such that the weighted sum of the response for a -ray , , becomes proportional to its energy ,
| (2) |
The second approximation in Eq. 1 depends directly on the accuracy of the calculated weights , which can be tested as discussed below.
III.2 Weighting factors
It has been shown Tain et al. (2002); Abbondanno et al. (2004) that realistic response functions for mono-energetic -rays with energies can be determined by means of Monte Carlo simulations for any particular setup for () measurements. A set of expressions of the form of Eq. 2 can then be used to derive the weighting factors .
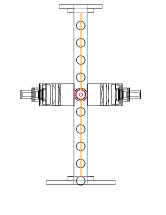
The detailed geometry and chemical composition of the experimental setup has been implemented in the Monte Carlo simulation using Geant4 Geant4 Collaboration et al. (2003) (see Fig. 2). The composition of the carbon fiber, which is by far the dominant structural material, was determined by an RBS analysis C. Domingo-Pardo (2001), yielding C/O/N/Ca/Br = 2.0/0.2/0.16/0.012/0.016. Also, the capture -rays were carefully traced, assuming a radial distribution for the emission probability inside the sample according to the neutron beam profile described in section II.1. The depth distribution was included as well since it changed significantly from a practically uniform to a surface peaked shape between weak and strong resonances, respectively.
The weighting function (WF) of the gold calibration sample was obtained using the conventional approximation by a polynomial function of order , . The values of the coefficients were derived from a least squares minimization,
| (3) |
Because of the higher -ray absorption in the 6.1 mm thick bismuth sample the proportionality condition () could not be satisfied with the polynomial WF approach. In this case an accurate, pointwise WF was obtained by means of a linear regularization method for solving the inverse problem of Eq. 2 C. Domingo-Pardo (2005). In this way the uncertainty connected with the polynomial WF has been reduced to 0.3%, an improvement by an order of magnitude.
The systematic uncertainty introduced by the WF was determined as described in Ref. Abbondanno et al. (2004), basically by performing Monte Carlo simulations of the capture cascades at a certain resonance. The de-excitation pattern is modeled by combining the experimentally known levels at low excitation energy with a statistical model of the nucleus to complete the cascade up to the capture energy. These simulated capture events can be used in order to estimate the uncertainty of the calculated WF.
In order to illustrate the performance of the cascade event generator for the samples measured in this experiment, the simulated pulse height spectra for the 802 eV resonance in 210Bi and for the 4.9 eV resonance in 198Au are compared in Fig. 3 with the corresponding experimental spectra measured at nTOF.
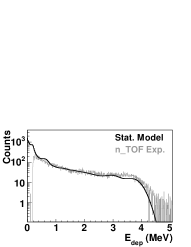
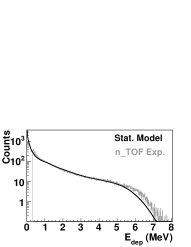
The spectra based on the simulated cascades show in general a good agreement with the experimental spectra. The small differences at higher energy can be ascribed to the employed statistical model and to a lesser extent to the uncertainties in the calibration of the C6D6 detectors. In principle, these differences could be minimized by modifying the relative strength of M1 and E1 transitions in the statistical part of the cascades and/or the instrumental resolution. However, the effect on the weighted sum and, therefore, on the estimated uncertainty becomes absolutely negligible in both cases.
In summary, it was found that the simulated pulse height spectra can be employed for the determination of the uncertainty of the WF. By computing the weighted sum of each capture cascade with the calculated weighting functions, we obtain values, which deviate by less than 0.3% from the corresponding capture energies. This means that condition () is fulfilled within 99.7%, leading to a practically negligible uncertainty due to the calculated WF.
III.3 Yield correction factors
The corrections for the electronic threshold, -summing, internal conversion, and the effect of the isomeric state (See Sec. III.1) have been estimated by detailed Monte Carlo simulations of the capture events in a similar manner as in Ref. Abbondanno et al. (2004). While internal conversion and summing of cascade -rays were found to have a minor effect of less than 2% on the capture yield of the bismuth sample, more significant corrections are required for the electronic threshold and for the isomeric state in 210Bi. The isomeric state is included in the simulation by assigning a null branching ratio to the level of 271 keV, so that the de-excitation cascade ends at that level whenever it is reached.
The yield correction factor including all these effects can be calculated as
| (4) |
where is the total response of the detection system for simulated capture events. For a threshold of 200 keV, the yield correction factors calculated with this procedure for the bismuth sample are listed in the third column of Table 1.
| isom. popul.(%) | |||
|---|---|---|---|
| 6 | 1.124(2) | 1.103(2) | |
| 8 | 1.131(2) | 1.118(2) | |
| 9 | 1.143(2) | 1.116(2) | |
| 23 | 1.137(2) | 1.109(2) | |
| 22 | 1.142(2) | 1.119(2) | |
| 44 | 1.134(2) | 1.114(2) |
Since the simulated spectra for resonances with same spin and parity are very similar, i.e. almost independent of the resonance energy, the correction factors could be classified according to spin and parity of the resonance (first column in Table 1).
The population of the isomeric state calculated with our statistical model of the nucleus is shown in the second column of Table 1. For comparison, and to illustrate the possible uncertainty of the calculation, the correction factor of the hypothetic case, where the isomer is populated with 100% probability is shown in the last column. The differences were found to range between 1% and 2.5%.
As mentioned before, the cross section is determined relative to the 4.9 eV resonance in 197Au. Therefore, the capture yield measured with the gold sample had to be corrected for experimental effects of threshold, -ray summing, and internal conversion. The corresponding correction factor for a threshold of 200 keV is .
Hence, the final correction for each resonance is the ratio between the corresponding factor from Table 1 and . This ratio oscillates between 5% and 7%. It can be concluded, that the threshold, -summing and internal conversion effects do not cancel out by measuring with respect to a reference sample. Neglecting these corrections could lead to systematic deviations in the yield determination of 5%.
III.4 Neutron sensitivity
For a certain resonance at energy with capture and neutron widths, and , the probability that a signal in the C6D6 scintillator is caused by a neutron scattered in the sample and eventually captured in the detector, is given by
| (5) |
where denotes the probability to detect a -ray produced by sample-scattered neutrons in or near the detector and the probability to register a -ray from a true capture cascade. This requires a correction of the experimental resonance yield by
| (6) |
Eq. 5 can be rewritten as,
| (7) |
where is the detection probability for a -ray of a given energy. For an energy keV, has been calculated by means of Monte Carlo simulations for comparison with the experimentally determined value reported in Ref. Plag et al. (2003). The second factor, , has been determined by a detailed Monte Carlo simulation of the present experimental setup. The efficiency was obtained for -rays of 600 keV, whereas was determined using simulated capture cascades (see sections III.2 and III.3). Finally, is to be determined by an iterative procedure of correcting and fitting the value of of the corresponding resonance.
In case of the -wave resonance at 12.1 keV, which has the largest of all analyzed bismuth resonances, the corresponding ratios were found to be (this work) and Plag et al. (2003). Because of the very low neutron sensitivity the required correction for the 12.1 keV resonance of 3.60.7% is relatively small, and practically negligible for the rest of the -wave resonances in bismuth.
The 20% uncertainty of this correction results from neutron captures in the quartz window of the photomultiplier tube due to the uncertain silicon cross sections, which contribute a 10% uncertainty to , and from the resonance parameters and , which exhibit uncertainties of 8% and 10%, respectively.
III.5 R-matrix analysis
The experimental yield
| (8) |
was determined by the weighted net count rate (), the effective binding energy , the integrated neutron flux (obtained from the Si-monitor and from the shape of the neutron flux, sec. II.1), and the corrections discussed before. The factor corresponds to the absolute normalization via the analysis of the saturated resonance at 4.9 eV in 198Au.
The yield has been analyzed with the multilevel R-matrix code SAMMY N.M. Larson (2000). Using an iterative procedure based on Bayes’ theorem, is fitted with a function of the type,
| (9) |
where corresponds to a parameterization as a function of the resonance parameters and according to the Reich-Moore formalism. For all partial waves a channel radius of 9.6792 fm was used. While adopting the well known values from transmission measurements, the resonance energies and capture widths have been fitted to the experimental data. The background below the resonance is described by the constant term . In the fits with SAMMY also sample effects (single and double neutron scattering inside the sample) as well as thermal broadening are taken into account. The resolution function of the facility (sec. II.1) has been considered in the fits using the RPI parameterization.
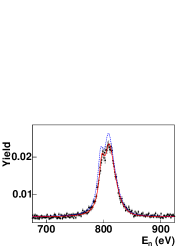
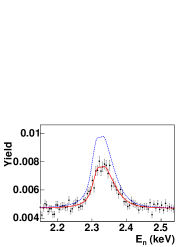
The present results are illustrated in Fig. 4 at the example of the first two -wave resonances in 210Bi. The comparison with the capture yields calculated with the corresponding resonance parameters quoted in the ENDF/B-VI.8 evaluation demonstrates the improvement due to the reduced systematic uncertainties of the nTOF data.
IV Results
In total, 21 resonances were identified in the 209Bi() data in the energy range from 800 eV up to 23150 eV. The respective capture widths and areas are listed in Table 2.
| E∘ (eV) | (meV) | (meV) | (meV) | ||
|---|---|---|---|---|---|
| 801.6(1) | 0 | 5 | 4309(145) | 33.3(12) | 18.2(6) |
| 2323.8(6) | 0 | 4 | 17888(333) | 26.8(17) | 12.0(8) |
| 3350.83(4) | 1 | 5 | 87(9) | 18.2(3) | 9.5(2) |
| 4458.74(2) | 1 | 5 | 173(13) | 23.2(22) | 11.3(11) |
| 5114.0(3) | 0 | 5 | 5640(270) | 65(2) | 35.3(11) |
| 6288.59(2) | 1 | 4 | 116(18) | 17.0(17) | 6.7(7) |
| 6525.0(3) | 1 | 3 | 957(100) | 25.3(14) | 8.6(5) |
| 9016.8(4) | 1 | 6 | 408(77) | 21.1(14) | 13.0(9) |
| 9159.20(7) | 1 | 5 | 259(45) | 21.4(21) | 10.9(11) |
| 9718.910(1) | 1 | 4 | 104(22) | 74(7) | 19.5(21) |
| 9767.2(3) | 1 | 3 | 900(114) | 90(8) | 28.7(26) |
| 12098 | 65(4)c | ||||
| 15649.8(1.0) | 1 | 5 | 1000 | 47(4) | 20.2(17) |
| 17440.0(1.3) | 1 | 6 | 1538(300) | 32(3) | 20.4(18) |
| 17839.5(9) | 1 | 5 | 464(181) | 43(4) | 21.7(20) |
| 20870 | 1 | 5 | 954(227) | 34.4(33) | 18.3(17) |
| 21050 | 1 | 4 | 7444(778) | 33(3) | 14.8(13) |
| 22286.0(9) | 1 | 5 | 181(91) | 33.6(32) | 15.1(15) |
| 23149.1(1.3) | 1 | 6 | 208(154) | 25.3(25) | 14.7(15) |
aAngular orbital momenta, , resonance spins , and
neutron widths, , are mainly from Refs. S.F. Mughabghab (1984); S.I. Sukhoruchkin, Z.N. Soroko and V.V.
Deriglazov (1998).
bUncertainties are given as 18.2(6)18.20.6.
cThis area corresponds to the sum of the areas of the broad s-wave resonance at the
indicated energy, plus two p-wave resonances at 12.092 and 12.285 keV.
Beyond 23 keV further resonances could not be observed due to in-beam -ray background U. Abbondanno et al. (2003), which was the major limitation in this experiment. However, this background did not affect the initial aim of improving the systematic uncertainty of the broad -wave resonances below 100 keV.
The capture areas determined at nTOF are compared in Fig. 5 with the previous measurements performed at ORNL Macklin and Halperin (1976) and GELINA P. Mutti (1997).
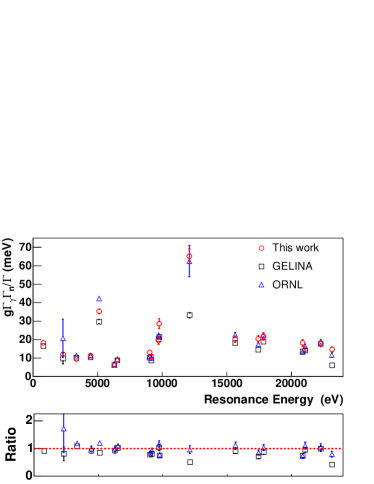
For most of the resonances shown in Fig. 5, there is a fair agreement with the ORNL data. However, significantly higher values are reported in the latter measurement for the two resonances at 3.3 keV and 5.1 keV, and a lower cross section for the resonance at 9.77 keV. The GELINA data show agreement with n_TOF in several cases, but there is an average trend of lower cross sections. The largest differences in absolute values are for the resonances at 5.1 keV, 9.77 keV and the group at 12.1 keV. For these three resonances, the ORNL data shows opposite trend for the 5.1 keV resonance, agrees with GELINA for the 9.77 keV and agrees with the n_TOF data for the 12.1 keV group.
The general systematics of better average agreement with the ORNL data and lower average values of the GELINA data, might be related to the weighting functions used in the respective experiments, although threshold correction effects (see Sec. III.3) could play a role as well. Systematic deviations due to the neutron sensitivity corrections applied to some particular resonances can not be excluded also.
IV.1 Discussion of uncertainties
The measuring technique employed in this work and the data analysis procedures described in Sec. III and III.3, have been validated experimentally at nTOF Abbondanno et al. (2004). According to this study, the various contributions to the systematic uncertainty of the present data are about 2%. In addition, the energy dependence of the neutron flux has been found to exhibit an uncertainty of 2% as well, resulting in a total systematic uncertainty of better than 3%.
In this discussion, the neutron sensitivity correction has to be considered separately since it has been applied only to one of the measured resonances. Although the uncertainty of the correction was 20%, the contribution to the systematic uncertainty of the capture kernel was only 0.7% in this case.
V Implications for the -abundances in the Pb-Bi region
The slightly higher cross sections for -wave resonances measured at nTOF with respect to the values obtained at GELINA may affect the synthesis of the Pb/Bi. This holds preferentially at lower stellar temperature, since the neutron sensitivity correction becomes less relevant above 100 keV, where the relative contribution of the neutron scattering channel decreases.
Qualitatively, the consequence of a higher 209Bi cross section would reduce the survival probability and, hence, the -process abundance of this isotope, but this could be compensated to some extent through an enhanced production through -recycling via 206,207Pb.
In the calculation of the Maxwellian averaged cross sections (MACS), the nTOF resonances have been complemented between 25 keV and 31 keV with resonances from Ref. P. Mutti (1997), and in the interval from 31 keV up to 60 keV with capture areas from Ref. S.F. Mughabghab (1984). The additional resonances represent 2% and 7% of the MACS at keV and keV, respectively. At lower stellar temperature, comparison of the results in Table 3 with the MACS obtained at GELINA Mutti et al. (1998) shows that the new values are 16% larger.
| This work | Mutti et al.Mutti et al. (1998) | |
|---|---|---|
| (keV) | (mb) | (mb) |
| 5 | 13.05(84) | 11.25(58) |
| 8 | 8.62(54) | 7.48(44) |
| 20 | 3.41(50) | 3.34(42) |
| 25 | 2.89(50) | 2.85(45) |
Beyond keV, the MACS is strongly influenced by the average capture cross section above 80 keV, which has been determined experimentally in Ref. Mutti et al. (1998). For this reason, the differences obtained in the strong s-wave resonances at lower neutron energy do not affect substantially the MACS at 20-25 keV.
The MACS given in Table 3 refer to the lower temperature regime of the common stellar -process site associated with thermally pulsing low mass agb stars Gallino et al. (1998). According to the Galactic chemical evolution (GCE) model described in Refs. Travaglio et al. (1999, 2001), the -process abundances of 208Pb and 209Bi are essentially produced in stars of low metallicity. In this model about 95% of the neutron exposure is due to the 13C()16O reaction, which operates during the interpulse phase between He shell flashes at temperatures around K, corresponding to a thermal energy of keV.
The additional neutron irradiation provided by the 22Ne()25Mg reaction at the higher thermal energy of keV during the He shell flash is rather weak. Hence, the abundances of isotopes with small cross sections are still dominated by what has been produced at the lower temperature of the interpulse phase. Therefore, the low temperature part of the MACS is important for this stellar model. With respect to the solar abundance tables of Anders and Grevesse Anders and Grevesse (1989), the GCE model Travaglio et al. (2001) provides -process abundances of 206Pb, 207Pb and 209Bi at the epoch of the solar system formation of 62%, 79%, and 19%, respectively.
According to the sensitivity study reported in Ref. Ratzel et al. (2004), the present result (see table 3) is not expected to affect the abundances of 206,207Pb by -recycling from . This was confirmed by a model calculation for a thermally pulsing agb star with and a metallicity , which yields a negligible difference for the abundances of 206Pb and 207Pb. The -process abundance of 209Bi itself was found to decrease only slightly from 19% to 18.7%.
To evaluate the uncertainty on the solar 209Bi -process fraction, we have to consider first the uncertainty in the cross section of this isotope in the two temperature regimes of the stellar model. The main contribution due to the uncertainty of the bismuth cross section is dominated by the conditions during the He shell flash. At the higher temperature of the 22Ne(,n)25Mg source ( keV) the reaction flow via 208Pb()209Bi is strongly enhanced over the situation during the 13C(,n)16O phase. This reflects the increase of the 208Pb cross section with stellar temperature Beer et al. (1997). The net effect of the uncertainty on the 209Bi cross section to its solar -process abundance is found to be 6%.
In the evaluation of the final -process abundance of bismuth, three aditional uncertainties have to be considered: (i) the effect of the uncertainty in the 208Pb cross section, which directly affects the production of 209Bi by 6.5% (see Table VII in Ref. Ratzel et al. (2004)), (ii) the 7-8% uncertainty of the solar bismuth abundance (Refs. Lodders (2003); Anders and Grevesse (1989)), and (iii) a further 10% for the uncertainties related to the -process model and for modeling GCE Travaglio et al. (2001). In summary the -process contribution to solar bismuth is obtained as 193%, corresponding to an -process residual of 813%.
This result is in agreement with the -process calculation of Ref. Cowan et al. (1999) using the waiting point approximation and improved mass formulae, which yield an -process contribution between 71% and 90%. A similar result is reported in Ref. Kratz et al. (2004) where the calculations give 77% and 92% -process contribution depending on the initial seed composition.
VI Estimation of the thermal capture cross section
The thermal neutron capture cross section of 209Bi can be expressed by the sum of the tails of all Breit-Wigner resonances,
| (10) |
The result obtained with the resonance parameters from the present measurement (see Table 2), is in agreement with that obtained from the GELINA measurement, as shown in Table 4. However, both values are around 40% smaller than the accepted value of 33.8(5) mb S.F. Mughabghab (1984), which has been measured with the pile oscillator method. The direct capture process cannot account for this discrepancy. In fact, a preliminary estimate of this component leads to a negligible contribution to the thermal cross section value G. Arbanas (2004) (ORNL).
| Ref. | (mb) | ||
|---|---|---|---|
| In-pile measurement | S.F. Mughabghab (1984) | 33.8(5) | |
| From resonance parameters | |||
| This work | 23.6(9) | ||
| GELINA | P. Mutti (1997) | 24.6(9) | |
| ENDF | 32.51 | ||
| JENDL | 32.51 |
The resonance parameters of the ENDF and JENDL libraries have been adjusted to reproduce the in-pile measurement by means of an expression like Eq. 10. With the improved, present data for the -wave resonances this inconsistency could be removed by introducing subthreshold resonances in the evaluated data files.
VII Summary
At the CERN nTOF facility the time of flight method has been employed with the pulse height weighting technique in order to determine the neutron capture cross section of bismuth in the resolved resonance region.
The main improvement with respect to previous measurements is due to an optimized detection setup, by which the crucial neutron sensitivity could be considerably reduced. All remaining sources of systematic uncertainties have been thoroughly treated by detailed Monte Carlo simulations.
Resonance energies (), widths (), and capture areas have been determined by an R-matrix analysis covering the energy range from 0.8 keV to 23 keV.
The results show larger capture areas for the -wave resonances, yielding a 16% enhancement of the stellar neutron capture rate at thermal energies between 5 keV and 8 keV compared with recent data Mutti et al. (1998).
The new cross section results for 209Bi, combined with recent improvements in the cross section of 208Pb Ratzel et al. (2004), yield a solar -process abundance of 19(3)% for bismuth. The resulting -process residual of 81(3)% represents a reliable constraint for -process calculations Cowan et al. (1999).
Acknowledgements.
We acknowledge the help of G. Arbanas (ORNL) in providing the direct capture contribution to the thermal cross section. R.G. and F.K. appreciate the opportunity to discuss this paper at the Aspen Summer School organized in 2005 by R. Reifarth and F. Herwig. This work was supported by the European Commission (FIKW-CT-2000-00107), by the Spanish Ministry of Science and Technology (FPA2001-0144-C05), and partly by the Italian MIUR-FIRB grant ”The astrophysical origin of the heavy elements beyond Fe”. It is part of the Ph.D. thesis of C. D., who acknowledges financial support from Consejo Superior de Investigaciones Científicas.References
- Travaglio et al. (1999) C. Travaglio, D. Galli, R. Gallino, M. Busso, F. Ferrini, and O. Straniero, Astrophys. J. 521, 691 (1999).
- Travaglio et al. (2001) C. Travaglio, R. Gallino, M. Busso, and R. Gratton, Astrophys. J. 549, 346 (2001).
- Cowan et al. (1991) J. J. Cowan, F.-K. Thielemann, and J. W. Truran, Physics Reports 208, 267 (1991).
- Kratz et al. (2004) K.-L. Kratz, B. Pfeiffer, J. J. Cowan, and C. Sneden, New Astronomy Review 48, 105 (2004).
- Ratzel et al. (2004) U. Ratzel, C. Arlandini, F. Käppeler, A. Couture, M. Wiescher, R. Reifarth, R. Gallino, A. Mengoni, and C. Travaglio, Phys. Rev. C 70, 065803 (2004).
- Macklin and Halperin (1976) R. Macklin and J. Halperin, Phys. Rev. C 14, 1389 (1976).
- P. Mutti (1997) P. Mutti (1997), eprint PhD Thesis, University of Gent, 1997.
- Mutti et al. (1998) P. Mutti, F. Corvi, K. Athanassopulos, H. Beer, and P. Krupchitsky, in Nuclei in the Cosmos, edited by N. Prantzos and S. Harissopulos (Volos, Editions Frontières, 1998), pp. 204–207.
- C. Rubbia et al. (2000) C. Rubbia et al. (2000), eprint 1 Management Report of the n_TOFND-ADS EC programme under contract no. FIKW-CT-2000-00107.
- Herrera et al. (2003) A. Herrera, M. Dahlfors, Y. Kadi, and G. T. Parks, in Workshop on Nuclear Data for the Transmutation of Nuclear Waste, edited by A. Kelic and K. Schmidt (2003).
- The n_TOF Collaboration (2002) The n_TOF Collaboration (2002), eprint CERN n_TOF Facility: Performance Report, CERN/INTC-O-011 INTC-2002-037 CERN-SL-2002-053ECT.
- Macklin et al. (1979) R. Macklin, J. Halperin, and R. Winters, Nuclear Instruments and Methods in Physics Research A 164, 213 (1979).
- Abbondanno et al. (2005) U. Abbondanno, G. Aerts, F. Alvarez, H. Alvarez, S. Andriamonje, J. Andrzejewski, G. Badurek, P. Baumann, F. Becvar, J. Benlliure, et al., Nuclear Instruments and Methods in Physics Research A 538, 692 (2005).
- Marrone et al. (2004) S. Marrone, P. F. Mastinu, U. Abbondanno, R. Baccomi, E. B. Marchi, N. Bustreo, N. Colonna, F. Gramegna, M. Loriggiola, S. Marigo, et al., Nuclear Instruments and Methods in Physics Research A 517, 389 (2004).
- PTB group (2002) PTB group (2002), eprint n_TOF neutron fluence with the PTB Fission Chambers, CERN/SL/ECT/2002.
- C. Domingo-Pardo (2005) C. Domingo-Pardo (2005), eprint Ph.D. Thesis, CSIC-University of Valencia.
- Pancin et al. (2004) J. Pancin, U. Abbondanno, G. Aerts, H. Alvarez, S. Andriamonje, A. Angelopoulos, P. Assimakopoulos, C. Bacri, G. Badurek, P. Baumann, et al., Nuclear Instruments and Methods in Physics Research A 524, 102 (2004).
- Coceva et al. (2002) C. Coceva, M. Frisoni, M. Magnani, and A. Mengoni, Nuclear Instruments and Methods in Physics Research A 489, 346 (2002).
- Macklin and Gibbons (1967) R. L. Macklin and J. H. Gibbons, Physical Review 159, 1007 (1967).
- Plag et al. (2003) R. Plag, M. Heil, F. Käppeler, P. Pavlopoulos, R. Reifarth, K. Wisshak, and The N Tof Collaboration, Nuclear Instruments and Methods in Physics Research A 496, 425 (2003).
- U. Abbondanno et al. (2003) U. Abbondanno et al. (2003), eprint CERN Report No. CERN-SL-2002-053 ECT.
- Tain et al. (2002) J. L. Tain, F. Gunsing, D. Cano-Ott, N. Colonna, C. Domingo, E. Gonzalez, M. Heil, F. Käppeler, S. Marrone, P. Mastinu, et al., Jour. of Nucl. Sci. and Tech. 2, 689 (2002).
- Abbondanno et al. (2004) U. Abbondanno, G. Aerts, H. Alvarez, S. Andriamonje, A. Angelopoulos, P. Assimakopoulos, C. O. Bacri, G. Badurek, P. Baumann, F. Bečvář, et al., Nuclear Instruments and Methods in Physics Research A 521, 454 (2004).
- Geant4 Collaboration et al. (2003) Geant4 Collaboration, S. Agostinelli, J. Allison, K. Amako, J. Apostolakis, H. Araujo, P. Arce, M. Asai, D. Axen, S. Banerjee, et al., Nuclear Instruments and Methods in Physics Research A 506, 250 (2003).
- C. Domingo-Pardo (2001) C. Domingo-Pardo (2001), eprint Diploma Thesis, CSIC-University of Valencia.
- N.M. Larson (2000) N.M. Larson (2000), eprint SAMMY: Multilevel R-matrix fits to neutron data using Bayes equations, ORNL/TM-9179.
- S.F. Mughabghab (1984) S.F. Mughabghab (1984), eprint Neutron Cross Sections: Neutron Resonance Parameters and Thermal Cross Sections, Academic press.
- S.I. Sukhoruchkin, Z.N. Soroko and V.V. Deriglazov (1998) S.I. Sukhoruchkin, Z.N. Soroko and V.V. Deriglazov (1998), eprint Low Energy Neutron Physics, Volume I/16B, Tables of Neutron Resonance Parameters (Springer, Landolt-Bø̈rnstein).
- Gallino et al. (1998) R. Gallino, C. Arlandini, M. Busso, M. Lugaro, C. Travaglio, O. Straniero, A. Chieffi, and M. Limongi, Astrophys. J. 497, 388 (1998).
- Anders and Grevesse (1989) E. Anders and N. Grevesse, Geochimica et Cosmochimica Acta 53, 197 (1989).
- Beer et al. (1997) H. Beer, F. Corvi, and P. Mutti, Astrophys. J. 474, 843 (1997).
- Lodders (2003) K. Lodders, Astrophys. J. 591, 1220 (2003).
- Cowan et al. (1999) J. J. Cowan, B. Pfeiffer, K.-L. Kratz, F.-K. Thielemann, C. Sneden, S. Burles, D. Tytler, and T. C. Beers, Astrophys. J. 521, 194 (1999).
- G. Arbanas (2004) (ORNL) G. Arbanas (ORNL) (2004), eprint (private communication).