Experimental observables on nuclear liquid gas phase transition 333 Dedicate to the ”International Seminar on Atomic and Nuclear Cross-Disciplinary Physics” in honor of Prof. Fujia Yang’s 70th Birthday.
Abstract
Progress on nuclear liquid gas phase transition (LGPT) or critical behavior has been simply reviewed and some signals of LGPT in heavy ion collisions, especially in NIMROD data, are focused. These signals include the power-law charge distribution, the largest fluctuation of the fragment observables, the nuclear Zipf law, caloric curve and critical exponent analysis etc.
1 Introduction
Phase transition and critical phenomenon are extensively debatable subjects in the natural sciences. Recently, the same concept was introduced into the astronomical objects [1] as well as the microscopic systems, such as in atomic cluster [2] and nuclei [3]. Nucleus is a finite-size droplet-like quantum system in the ground state, it may experience the liquid-gas phase transition or critical behavior when the nucleus is heated. Till date, various experimental evidences have been accumulated to corroborate the nuclear liquid gas phase transition or critical behavior. For instance, violent heavy-ion collisions break the nuclei into several intermediate mass fragments (IMF) instantaneously [4, 5, 6, 7], which might be viewed as a critical phenomenon as observed in fluid, atomic and other systems. The sudden opening of the nuclear multifragmentation and vaporization [8] channels can be interpreted as the signature of the boundaries of phase mixture. In addition, temperature plateau of the nuclear caloric curve [9] in a certain excitation energy range gives a possible indication of phase transition [10, 11, 12, 13]. On the other hand, the extraction of critical exponents in the charge or mass distribution of the multifragmentation system [14] points to the continuous phase transition. More recently, the negative microcanonical heat capacity was experimentally attempted in nuclear fragmentation [15] which may relate to the liquid-gas phase transition [16], and in atomic cluster [17] which relates to solid-liquid phase transition [18], respectively. Moreover, the evidence of spinodal decomposition in nuclear multifragmentation was recently reported experimentally [19, 20], which may show the presence of liquid-gas phase coexistence region in the finite nuclear systems. Bimodal distributions of some chosen variables measured in nuclear collisions were recently proposed as a signature of a first order phase transition in nuclei [21]. -scaling of the largest fragments was also investigated recently and it is probably a probe to detect the phase change [22]. The nuclear Zipf’s law was proposed to diagnose the onset of liquid-gas phase transition or critical behavior [23, 24, 25] and it is experimentally supported [26, 27]. Phase coexistence diagram was also tentatively constructed based on the EOS data [28, 29].
While, extensive theoretical models have been developed to treat such a phase transition in the nuclear disassembly, e.g. percolation model, lattice gas model, statistical multifragmentation model and molecular dynamics model etc (e.g. see some recent articles [30, 31, 32, 33, 34, 35] and references therein).
In this article which dedicates to Prof Fu-Jia Yang on the occasion of his 70th birthday, I will focus on some experimental aspects of the nuclear LGPT or critical behavior in heavy ion collisions, specially for NIMROD data.
2 Signals of the Nuclear Liquid Gas Phase Transition or Critical Behavior
2.1 Fisher Droplet Model: Power Law of Charge/Mass Distribution
The Fisher droplet model has been extensively applied to the analysis of multifragmentation since the pioneering experiments on high energy proton-nucleus collisions by the Purdue group [3, 36, 37]. Relative yields of fragments with could be well described by a power law dependence and it was suggested that this might reflect the disassembly of a system whose excitation energy was comparable to its total binding energy [36]. The extracted value of power-law exponent was , which is in a reasonable range for critical behavior [38]. The success of this approach suggested that the multi-fragmentation of nuclei might be analogous to a continuous phase transition from liquid to gas which is observed in more common fluids.
In the Fisher Droplet Model the fragment mass distribution can be represented as
| (1) |
where , , and are parameters. However, at the critical point = 1 and = 1, therefore the cluster distribution is given by a pure power law
| (2) |
The model predicts a critical exponent 2.21.
We collaborated an experiment with a 4-detector combination of charged particle ball with neutron ball (NIMROD) in Cyclotron Institute, Texas A&M University to explore the quasi-projectile fragmentation from Ar + Al, Ti and Ni at 47 MeV/nucleon [26]. Well defined QP sources have been reconstructed using a new method which is based on three source fits and the Monte Carlo sampling for the assignment of quasi-projectile (QP) and their disassembly features have been analyzed. For simplicity, we call this experimental data as TAMU data [26]. The details can be found in Ref. [26].
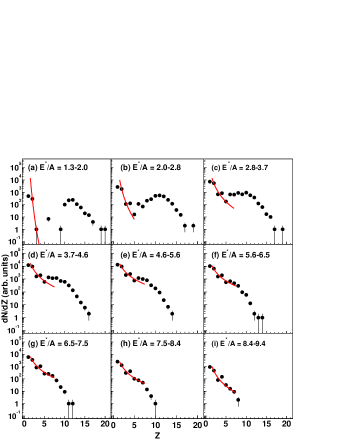
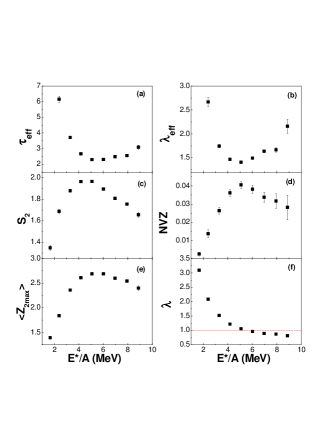
Fig. 1 presents yield distributions , observed for nine different excitation energy () intervals for the QP from the reactions of + from TAMU data. At low excitation energy a large residue always remains, the nucleus is basically in the liquid phase accompanied by some evaporated light particles. When reaches 5.6 MeV/nucleon, this residue is much less prominent. As continues to increase, the charge distributions become steeper which indicates that the system tends to vaporize. To quantitatively pin down the possible phase transition point, we use a power law fit to the QP charge distribution in the range of = 2 - 7 to extract the effective Fisher-law parameter by in Fig. 1. Fig. 2(a) shows vs excitation energy, a minimum with 2.3 is seen in the range of 5 to 6 MeV/nucleon. 2.3, is close to the critical exponent of the liquid gas phase transition universality class as predicted by the Fisher’s droplet model [38].
While, assuming that the heaviest cluster in each event represents the liquid phase, we have attempted to isolate the gas phase by event-by-event removal of the heaviest cluster from the charge distributions. We found that the resultant distributions are better described as exponential form . The fitting parameter was derived and was plotted against excitation energy in Fig. 2(b). A minimum is seen in the same region where shows a minimum.
2.2 The largest fluctuation
One of the well known characteristics of the systems undergoing a continuous phase transition is the occurrence of the largest fluctuations. These large fluctuations in cluster size and density of the system arise because of the disappearance of the latent heat at the critical point. In macroscopic systems such behavior gives rise to the phenomenon of critical opalescence [40].
To further explore this region we have investigated other proposed observables commonly related to fluctuations and critical behavior. Fig. 2(c) shows the excitation function of the mean normalized second moment, , defined as , where and is the second and first moment. Generally, the -th moment is defined as
| (3) |
where is the multiplicity of the fragment and the largest fragment is excluded in the summer [41, 25]. A peak is seen around 5.6 MeV/nucleon, it indicates that the fluctuation of the fragment distribution is the largest in this excitation energy region. Similarly, the Normalized Variance in distribution (i.e. NVZ = ) [42] shows a maximum in the same excitation energy region [Fig. 2(d)], which illustrates the maximal fluctuation for the largest fragment is reached around = 5.6 MeV. Except the largest fragment, the second largest fragment also shows its importance in the above turning point. Fig. 2(e) shows a broad peak of - the average atomic number of the second largest fragment exists at 5.6 MeV/nucleon.
2.3 Fragment Hierarchical Distribution: Zipf plot and Zipf law
In addition to the largest fluctuation, observables revealing some particular topological structure may also reflect the critical behavior for a finite system. In this section we discuss a new observable and law: nuclear Zipf plot and Zipf law.
Zipf’s law has been known as a statistical phenomenon concerning the relation between English words and their frequency in literature in the field of linguistics [43]. The law states that, when we list the words in the order of decreasing population, the frequency of a word is inversely proportional to its rank [43]. Recently, Ma proposed measurements of the fragment hierarchy distribution as a tool to search for the liquid gas phase transition in a finite nuclear system based on the calculations with isospin-dependent lattice gas model (I-LGM) and classical molecular dynamics model [23, 44]. The fragment hierarchy distribution can be defined by the so-called Zipf plot, i.e., a plot of the relationship between mean sizes of fragments which are rank-ordered in size, i.e., largest, second largest, etc. and their rank [23].
In such an analysis, the cluster size is employed as a variable to make a Zipf-type plot, and the resultant distributions can be fitted with a power law,
| (4) |
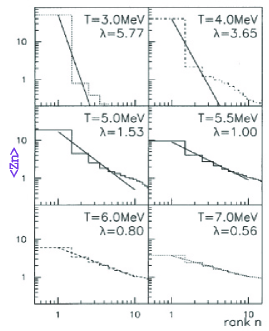
where represents the rank and is the Zipf’s law parameter. Fig. 3 shows the Zipf-type plots for the disassembly of with I-LGM calculations [44]. The fit parameter was extracted in each temperature. When , Zipf’s law is satisfied. In this case, the mean size of the second largest fragment is 1/2 of that of the the largest fragment; That of the third largest fragment is 1/3 of the largest fragment, etc.
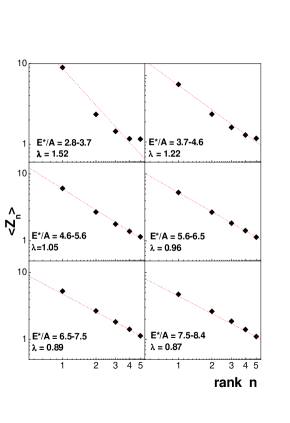
Now we return to the TAMU data [26], as shown in Fig. 1, the region of 5-6 MeV/nucleon excitation energy is related to the critical behavior as shown in above sections. The significance of this region in our data is further indicated by a Zipf’s law analysis. Fig. 4 shows the Zipf plots in six excitation energy windows. This rank ordering of the probability observation of fragments size of a given rank, from the largest to the smallest, does indeed lead to a Zipf’s law power law parameter 1 in the 5-6 MeV/nucleon range.
In a recent analysis for multifragment emission for CERN EMU13 data, Dabrowska et al. analyzed emulsion data for 158 A GeV Pb-Pb and Pb-Plastic collisions and tested the nuclear Zipf law of Ma [27]. They found that their data are roughly consistent with the nuclear Zipf law in a certain multiplicity where the multiplicity of IMF and parameter of the charge distribution reveal the same turning point. This has been interpretated as an evidence for the existence of the critical temperature associated with a liquid gas phase transition [27].
2.4 Caloric Curve
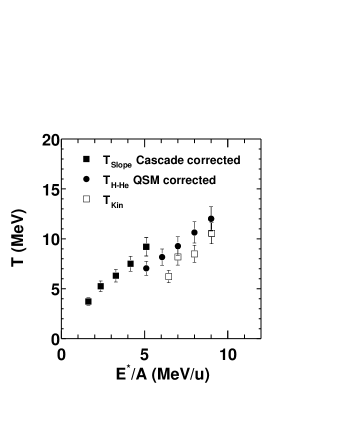
The caloric curve which relates the internal energy of an excited system at thermodynamic equilibrium to its temperature is a priori the simplest experimental tool to look for the existence of a phase transition.
In our TAMU data the caloric curve was constructed [26] and a monotonous rising behavior was observed instead of a plateau-like structure observed in heavier nuclei [11]. The caloric curve of this lighter system looks more like cross over behavior rather than first order phase transition. The corresponding initial temperature is determined and it is 8.3 0.5 MeV in the critical region of 5.6 MeV/nucleon excitation energy [26].
2.5 Critical Exponents
In terms of the scaling theory, some critical exponents can also be extracted from the moment analysis of cluster distributions [41, 25], namely of Eq. 3. Since, for our system, we have already deduced a critical temperature = 8.3 MeV at point of maximal fluctuations [26] from the caloric curve, we can use temperature as a control parameter to test the critical exponents. The critical exponent can be extracted from the relation
| (5) |
and the critical exponent can be extracted from the second moment, via
| (6) |
In each, is the parameter which measures the distance from the critical point.
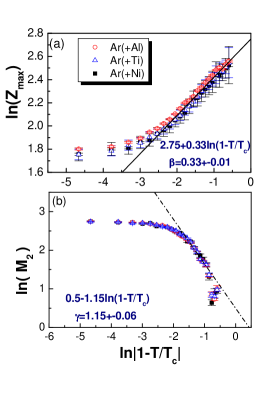
The upper panel of Fig. 6 explores the dependence of on . A dramatic change of around the critical temperature is observed. LGM calculations also predict that the slope of vs will change at the liquid gas phase transition [45]. Using the liquid side side points, we can deduce the critical exponent by vs . An excellent fit was obtained in the region away from the critical point and a critical exponent = 0.33 0.01. Near the critical point, the finite size effects become stronger so that the scaling law is violated.
To extract the critical exponent , we take on the liquid side without . Fig. 6(b) shows ln() as a function of ln(). We center our fit to Eq. (6) about the center of the range of which leads to the linear fit and extraction of as represented in Figure. 6(b). The critical exponent = 1.15 0.06. It is seen that the selected region has a good power law dependence.
Since the critical exponents and have been obtained, the critical exponent can be deduced by the scaling relation In such way, = 0.68 0.04 is obtained, which is also very close to the expected critical exponent of a liquid gas system.
To summarize critical exponents of our NIMROD data, we present the results in Table 1 as well as the values expected for the 3D percolation and liquid gas system universality classes. Obviously, our values for this light system with A36 are consistent with the values of the liquid gas phase transition universality class rather the 3D percolation class.
| Exponents | 3D Percolation | Liquid-Gas | Our Data |
|---|---|---|---|
| 2.18 | 2.21 | 2.310.03 (Fig.1) | |
| 0.41 | 0.33 | 0.330.01 | |
| 1.8 | 1.23 | 1.150.06 | |
| 0.45 | 0.64 | 0.680.04 |
3 Conclusions
In conclusion, the TAMU NIMROD data was focused and some observables relating to the liquid gas phase transition or critical behavior have been presented. Around 5.6 MeV/nucleon of excitation energy for A36 system, the fragment yield distribution obeys the power law which was predicted by Fisher droplet model. From fragment size structure, we found that there exists a particular hierarchical arrangement, so-called the nuclear Zipf law, which was demonstrated by both Texas A&M heavy ion data and EMU13 CERN emulsion data. While, many observables demonstrate the existence of maximal fluctuations around this excitation energy. These fluctuation observables include the Campi scattering plots and the normalized variances of the distributions of the largest fragment (). Caloric curve was reconstructed, and then critical temperature and critical exponents are also discussed. Caloric curve shows a gradual rise of temperature versus excitation energy, no plateau is observed for such lighter system. Thanks to the determination of critical temperature from the caloric curve, critical exponents are deduced and the values are close to the liquid gas universal class.
Finally, we should mention that a unique signal can not give any definite information whether the system is in a critical point or is undergoing a phase transition since we are facing a transient finite charged system. Only many coherent signals, such as the fluctuation peak, critical exponents, Fisher scaling as well as Zipf’s law etc, emerging together can corroborate the observation of a phase transition or a critical behavior in finite nuclei.
Author appreciates many colleagues and/or friends for discussions and collaborations, especially thanks Profs. F. J. Yang, W. Q. Shen, J. B. Natowitz, J. Péter, B. Tamain, S. Das Gupta, J. C. Pan et al. The paper is a contribution to a workshop dedicated to Professor Fu-Jia Yang, former President of Fudan University, former Director of Shanghai Institute of Nuclear Research (now Shanghai Institute of Applied Physics), and the Chancellor of Nottingham University, on his 70th birthday. Professor Yang has been an inspiration for me as a scientist since I got to know him when I was a PhD student in his Institute. He always educates and encourages me how to become a good scientist, and always gives his unselfish invaluable helps in my professional life. I’d like to take this opportunity to make a grateful acknowledgement for Professor Yang. This work was supported in part by the National Natural Science Foundation of China (NNSFC) for the Distinguished Young Scholar under Grant No 19725521 and NNSFC under Grant Nos. 10535010, 19705012, 10328259 and 10135030, the Shanghai Development Foundation for Science and Technology under Grant Numbers 06JC14082, 05XD14021 and 97QA14038, the Major State Basic Research Development Program under Contract No G200077404.
References
References
- [1] B. Lynden-Bell, Physica A 263 (1999) 293.
- [2] G. F. Bertsch, Science 277 (1997) 1619.
- [3] J. E. Finn et al., Phys. Rev. Lett. 49 (1982) 1321.
- [4] G. F. Peaslee et. al., Phys. Rev C49 (1994) R2271
- [5] C. A. Ogilvie et al., Phys. Rev. Lett. 67 (1991) 1214.
- [6] M. B. Tsang et al., Phys. Rev. Lett. 71 (1993) 1502.
- [7] Y. G. Ma and W. Q. Shen, Phys. Rev. C 51 (1995) 710.
- [8] M. F. Rivet et al., Phys. Lett. B 388 (1996) 219.
- [9] D. H. E. Gross, Rep. Prog. Phys. 53 (1990) 605 and references therein.
- [10] J. Pochodzalla et al., Phys. Rev. Lett. 75 (1995) 1040.
- [11] J. B. Natowitz et al., Phys. Rev. C 62 (2002) 034618.
- [12] Y.G. Ma et al. (INDRA Collaboration), Phys. Lett. B390 (1997) 41.
- [13] J. B. Natowitz, K. Hagel, Y. G. Ma, M. Murray, L. Qin, R. Wada, J. Wang, Phys. Rev. Lett. 89 (2002) 212701.
- [14] M. L. Gilkes et al, Phys. Rev. Lett. 73 (1994) 1590.
- [15] F. Gulminelli, M. D’Agostino, ”Fluctuations of fragment observables”, to be published in Eur. Phys. J. A.
- [16] Ph. Chomaz et al., Phys. Rev. Lett. 85 (2000) 3587.
- [17] M. Schmidt et al., Phys. Rev. Lett. 86 (2001) 1191.
- [18] M. Labastie and R. L. Whetten, Phys. Rev. Lett. 65 (1990) 1567.
- [19] B. Borderie et al., Phys. Rev. Lett. 86 (2001) 3252.
- [20] B. Borderie, P. Désesquelles, ”Many fragments correlations”, to be published in Eur. Phys. J. A.
- [21] O. Lopez, M.F. Rivet, ”Bimodalities: a survey of experimental data and models”, to be published in Eur. Phys. J. A.
- [22] R. Botet et al., Phys. Rev. Lett. 86 (2001) 3514.
-
[23]
Y. G. Ma, Phys. Rev. Lett. 83 (1999) 3617;
Y. G. Ma, Nucl. Phys. A 681 (2001) 476c; - [24] Y. G. Ma, Chin. Phys. Lett. 17 (2000) 340;
- [25] Y. G. Ma, ”Moment analysis and Zipf law”, to be published in Eur. Phys. J. A.
-
[26]
Y. G. Ma et al. (NIMROD Collaboration), Phys. Rev. C 69,
031604(R) (2004);
Y. G. Ma et al. (NIMROD Collaboration), Phys. Rev. C 71, 054606 (2005). - [27] A. Dabrowska et al., Acta Phys. Polo. B 32 (2001) 3099.
- [28] J. B. Elliott et al., Phys. Rev. Lett. 88 (2002) 042701; Phys.Rev. C 67 (2003) 024609 .
- [29] J. B. Elliott et al., Phys. Rev. C 67 (2003) 24609.
- [30] J. Richert and P. Wagner, Phys. Rep. 350 (2001) 1.
- [31] S. Das Gupta, A. Mekjian and M. B. Tsang, Adv. Nucl. Phys. 26 (2001) 91.
- [32] A. Bonasera, M. Bruno, C.O. Dorso, P.F. Mastinu, Riv. Del Nuovo. Cim. 23 (2000) 1.
- [33] Ph. Chomaz, Proc. of the Int. Nucl. Phys. Conf. INPC2001, Berkeley CA, USA, 2001, ed. by E. Norman, L. Schroeder, G. Wozniak, AIP Conference Proceedings (Melville, New York 2002), p. 167.
- [34] L.G. Moretto, J.B. Elliott, L. Phair, G.J. Wozniak, C.M. Mader, and A. Chappars, ibid. p. 182.
-
[35]
Y. G. Ma, H. Y. Zhang and W. Q. Shen,
Prog. Phys. (in Chinese) 22 (2002) 99;
Y. G. Ma, W. Q. Shen, Nucl. Sci. Tech. 15 (2004) 4;
Y. G. Ma et al., Phys. Rev. C 60 (1999) 024607;
Y. G. Ma et al., Eur. Phys. J. A 4 (1999) 217;
Y. G. Ma, J. Phys. G 30 (2004) 13; - [36] A. S. Hirsch et al., Phys. Rev. C 29 (1984) 508.
- [37] R. W. Minich et al., Phys. Lett. 118B (1982) 458.
- [38] M. E. Fisher, Rep. Prog. Phys. 30 (1969) 615; Physics 3 (1967) 255.
- [39] Y. G. Ma et al., Nucl. Phys. A 749, 106c (2005)
- [40] H. E. Stanley, Introduction to Phase Transitions and Critical Phenomena, Oxford University Press, Cambridge, England, 1992.
-
[41]
X. Campi, J. Phys. A: Math. Gen. 19 (1988)
L917;
X. Campi, Phys. Lett. B 208 (1988) 351. - [42] C. O. Dorso, V.C. Latora, and A. Bonasera, Phys. Rev. C 60 (1999) 034606.
- [43] G.K. Zipf, Human Behavior and the Principle of Least Effort, Addisson-Wesley Press, Cambridge, MA, 1949; D. Crystal, The Cambridge Encyclopedia of Language, Cambridge University Press, Cambridge, 1987, p86.
- [44] Y. G. Ma, Eur. Phys. J. A 6 (1999) 367.
- [45] Y. G. Ma, J. Phys. G 27 (2001) 1.