Spectroscopy of 9C via resonance scattering of protons on 8B.
Abstract
The structure of the neutron-deficient 9C isotope was studied via elastic scattering of radioactive 8B on protons. An excitation function for resonance elastic scattering was measured in the energy range from 0.5 to 3.2 MeV in the center-of-momentum system. A new excited state in 9C was observed at an excitation energy of 3.6 MeV. An R-matrix analysis indicates spin-parity 5/2- for the new state. The results of this experiment are compared with Continuum Shell Model calculations.
I introduction
Light nuclei play a central role in nuclear physics since they are the simplest cases where nuclear many-body dynamics can be understood and explored. This special role is reflected in the number of different theoretical approaches that exist, and overlap, in addressing the structure of light nuclei. The techniques range from full ab initio methods, such as the Green’s Function Monte Carlo method Pieper et al. (2002) or the Large Basis No-Core Shell Model method Navratil and Barrett (1998), in which the properties of light nuclei are computed starting from bare nucleon-nucleon interactions, to the traditional shell-model approach with renormalized or phenomenologically-determined interactions, to cluster models. Light nuclei also provide an important arena for exploring physics on the interface between structure and reactions. The dawn of modern structure-reaction unification is marked by several recent theoretical developments: the Gamow Shell Model (GSM) Michel et al. (2003) and Continuum Shell Model (CSM) Volya and Zelevinsky (2005) in particular. Realistic tests of these models constitute an important step both in theoretical developments in the description of the properties of exotic nuclei and in furthering our understanding of the role that exotic resonances play in nuclear astrophysics.
In the analysis of the experimental study reported below we use the CSM approach which permits calculation of resonance parameters and cross sections, thus allowing a direct comparison with experimental data. A comparison with older techniques such as a traditional R-matrix analysis with shell-model spectroscopic factors highlights their limitations and gives a valuable insight into physics on the reaction/structure borderline encompassed by the advanced CSM technique.
The focus of this work is the structure of an exotic neutron-deficient dripline isotope of carbon, 9C, which has a halflife of 126.5 ms and a binding energy of 1.3 MeV. Spectroscopic information about this nucleus is scarce. The ground state of 9C was first identified in the 12C(3He,6He) reaction by Cerny, et al. Cerny et al. (1964) in 1964. Ten years later, the first excited state of 9C was observed at 2.2 MeV using the same reaction Benenson and Kashy (1974). More recently, 12C(3He,6He) was yet again studied in Ref. Golovkov et al. (1991). The authors of this work claim to have seen another excited state at about 3.3 MeV. However, the complicated nature of the reaction mechanism did not allow for a reliable spin-parity assignment. Instead, indirect arguments were given favoring spin-parity of 5/2+ for this level Golovkov et al. (1991).
Modern experimental techniques allow for the use of beams of radioactive nuclei to populate states in exotic isotopes by means of simple reactions such as one-nucleon transfer or resonance elastic scattering. As a result, more reliable identification on the properties of the observed states can now be obtained. In the present work, excited states in 9C are populated via resonance elastic scattering of radioactive 8B on protons. The main goal of this work was to identify the excited states in 9C and compare the properties of these states with theoretical predictions.
II Experiment
The experiment was performed using the TwinSol radioactive nuclear beam (RNB) facility at the University of Notre Dame Lee et al. (1999). A 2.5 cm long gas target containing 1 atm of 3He was bombarded by a nanosecond-bunched primary 6Li beam at an energy of 39.0 MeV and intensity of 200 electrical nA. The two-proton pickup reaction 3He(6Li,8B)n was used to produce the 8B ions. The entrance and exit windows of the gas cell consisted of 2.0 m Havar foils. The secondary 8B beam was momentum selected and transported through the two superconducting solenoids, which focused it into a 5 mm spot on a 9.0 mg/cm2 plastic (CH2) target. The laboratory energy of the 8B beam at the secondary target position was 29 MeV, with a resolution of 0.7 MeV full width at half maximum (FWHM) and an intensity of up to 104 particles per second. The energy spread was due to a combination of the kinematic shift in the production reaction plus energy-loss straggling in the gas-cell windows. Contaminant ions which had the same magnetic rigidity as 29 MeV 8B also were present in the beam, but they could be identified using the time-of-flight (TOF) technique. The TOF of the particles was obtained from the time difference between the occurrence of an E signal in a detector telescope and the RF timing pulse from the beam buncher. The time resolution of better than 5 ns (FWHM) was adequate to cleanly separate 8B from all other ions (except for some direct protons as will be discussed further in the text). This is illustrated in Fig. 1, which was obtained with a 1.0 mg/cm2 Au target and a Si E-E telescope placed at 7.7∘ with respect to the beam axis. The intensity of the beam during the experiment was determined from the ratio of the 8B ions to the integrated charge of the primary 6Li beam collected in the TwinSol Faraday cup. This ratio was measured by placing the Si E-E telescope directly at the target position.

The thick-target inverse-kinematics technique Artemov et al. (1990) was used to measure the excitation function of 8B+p resonance elastic scattering. The plastic target was thick enough (9.0 mg/cm2) to stop the 29 MeV 8B ions. The recoil protons from back-angle elastic scattering in this target lose only a small amount of energy in traversing the foil and emerge from it with sufficient energy to be detected. Note that the lowest-energy protons, from the scattering of 8B ions near the end of their range, encounter the least amount of material before leaving the target. In this manner, an excitation function for elastic scattering down to very low energies can be measured with high efficiency and good energy resolution. The recoil protons were detected with two telescopes consisting of 19.5 and 19.2 m Si E detectors, backed by 1000 m Si E detectors. The active area of the E detectors was 450 mm2, and that of the E detectors was 600 mm2. Each telescope had a circular collimator with a diameter of 18 mm that subtended a solid angle of 11.6 msr. They were placed on either side of the beam at 7.7∘ with respect to the beam axis. It would have been preferable to place a telescope at 0∘ to the beam but the light-ion contamination (Fig. 1) produced a count rate in this position that was unacceptable since these ions penetrated the target and directly entered the telescope.
It was verified that the recoil proton TOF signal was only slightly shifted in time relative to 8B and was stable during the course of the experiment so that the separation from elastic scattering of contaminant ions was excellent. Nevertheless, a background associated with direct protons scattered by the plastic target was still present in the proton spectrum measured by the telescopes, even after the TOF gate. The origin of this proton background is the unfortunate coincidence between the difference of the actual flight times of 8B and protons from the primary to the secondary target (80 ns) and the half-period of the buncher (100 ns). Because of this coincidence, a small fraction of the direct protons from the tail of the proton time distribution overlaped with the timing of the 8B ions from the “previous” bunch. This background was reduced by two orders of magnitude after a pulse selection was introduced (the efficiency of pulse selection was 99%), making the period between beam bunches 200 ns. Still, some direct protons from the tail of the proton time distribution leaked into the gate, as shown in Fig. 2 which represents the raw proton spectrum measured by one of the telescopes gated by the 8B TOF. This background was eliminated by subtracting the spectrum of protons gated on timing in the region between 8B and 7Be (dashed line in Fig. 2) from the spectrum of protons associated with 8B.

Another source of background are protons produced in the interaction of the 8B with carbon in the plastic target. These protons have exactly the same timing as the recoil protons from elastic scattering of 8B on hydrogen. The spectrum of this process, measured using a 15.8 mg/cm2 thick carbon target is shown as the shaded histogram in Fig. 3, together with the total spectrum of protons from the plastic target measured by both telescopes. The thickness of the carbon target was adjusted to match the thickness of the plastic target in terms of energy loss. The “carbon” background spectrum was scaled by a factor of 1.98 to reflect the difference between the integrated number of 8B ions accumulated during the main and background runs, adjusted to account for the different number of carbon atoms per cm2 for the same energy loss in the carbon and plastic targets. The polynomial fit to the “carbon” background (shown as a solid line in Fig. 3) was then subtracted from the spectrum of protons obtained with the plastic target.

III Structure of 9C in the Continuum Shell Model.
The continuum of reaction states is an inseparable part of the 9C structure. Thus, for the analysis and interpretation of the experimental results we used the Continuum Shell Model (CSM) developed in Ref. Volya and Zelevinsky (2005). The traditional shell-model (SM) Hamiltonian that describes the internal evolution of the system is supplemented here with the continuum of reaction states. For the model Hamiltonian we use an s-p-sd-pf valence space with the WBP interaction Brown (2001). The Hamiltonian for protons in the continuum is given by a Woods-Saxon potential. The parameters of this potential were taken from Ref. Schwierz et al. . The experimental value of the reduced mass of the 8B+ system was used. For the discussion here, the relevant set of channels includes the ground state and first excited state of 8B. These states are well reproduced by the above WBP interaction, but the CSM reaction calculations were performed using the actual experimentally-known -values. The results from the CSM calculation are presented in Table 1. This table also includes the spectroscopic factors computed for the corresponding channels.
The spectroscopic factors are defined here in a conventional way as overlap integrals , neglecting the effects of the continuum. Using these spectroscopic factors, and the decay widths resulting from the potential-model calculation, a perturbative approach can also be used to estimate the decay widths. The results of the perturbative calculation (not shown) are extremely close to those from the full CSM calculation given in the table. This agreement highlights the fact that CSM, by construction, extends the traditional SM approach yet yields identical results for bound states and almost unchanged results for isolated narrow resonances as the conventional SM. To assess the role of the continuum beyond the lowest order in perturbation, in the third column we show the eigenstate reorientation angle , defined as . This angle reflects the relative change in the wave function due to the presence of the continuum. For bound states, the angle is zero confirming that SM and CSM eigenstates are identical. The second shows a noticeable deviation which can be explained by its interaction through the continuum with a higher-lying state at 6.27 MeV in excitation having a width (determined by the CSM) of 3.6 MeV. Despite their almost 2.6 MeV separation, the large widths allow these two states to overlap leading to the noticeable changes in the structure. The case of the state is similar.
It is well established that parametrization of a broad resonance by the energy of its centroid and its width is particularly ambiguous in the case of broad and/or overlapping resonances, as well as those close to thresholds. The above case of the interference between states is a good example of this phenomenon. The interference effects, while having a moderate effect on the parameters of the resonances, nonetheless result in noticeable changes in the cross sections. In Fig. 8 (discussed below), the CSM was used to calculated the inelastic 8B+p cross section, which at low energies is dominated by the above mentioned pair of states. While the appearance of the peaks is very consistent with a parametrization by energy and width, the off-peak behavior reflects the significant role of interference. The comparison with R-matrix calculations that include only a single resonance is indicative of this phenomenon. (Further comparison of cross section curves and theoretical methods is interesting but remains beyond the scope of this paper.)
Given the large variety of available shell model interactions, we estimate the theoretical uncertainty in our results by conducting another calculation with a different interaction. The “PWT" interaction Brown (2001) was used for the results given in Table 2. This older interaction includes only the p-shell. The Woods-Saxon Hamiltonian describing the continuum remained unchanged in this calculation.
| Eth | Eexp | |||||||||
|---|---|---|---|---|---|---|---|---|---|---|
| Jπ | (MeV) | (MeV) | (MeV) | deg | S(p3/2) | S(p1/2) | S(p3/2) | S(p1/2) | ||
| 3/2- | 0.00 | 0.00 | 0.000 | 0.0 | 0.87 | 0.00 | 0.0 | 0.18 | 0.00 | 0.0 |
| 1/2- | 1.4 | 2.2 | 0.027 | 0.1 | 0.18 | 0.00 | 0.15 | 0.75 | 0.00 | 7.6E-3 |
| 5/2- | 3.9 | 3.6 | 1.30 | 5.1 | 0.13 | 0.59 | 1.80 | 0.00 | 0.00 | 0.59 |
| 3/2- | 4.1 | - | 1.32 | 10.8 | 0.08 | 0.09 | 3.19 | 0.23 | 0.47 | 1.14 |
| S(d5/2) | S(d3/2) | S(s1/2) | S(d5/2) | S(d3/2) | S(s1/2) | |||||
| 3/2+ | 4.2 | - | 2.1 | 16.0 | 0.00 | 0.01 | 0.41 | 0.05 | 0.002 | 0.03 |
| Ex | ||||||||
|---|---|---|---|---|---|---|---|---|
| Jπ | (MeV) | (MeV) | S(p3/2) | S(p1/2) | S(tot) | S(p3/2) | S(p1/2) | S(tot) |
| 3/2- | 0.00 | 0.000 | 0.95 | 0.02 | 0.97 | 0.34 | 0.03 | 0.37 |
| 1/2- | 2.2 | 0.045 | 0.30 | 0.0 | 0.30 | 0.49 | 0.01 | 0.50 |
| 5/2- | 3.6 | 1.44 | 0.11 | 0.68 | 0.79 | 0.03 | 0.00 | 0.03 |
| 3/2- | 4.1 | 1.25 | 0.01 | 0.16 | 0.17 | 0.24 | 0.38 | 0.62 |
IV Inelastic background in the proton spectrum.
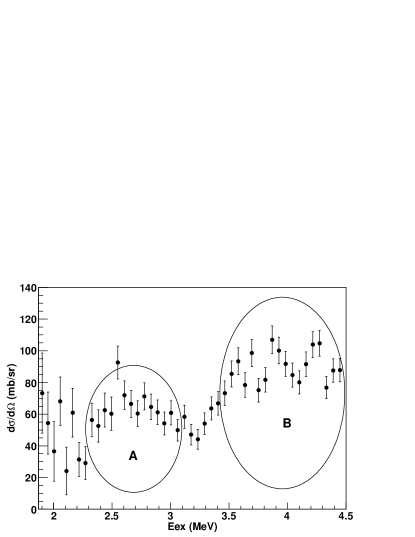
The excitation function for the resonance scattering of 8B on protons is shown in Fig. 4. The background associated with carbon in the target and with direct protons has been subtracted as described in Sec.II above. Conversion into the center-of-momentum (c.m.) system was performed individually for each bin of the histogram by a computer code which takes into account the geometry of the experiment, the integrated number of accumulated 8B ions, the energy losses of the 8B and protons in the target, and the effective target thickness for a specific bin. Two major features in the excitation function, indicated by ellipses and labeled by letters A and B, are apparent in Fig. 4. These features could have been associated with broad resonances at excitation energies 2.7 MeV and MeV in 9C, but no states were reported or predicted in 9C at these excitation energies Tilley et al. (2004). The only known excited state in 9C is a narrow (100 keV) 1/2- state at 2.2 MeV which cannot be associated with either of these features.
More information is available on the level structure of the mirror nucleus 9Li. The second excited state in 9Li, which has a tentative spin-parity assignment of 5/2-, has been observed at an excitation energy of 4.3 MeV Tilley et al. (2004). The analog state is a good candidate for an explanation of the second peak in the 8B+p excitation function (feature B in Fig. 4). However, the first peak (feature A) has no suitable counterpart in the spectrum of 9Li. The large width of this peak (500 keV) at 1.3 MeV above the threshold for proton decay indicates that the wave function of this state should have a significant contribution from the single particle configuration . A state with such properties should have been observed in the recent 8Li(d,p) experiment of Wuosmaa, et al., yet no states between the known 1/2- state at 2.6 MeV and the state at 4.3 MeV were observed Wuosmaa et al. (2005).
Various theoretical calculations also fail to offer any hint on what the structure at 2.7 MeV might be. No states in 9Li/9C between the 1/2- and 5/2- states are predicted, either by large basis no-core shell-model calculations Navratil and Barrett (1998), or by Quantum Monte Carlo calculations Pieper et al. (2002). (These predictions have to be treated with caution since configurations that allow positive parity states were not included). Continuum Shell Model (CSM) calculations, described in the previous section, also predict no states between the 1/2- and the 5/2- states. The considerations discussed above do not completely rule out a state at 2.7 MeV in 9C, but they make its existence very unlikely and stimulate the search for another explanation of this feature.
The main disadvantage of the experimental technique used in this experiment is the inability to distinguish between elastic and inelastic scattering. Indeed, in the case of inelastic scattering, the recoil proton produced in the process also can hit the detector and hence be mistaken for an elastically-scattered proton. Normally, at low excitation energies, the cross section for resonance elastic scattering is much higher than that for inelastic scattering and the contribution from inelastic processes can safely be ignored. In fact, this is almost the case here. Estimations made using both CSM and R-matrix approaches (details are given in the following section) produce a cross section for the inelastic process which is one order of magnitude lower than that for elastic scattering. However, since the excitation energy of the first excited state of 8B is 0.77 MeV, which is 0.63 MeV above the threshold of the 8B proton decay, an extra proton will be produced in the inelastic scattering process. Moreover, due to the inverse kinematics of the experiment, the extra proton will be focused more toward forward angles, increasing the chance to hit the detectors. The energy of this proton can be estimated using the following arguments. The cross section for inelastic scattering is likely to increase toward higher beam energies due to higher penetrability factors. Hence most of the “inelastic” protons are produced at the beginning of the target. After inelastic scattering, the 8B recoils are focused into a narrow cone (6∘ with respect to the beam axis) and have an energy of 3.0 MeV/A. The energy of protons produced in the decay of the excited state of 8B is:
| (1) |
where Q is the decay energy (0.63 MeV) and is the angle between the momentum vectors of the proton and the 8B, which has to be close to 0∘ or 180∘ in order for the proton to hit the detector at 7∘. If is 0∘, then Ep is roughly 6 MeV. The energy loss of 6 MeV protons in the 9 mg/cm2 plastic target is 1 MeV. This leaves us with 5 MeV protons in the detector. Note that only a limited range of angles can produce a hit in the detector. Hence the protons from the decay of the first excited state of 8B will peak at around 5 MeV. This is exactly the energy of the first peak (A) in the laboratory frame (see Fig. 3). On the other hand, if the angle is close to 180∘ the proton energy will be 1.0 MeV and these protons will be stopped in the target. Therefore, only one peak from the proton decay of the 8B first excited state can be observed.
A realistic Monte-Carlo simulation of the inelastic scattering 1H(8B,p’)8B∗(1+;0.77 MeV) with subsequent proton decay of 8B was performed. The simulation took into account the specific geometry of the experiment, the kinematics of the process, energy losses of the 8B and protons in the target, energy straggling, and multiple scattering (the GEANT 3.21 package was used Brun et al. (1994)). The result of this simulation is shown in Figure 5. The first peak of the shaded histogram in Fig. 5 is associated with protons from the decay of the excited 8B state, and the second peak corresponds to the recoil protons inelastically scattered by 8B. It can be seen from Fig. 5 that “inelastic” protons can entirely account for the peak observed in the proton spectrum at 5 MeV if the cross section for inelastic scattering of 8B is 1/10 of the elastic cross section at 29 MeV. In the following analysis, we will assume that this is the case and subtract the “inelastic” proton contribution from the excitation function.

V R-matrix analysis
The excitation function of resonance elastic scattering of 8B on protons resulting from the subtraction of “direct” proton background, “carbon” background and assumed “inelastic” proton background, and converted into the c.m. system, is shown in Figure 6. A two-channel multi-level R-matrix approach was then applied for the analysis of the excitation function. Besides the elastic channel, the first inelastic channel was included in the R-matrix calculation. In order to make the R-matrix fit more realistic, we start by deducing the reduced-width amplitudes from the CSM spectroscopic amplitudes. Since these amplitudes have been calculated in the jj-coupling scheme, they must be re-coupled into LS coupling as used in the R-matrix approach. This can be accomplished using the 6-symbols, according to the following expression:
| (2) |
where corresponds to a specific channel with a set of quantum numbers J, , S (the channel spin ), I1 (the spin of the projectile), I2 (the spin of the target), is the reduced mass, is the channel radius (4.5 fm), and is the CSM spectroscopic amplitude (the relative phase was calculated in the CSM and defined by the sign of the ). The sum is taken over the relevant single-particle orbits ( and for p-shell states). Reduced-width amplitudes, calculated as described above, were then varied about the calculated values to obtain the best fit to the data shown in Fig. 6.
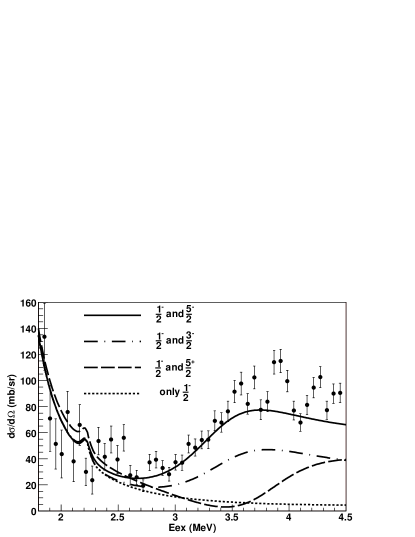
It is clear that the known 1/2- first excited state of 9C, at an excitation energy of 2.2 MeV and having a width of 100 keV Tilley et al. (2004), cannot account for the large cross section observed at higher energy (dotted curve in Fig 6). Introduction of a broad 5/2- state at an excitation energy of 3.6 MeV produces a reasonable agreement between the R-matrix calculation and the experimental data (solid curve in Fig. 6). The excitation energy and width of the assumed state are MeV and MeV, respectively. No other spin-parity assignment for the state at 3.6 MeV agrees with the experimental data. The cross section for the 3/2- state is too small (dash-dotted curve in Fig. 6), and the positive parity states, with =0 dominant partial wave, produce a dip in the excitation function due to destructive interference (dashed curve in Fig. 6).
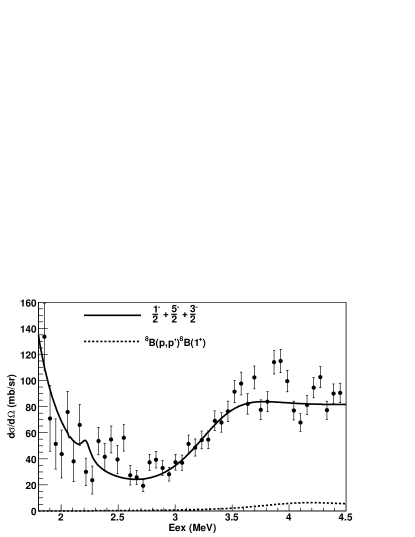
Two problems can be identified in the description of the excitation function as a combination of only two states, and . First, the measured cross section is still somewhat higher at 4 MeV than can be accounted for by the state in 9C. Second, the state is essentially a single-particle state and decays predominantly to the ground state of 8B. If no other states are introduced, the cross section for inelastic scattering [1H(8B,p’)8B(1+)] would be too small to account for the “inelastic” peak at 5 MeV in the laboratory proton spectrum (Fig. 5). Both problems can be resolved at once if an additional state with substantial contribution from the 8B(1+)+p configuration is introduced. The CSM calculations predict two states in close proximity to the state (see Table 1). These are and states at 4.1 and 4.2 MeV. The wave function of the state has a large inelastic component (Table 1). Hence, the introduction of this state can potentially fix both problems by increasing the cross section at MeV and explaining the observed “inelastic” peak. The solid curve in Fig. 7 shows an R-matrix fit with , and states. The dashed curve in Fig. 7 represents the inelastic excitation function due to the state. The best-fit R-matrix parameters for all three states are shown in Table 3 (the values given in parenthesis are reduced-width amplitudes calculated from CSM spectroscopic amplitudes using the WBP Brown (2001) interaction, according to the expression 2). The parameters for the state (energy eigenvalue and elastic reduced-width amplitude) were adjusted to reproduce the experimental excitation energy and width Tilley et al. (2004). The parameters for the state were derived from CSM and were not varied. As follows from the Table 3, no significant modifications of the calculated CSM reduced-width amplitudes (except for the elastic reduced-width amplitude of the state) were necessary to fit the experimental data.
| S | Bc | |||||
| Jπ | ||||||
| Eex (MeV) | 2.22 | 3.6 | 4.1 | |||
| Eλ (MeV) | 0.61 | 3.45 | 4.15 | |||
| (MeV) | 0.10 | 1.4 | 1.3 | |||
| 1 | -1.2 | 1.15 (0.65) | 0.33 (0.47) | 0.17 (0.17) | ||
| p+8B(g.s.) | 1 | -1.2 | - | -1.34 (-1.20) | 0.59 (0.59) | |
| 1 | -1.2 | 1.25 (1.25) | - | -0.15 (-0.15) | ||
| p+8B(1+) | 1 | -1.2 | 0.42 (0.42) | 0.00 (0.00) | 1.27 (1.27) |
VI Discussion
The main result of this work is a firm identification of the resonance in 9C. Its excitation energy is 3.60.2 MeV and its width is 1.40.5 MeV. This state is a feature of all theoretical calculations, ab initio Pieper et al. (2002); Navratil and Barrett (1998) and shell-model alike, which seem to agree on the structure and excitation energy of the state. These predict that it should be in the vicinity of 3.5 MeV and have a single particle structure with spectroscopic factor of about 0.8. The experimental width of the state is in very good agreement with the CSM width (1.30 MeV). Based on this comparison, the experimental single-particle spectroscopic factor of the state is 0.770.25. This result is also in very good agreement with the recent experimental result of Wuosmaa, et al. Wuosmaa et al. (2005), in which the spectroscopic factor of the mirror state in 9Li was measured to be 0.930.2 using the 8Li(d,p) reaction.
Unfortunately, the statistics in the present experiment were not sufficient to observe the weak first excited state. The direct observation of this state in the 8B+p excitation function would allow for an accurate measurement of its width. At the moment, it seems that theoretical calculations (especially shell model) tend to underestimate the single particle spectroscopic factor of this state. The width of this state in 9C was determined in a single, low-statistics experiment using the 12C(3He,6He) reaction Benenson and Kashy (1974), and the measured value of 10020 keV indicates that the spectroscopic factor of the state is 0.670.15 based on a comparison to the CSM width given in Table 1. A similar result was obtained for the spectroscopic factor of the state in 9Li using the 8Li(d,p) reaction Wuosmaa et al. (2005). However, the theoretical predictions for the spectroscopic factor (which range from 0.17 to 0.5 depending on the model and interaction used in the SM) are consistently lower than the experimental value. Hence, it would be of interest to verify the result of the previous experiment and improve the experimental accuracy for the value of the width of this state.
In addition to the known state and the proposed new state, the experimental data indicate the presence of an additional state or states at or above 4 MeV with strong decay branch(es) into the first excited state of 8B. The state predicted by CSM at 4.1 MeV (Table 1) seems to be a good candidate. The inclusion of the state improved the fit and provided for an explanation of the “inelastic” peak at 5 MeV of proton laboratory energy. The inelastic cross section due to the state (shown in Figure 7) was calculated using an R-matrix approach with parameters for the state derived from the CSM as described in the previous section. This cross section can also be calculated directly in the CSM approach in which all the resonances (including resonances at higher excitation energy) are included automatically with correct interference. The comparison of the total 8B(p,p’)8B(1+) inelastic cross section, calculated using the R-matrix approach and the CSM, is shown in Fig. 8. The magnitude and the shape of the total inelastic cross section is similar in both calculations. This comparison is instructive in many ways. First, it shows that the R-matrix calculation with reduced-width amplitudes derived from the CSM spectroscopic amplitudes using Eq. 2 produces a cross section in the vicinity of the resonance which is similar to the one calculated directly in the CSM . Second, it indicates that, while the resonance included in the R-matrix calculation determines the inelastic cross section at 4 MeV, the shape of the inelastic cross section is influenced by higher- lying resonances (especially by the next state). The CSM automatically takes this into account, providing a realistic estimate of the influence of background resonances and accounting for the possible interference of this background with the main resonances. This feature of the CSM is important for future studies of the properties of exotic nuclei in resonance scattering. Unfortunately, due to the limited excitation energy range, relatively low statistics, and inability to separate elastic from inelastic processes, the inelastic cross section cannot be accurately extracted from the present experimental data and the actual parameters of the state cannot be determined.

In Ref. Golovkov et al. (1991), the authors claim that they observe a resonance in 9C at 3.3 MeV in the 12C(3He,6He) reaction. Based on the assumption of mutual correspondence between the 4.3 MeV state in 9Li and the observed state in 9C, they concluded that the state cannot be , arguing that the observed Thomas-Ehrman shift is too large for an =1 state. A spin-parity assignment was proposed instead. However, close examination of the 6He spectrum in Fig. 1 of Ref. Golovkov et al. (1991) reveals that, due to low statistics and poor experimental resolution ( keV), the spectrum allows for a different interpretation and also does not contradict assignment of a broad state at 3.6 MeV. Moreover, the value for the Thomas-Ehrman shift of the state in 9Li/9C can be estimated from a simple potential model assuming a pure single-particle nature for this state. For example, a Woods-Saxon potential with common parameters ( fm, fm) and depth adjusted to reproduce the c.m. energy of the 4.3 MeV state in 9Li gives 0.5 MeV for the Thomas-Ehrman shift of the =1 state. This value is a factor of four bigger than the one assumed in Ref. Golovkov et al. (1991) and suggests that the excitation energy of the state in 9C should be 3.8 MeV. This value is in very good agreement with the results of this work, lending further support to a spin-parity assignment for the resonance in question.
VII Conclusion
The excitation function for resonance scattering 8B+p was measured using the thick-target inverse-kinematics technique. A 9C excitation energy range from 1.8 MeV to 4.5 MeV was covered. One new state in 9C was identified at an excitation energy of 3.60.2 MeV, having a width of 1.40.5 MeV. R-matrix analysis of the excitation function allows for a unique spin-parity assignment to this state. It has a single-particle nature with a spectroscopic factor of 0.770.25, consistent with theoretical predictions of the ab initio models and CSM calculations, and also with recent experimental results for the presumed mirror state in 9Li Wuosmaa et al. (2005). The measured excitation function indicates the existence of higher-lying states with strong inelastic decay branches. A new measurement with higher statistics, broader excitation energy and angular range coverage is highly desirable. The new experiment must be designed in a way that allows for separation of elastic and inelastic scattering.
Using the CSM as a part of the analysis, we attempted to take a step beyond the typical perturbative approach based on spectroscopic factors and R-matrix analysis. In the case of the newly-discovered resonances, due to their isolated nature, the role of the continuum appears to be reasonably well described by perturbation theory. However, the onset of physics that demands the use of a unified structure-reaction approach is clearly indicated. As an example, the experimental analysis hinges on tracking the contribution from an inelastic channel that appears to be dominated by overlapping resonances. The CSM was used to compute the cross section for this process, and comparison with the R-matrix fit indicates a non-trivial nature for new physics on the structure/reaction border that is successfully captured by the novel CSM technique.
Acknowledgements.
The authors are grateful to Prof. Goldberg for helpful discussions. This work was supported by the National Science Foundation under Grant Nos. PHY04-56463 and PHY03-54828, and by U.S. Department of Energy Contract No. DE-FG02-92ER40750.References
- Pieper et al. [2002] S. C. Pieper, K. Varga, and R. B. Wiringa, Phys. Rev. C 66, 044310 (2002).
- Navratil and Barrett [1998] P. Navratil and B. R. Barrett, Phys. Rev. C 57, 3119 (1998).
- Michel et al. [2003] N. Michel, W. Nazarewicz, M. Ploszajczak, and J. Okolowicz, Phys. Rev. C 67, 054311 (2003).
- Volya and Zelevinsky [2005] A. Volya and V. Zelevinsky, Phys. Rev. Lett. 94, 052501 (2005).
- Cerny et al. [1964] J. Cerny, R. H. Pehl, F. S. Goulding, and D. A. Landis, Phys. Rev. Lett. 13, 726 (1964).
- Benenson and Kashy [1974] W. Benenson and E. Kashy, Phys. Rev. C 10, 2633 (1974).
- Golovkov et al. [1991] M. S. Golovkov, V. Z. Goldberg, L. S. Danelyan, V. I. Dukhanov, I. L. Kuleshov, A. E. Pakhomov, I. N. Serikov, V. A. Timofeev, and V. N. Unezhev, Sov. J. Nucl. Phys. 53, 550 (1991).
- Lee et al. [1999] M. Y. Lee, F. D. Becchetti, T. W. O’Donnell, D. A. Roberts, J. A. Zimmerman, V. Guimaraes, J. J. Kolata, D. Peterson, P. Santi, P. A. DeYoung, et al., Nucl. Instrum. Methods Phys. Res., Sect. A 422, 536 (1999).
- Artemov et al. [1990] K. P. Artemov, O. P. Belyanin, A. L. Vetoshkin, R. Wolski, M. S. Golovkov, V. Z. Goldberg, M. Madeja, V. V. Pankratov, I. N. Serikov, V. A. Timoveef, et al., Sov. J. Nucl. Phys. 52, 408 (1990).
- Brown [2001] B. A. Brown, Prog. Part. Nucl. Phys. 47, 517 (2001).
- [11] N. Schwierz, I. Wiedenhover, and A. Volya, submitted to Phys. Rev. C.
- Tilley et al. [2004] D. R. Tilley, J. H. Kelley, J. L. Godwin, D. J. Millener, J. E. Purcell, C. G. Sheu, and H. R. Weller, Nucl. Phys. A 745, 155 (2004).
- Wuosmaa et al. [2005] A. H. Wuosmaa, K. E. Rehm, J. P. Greene, D. J. Henderson, R. V. F. Janssens, C. L. Jiang, L. Jisonna, E. F. Moore, R. C. Pardo, M. Paul, et al., Phys. Rev. Lett. 94, 082502 (2005).
- Brun et al. [1994] R. Brun et al., CERN Program Library Long Write-up, CERN W5013 (1994).