Latest results from NA60
Abstract
The NA60 experiment has measured the production of muon pairs and of charged particles in In+In collisions at a beam energy of GeV. For invariant dimuon masses below the the space-time averaged spectral function was isolated by a novel procedure. It shows a strong broadening but essentially no shift in mass. The production of J/ was measured as a function of the collision centrality. As in previous experiments studying Pb+Pb collisions an anomalous supression is observed, setting in at approximately 90 participant nucleons. Using the charged particles the reaction plane was reconstructed. The elliptic flow of charged particles increases with showing a saturation for GeV/. For the first time azimuthal distributions for J/ are shown.
pacs:
25.75.-q,25.75.Dw,25.75.Ld,25.75.Nq1 Introduction
High-energy heavy-ion collisions provide a unique opportunity to study the behaviour of strongly interacting matter at high densities and at high energy densities. They are the only way to investigate a possible phase transition from hadronic matter to a plasma of deconfined quarks and gluons as well as the restoration of the chiral symmetry which is spontaneously broken in the hadronic world. These issues have been studied by several experiments at the SPS (Super Proton Synchrotron) at CERN and many exciting results were obtained. NA60 is a second generation experiment designed to answer specific questions that still remain open after the completion of these previous experiments.
The main focus of NA60 is the study of muon pair production. The experimental setup is based on the muon spectrometer previously used by NA38 and NA50 [1], separated from the target region by a m long hadron absorber (mostly carbon) and composed of a toroidal magnet, of eight multi-wire proportional chambers and of four scintillator trigger telescopes. A Zero-Degree Calorimeter (ZDC) measures the energy of the spectator nucleons to determine the collision centrality. The muon spectrometer is complemented by a high-granularity silicon pixel tracker of unprecedented radiation tolerance [2, 3] which was constructed using ALICE sensors and readout chips [4]. The tracker, embedded in a 2.5 T dipole magnet in the vertex region, tracks all charged particles before the hadron absorber and determines their momenta independently of the muon spectrometer. It allows for a determination of the primary interaction vertex with an accuracy of m in the transverse plane and m along the beam axis. The matching of the muon tracks before and after the hadron absorber, both in angular and in momentum space, improves the dimuon mass resolution in the region of the vector mesons and to 20 MeV/c2, significantly reduces the combinatorial background due to and K decays and makes it possible to measure the muon offset with respect to the interaction vertex [5]. Measuring all charged particles within the vertex tracker acceptance allows in addition for the reconstruction of the direction of the impact parameter vector and hence to determine the orientation of the reaction plane and to study azimuthal angle distributions of the emitted particles.
The experiment has taken data in 2003 (In+In collisions) and in 2004 (proton+nucleus collisions). The results reported upon in this paper were obtained from the analysis of the data taken in 2003 with a 158 AGeV Indium beam, incident on a segmented Indium target of seven disks with a total of 18% nuclear interaction length. At an average beam intensity of 5107 ions per 5 s burst, about ions were delivered to the experiment and a total of dimuon triggers were recorded.
2 The spectral function
In the low-mass sector () the CERES experiment has studied the production of electron pairs in p+Be/Au, S+Au and Pb+Au collisions [6]. In nuclear collisions a clear excess above the expected hadronic sources has been observed in the dielectron mass distribution. The origin of the excess has been commonly interpreted in terms of thermal production from the dense hadronic gas created in the collision, mainly occurring via the process. Even if it is clear that an in-medium modification of the must be introduced in order to explain the results, the lack of statistics and mass resolution have prevented any detailed understanding of the character of the in-medium changes.
Figure 1 shows the opposite-sign dimuon mass distribution as measured by NA60, integrated over all collision centralities. The combinatorial background of uncorrelated muon pairs mainly originating from and K decays is determined using a mixed-event technique [5]. After subtraction the remaining opposite-sign muon pairs still contain “signal” fake matches (associations of muons measured in the muon spectrometer to non-muon tracks in the vertex tracker), a contribution which is only 7% of the combinatorial background level. It has been determined by an overlay Monte Carlo method.
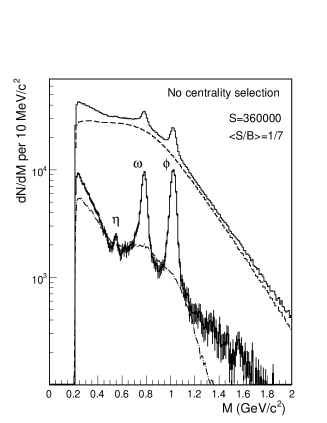
After subtracting the combinatorial background and the signal fake matches, the resulting net spectrum contains about 360 000 muon pairs in the mass range of the figure, roughly 50% of the total available statistics. The analysis is done in four classes of collision centrality defined by the charged particle multiplicity density: peripheral (4-30), semiperipheral (30-110), semicentral (110-170) and central (170-240). Numerically, the average rapidity density in each class is, within , equal to the average number of participants in the class. The signal-to-background ratios associated with these classes are 2, 1/3, 1/8 and 1/11, respectively.
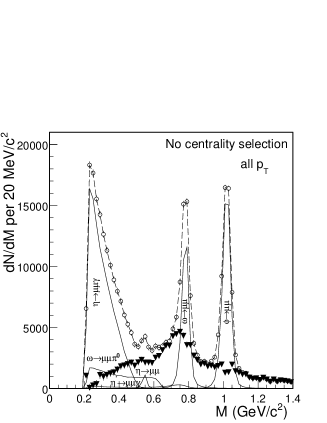
The most peripheral data can be described on the basis of known sources, i.e. the two-muon and the Dalitz decays of the various vector mesons, plus a contribution from open charm decays. The expected mass shape for the various physics processes has been obtained propagating decay muons through the NA60 set-up, using GENESIS [7] (originally based on [8]) as the event generator and GEANT for tracking. This ‘hadronic’ cocktail has been directly fitted to the data and is found to reproduce the observed spectrum quite well [9].
In the more central bins, the data can no longer be described on the basis of the standard hadron decay cocktail alone, but are indicative of the existence of an excess yield. Since the particle ratios are expected to be different from the peripheral data, global fits to the more central data are bound to bias both the extracted cocktail parameters and an excess with a priori unknown characteristics. We have therefore used a novel procedure which is illustrated in Fig. 3 and described in detail in [10]. The excess is isolated by subtracting the cocktail, without the , from the data. The cocktail is fixed, separately for the major sources and in each centrality bin, by a “conservative” approach. The yields of the narrow vector mesons and are fixed so as to get, after subtraction, a smooth underlying continuum. For the , an upper limit is defined by “saturating” the measured data in the region close to GeV/; this implies the excess to vanish at very low mass by construction.
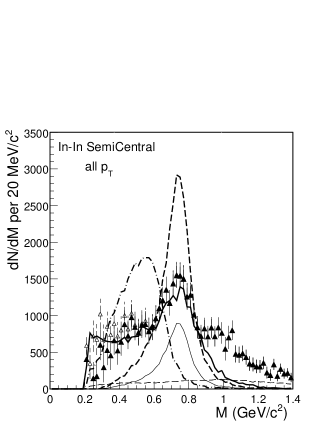
The excess mass spectrum resulting from the subtraction of the “conservative” hadron decay cocktail from the measured data is shown in Fig. 3 for semi-central collisions. The qualitative feature of the spectrum is striking: a peaked structure is seen around the position of the nominal pole. The excess spectrum is consistent with an interpretation of the excess as being dominated by annihilation.
Figure 3 as well shows predictions from theoretical calculations employing the broadening scenario of [11, 12] and the moving-mass scenario related to [13, 14]. Both are evaluated for In+In at within the same fireball evolution. In addition the unmodified is shown. The data shown in this paper have not been corrected for the mass- and -dependent acceptance of the NA60 setup. The theoretical calculations were therefore propagated through the acceptance filter to allow for a fair comparison with the data. The integrals of the theoretical spectra are normalized to the data in the mass interval GeV/. The unmodified is clearly ruled out. The specific moving-mass scenario plotted here, which fitted the CERES data [6, 12, 15], is ruled out as well. The broadening scenario appears more realistic. However, the nearly symmetrical broadening around the pole seen in the data is not reproduced by this model. The remaining excess at GeV/ may well be related to the prompt dimuon excess found by NA60 in the intermediate mass region [5]. Processes other than 2, i.e. 4 … could possibly account for the region GeV/ [16].
3 The anomalous J/ supression
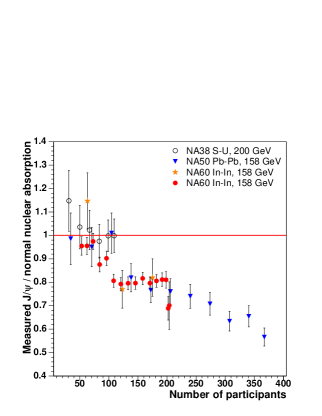
In Pb+Pb collisions above a certain centrality threshold an anomalous J/ suppression has been seen by NA50 [17], i.e. suppression mechanisms different from nuclear absorption must be invoked to explain the observed J/ yield. However, several questions raised by this observation have still to be clarified. By studying the J/ production in In+In collisions NA60 investigates the onset of the anomalous J/ behaviour in systems lighter than Pb+Pb. By comparing the suppression pattern obtained in different systems as a function of various centrality variables it should be possible to single out a scaling variable for the anomalous J/ suppression.
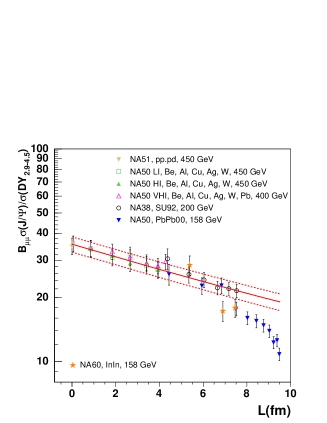
Two different analyses have been performed by NA60 to investigate the centrality dependence of the J/ production, corresponding to two different ways of normalizing its yield [18]. The first technique, the so-called ‘standard analysis’, is based on a normalization to the Drell-Yan events, already widely used in the past by NA38/NA50. The study of the ratio between the J/ and the Drell-Yan cross sections has the advantage of being free from systematic errors connected with the efficiency and luminosity evaluations. However, the statistical error is large due to the small number of high-mass Drell-Yan pairs (a few hundreds); therefore only three centrality bins can be defined using the energy measured in the ZDC (). Figure 5 shows the result as a function of the length of nuclear matter crossed by the charmonium state in comparison to the results of NA38/NA50.
The second technique overcomes the statistical problem by directly studying the measured J/ centrality distribution as a function of and correcting the inefficiencies due to the reconstruction procedure and the event selection which only affect very peripheral events ( TeV) and which are very small (). This distribution is compared to the expected pattern if nuclear absorption was the only active suppression mechanism. This reference curve is obtained with the Glauber model, assuming that J/ production is a hard process, and using mb for the nuclear absorption cross section of the pair [19]. In such an analysis, the relative normalization between data and the reference curve is not fixed a priori. We have therefore imposed the centrality-averaged ratio between data and reference to be equal to the one obtained in the standard analysis. Since the average ratio has been measured with a 7% statistical error, such an overall error (not shown in the figure) applies to the results.
In Fig. 5 the J/ suppression pattern measured in In-In collisions is plotted as a function of the number of participants as determined from (see [20] for details). We take into account the experimental resolution of the detector as well as the influence of fluctuations in at fixed impact parameter. The suppression pattern is compared to the results obtained for S+U and for Pb+Pb by NA50/NA38 [17]. The observed pattern indicates that a suppression is already present in In+In collisions, setting in at participating nucleons. Even if seems to be a reasonable scaling variable for the anomalous suppression it is fair to say that more accurate data for the previously studied collision systems are needed in order to establish a firm conclusion on a scaling variable for the suppression mechanism. For comparisons as a function of other centrality related variables and for comparisons to theoretical predictions see [18].
4 Elliptic flow of charged hadrons and of J/
In non-central heavy-ion collisions collective flow leads to characteristic azimuthal correlations between particle momenta and the reaction plane. This is the plane defined by the beam direction and the impact parameter vector . To quantify the anisotropic flow the coefficients of a Fourier expansion of the azimuthal distributions with respect to the reaction plane are evaluated. The reaction plane is experimentally not directly accessible but it can be determined using the anisotropic flow itself, independently for each harmonic of the anisotropic flow. A detailed overview over several methods is given in [21]. The acceptance coverage of NA60 is mainly close to midrapidity (). Since the directed flow, meaning the first harmonic (), is zero at midrapidity due to symmetry reasons we concentrate on the second harmonic () only. The method we employ is the so-called event plane method [21], relating the azimuthal emission angles of all the charged particles to the azimuthal angle of the event plane (an estimate of the reaction plane) by the so-called event flow vector
| (1) |
which allows to calculate
| (2) |
The NA60 experiment has an acceptance which is highly asymmetric in the azimuthal angle . This strongly affects the distribution of reconstructed event plane angles as demonstrated by the black circles in Fig. 6. For perfectly symmetric acceptances and efficiencies this distributions has to be flat for the average over many events.
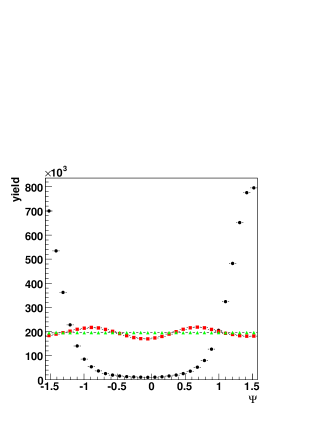
To correct for this asymmetries the event flow vector is recentered in a -acceptance matrix by its mean value for each bin of this matrix as averaged over many events [22]. This changes Eq. 2 to:
| (3) |
The resulting event plane distribution is shown by the red squares in Fig. 6. By definition the recentering can only remove anisotropies in the same harmonic as the one used for the reconstruction of the event plane. To remove remaining anisotropies in higher orders a flattening procedure has been applied [21]. This leads to a flat event plane distribution as shown by the green triangles in Fig. 6.
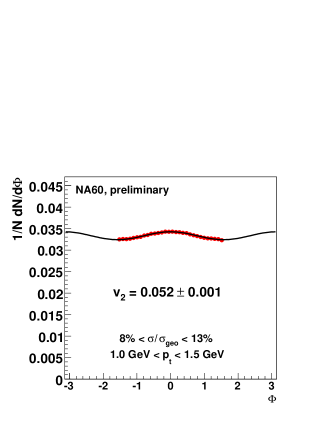
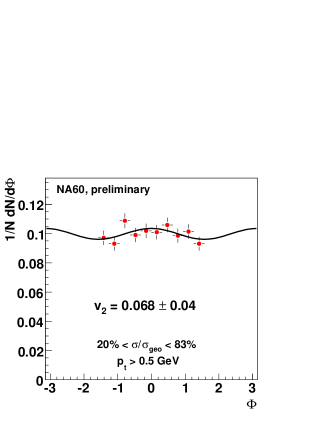
Once the bias in the event plane distribution is removed it is possible to correlate the emission angles of single particles with this event plane and to create azimuthal emission patterns , with being the difference between the emission angle of the particle as measured in the laboratory and the orientation of the event plane . To avoid autocorrelations the event plane has to be recalculated without using the particle track whose emission angle with respect to the event plane is being determined. Figure 8 shows such an azimuthal emission pattern for charged particles. The line denotes the function
| (4) |
which was fitted to the data with . This coefficient has to be corrected for the event plane resolution to obtain the real elliptic flow coefficient . This resolution has been determined by dividing each event in two independend subevents and applying the method described in [23]. Depending on the collision centrality the event plane resolution varies between .
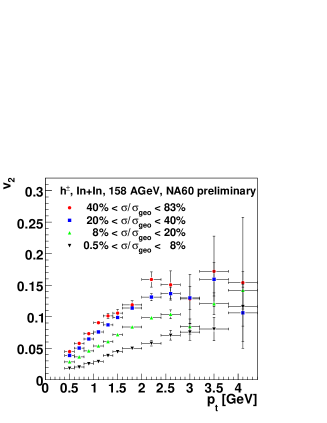
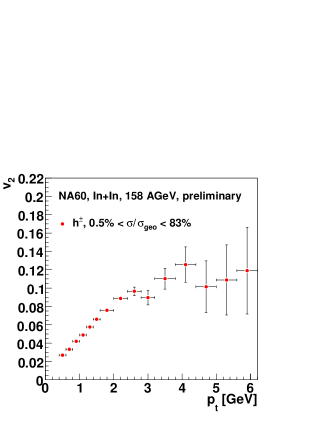
The resulting elliptic flow coefficients for all charged particles are displayed as a function of in Fig. 8. Please note that the present results are not corrected for non-flow correlations due to the HBT effect. Since this mainly affects the results at low (see e.g. [24]), we only present results for GeV/. Up to now all results shown in this section are based on an analysis of approximately 50% of the measured statistics. The flow coefficients rise with and show a saturation at higher momenta as already previously observed in Pb+Pb collisions at the SPS [25] as well as at higher energies at RHIC [26].

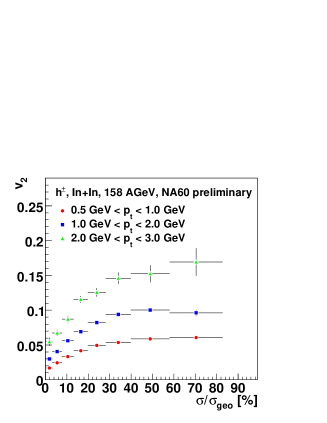
Using the energy deposited in the ZDC the data can be grouped according to the collision centrality. Fig. 10 shows for charged particles as a function of for four centrality bins. The quoted fractions of the total geometrical cross section have been calculated within a Glauber model. The trend as a function of is similar for all collision centralities with the values for increasing for more peripheral collisions. This can be seen in more detail in Fig. 10 showing as a function of the collision centrality for three bins in .
Having determined the orientation of the reaction plane with the charged particle tracks measured in the vertex tracker we can determine as well the azimuthal angle emission pattern of the J/ with respect to this plane. Figure 11 shows the azimuthal angle distributions for J/, on the left hand side for the more central events (0.5% 20%), on the right hand side for the more peripheral events (20% 83%). In total these distributions contain approximately 12000 J/ which is about 50% of the full statistics available for this type of analysis. The more peripheral data seem to indicate a non-isotropic emission pattern but the limited statistics does not allow for a solid conclusion up to now. The analysis of the remaining statistics is under way.
References
References
- [1] L. Anderson et al(NA10 Collaboration), Nucl. Instr. and Meth. 223 (1984) 26.
- [2] G. Usai et al(NA60 Collaboration), Eur. Phys. J. C43 (2005) 415.
- [3] M. Keil et al, Nucl. Instrum. Meth. A539 (2005) 137 and A546 (2005) 448.
- [4] P. Riedler et al, Nucl. Instrum. Meth. A in press, available online.
- [5] R. Shahoyan et al(NA60 Collaboration), Eur. Phys. J. C43 (2005) 209.
- [6] G. Agakichiev et al(CERES Collaboration), Phys. Rev. Lett. 75 (1995) 1272; Eur. Phys. J. C4 231; Eur. Phys. J. C41 (2005) 475.
- [7] S. Damjanovic, A. De Falco and H. Wöhri (NA60 Collaboration), NA60 Internal Note 2005-1.
- [8] H. Sako (CERES Collaboration), GSI Tech. Report 03-24.
- [9] E. Scomparin et al(NA60 Collaboration), Proc. Quark Matter 2005, Nucl. Phys. A in print.
- [10] R. Arnaldi et al(NA60 Collaboration), Phys. Rev. Lett. 96 (2006) 162302.
- [11] G. Chanfray, R. Rapp and J. Wambach, Phys. Rev. Lett. 76 (1996) 368; R. Rapp, G. Chanfray and J. Wambach, Nucl. Phys. A617 (1997) 472.
- [12] R. Rapp and J. Wambach, Adv. Nucl. Phys. 25 (2000) 1.
- [13] G. E. Brown, M. Rho, Phys. Rev. Lett. 66 (1991) 2720 (1991); G. Q. Li, C. M. Ko and G. E. Brown, Phys. Rev. Lett. 75 (1995) 4007.
- [14] G. E. Brown and M. Rho, Phys. Rep. 363, 85 (2002).
- [15] G. Agakichiev et al(CERES Collaboration), Phys. Lett. B422 (1998) 405; B. Lenkeit et al, Nucl. Phys. A661 (1999) 23c.
- [16] G. Q. Li and C. Gale, Phys. Rev. Lett. 81 (1998); Phys. Rev. C 58 (1998) 2914.
- [17] M. C. Abreu et al(NA50 Collaboration), Phys. Lett. B410 (1997) 337; B. Alessandro et al(NA50 Collaboration), Eur. Phys. J. C39 (2005) 335.
- [18] R. Arnaldi et al(NA60 Collaboration), Proc. Quark Matter 2005, Nucl. Phys. A in print.
- [19] G. Borges et al(NA50 Collaboration), Eur. Phys. J. C43 (2005) 161.
- [20] M. Abreu et al(NA50 Collaboration), Phys. Lett. B521 (2001) 195.
- [21] A. M. Poskanzer, S. A. Voloshin, Phys. Rev. C58 (1998) 1671.
- [22] C. Alt et al(NA49 Collaboration), Phys. Rev. C68 (2003) 034903.
- [23] J. Y. Ollitrault, nucl-ex/97110003.
- [24] P. M. Dinh, N. Borghini, J. Y. Ollitrault, Phys. Lett. B477 (2000) 51.
- [25] J. Milošević et al(CERES Collaboration), SQM2006, these proceedings.
- [26] M. Oldenburg et al(STAR Collaboration), Quark Matter 2005, Nucl. Phys. A in print, nucl-ex/0510026; S. Adler et al(PHENIX Collaboration), Phys. Rev. Lett. 91 (2003) 182301.