First measurement of the spectral function in nuclear collisions
Abstract
The NA60 experiment at the CERN SPS has studied low-mass muon pairs in 158 AGeV In-In collisions. A strong excess of pairs is observed above the yield expected from neutral meson decays. The unprecedented sample size close to 400K events and the good mass resolution of about 2% made it possible to isolate the excess by subtraction of the decay sources. The shape of the resulting mass spectrum shows some non-trivial centrality dependence, but is largely consistent with a dominant contribution from annihilation. The associated spectral function exhibits considerable broadening, but essentially no shift in mass. The -differential mass spectra show the excess to be much stronger at low than at high . The results are compared to theoretical model predictions; they tend to rule out models linking hadron masses directly to the chiral condensate.
pacs:
25.75.-qRelativistic heavy-ion collisions and 12.38.MhQuark-gluon plasma and 13.85.QkLepton Pairs1 Introduction
Thermal dilepton production in the mass region 1 GeV/c2 is largely mediated by the light vector mesons , and . Among these, the (770 MeV/c2) is the most important, due to its strong coupling to the channel and its short lifetime of only 1.3 fm/c, much shorter than the lifetime of the fireball. These properties have given it a key role as the test particle for “in-medium modifications” of hadron properties close to the QCD phase boundary. Changes both in width and in mass were originally suggested as precursor signatures of the chiral transition Pisarski:mq . There seems to be some consensus now that the width of the should increase towards the transition region, based on a number of quite different theoretical approaches Pisarski:mq ; Dominguez:1992dw ; Pisarski:1995xu ; Rapp:1995zy ; Rapp:1999ej . On the other hand, no consensus exists on how the mass of the should change in approaching the transition: predictions exist for a decrease Pisarski:mq ; Brown:kk ; Brown:2001nh ; Hatsuda:1991ez , a constant behavior Rapp:1995zy ; Rapp:1999ej , and even an increase Pisarski:1995xu .
Experimentally, low-mass electron pair production was previously investigated at the CERN SPS by the CERES /NA45 experiment for p-Be/Au, S-Au and Pb-Au collisions Agakichiev:mv ; Agakichiev:1995xb ; Agakichiev:1997au . The common feature of all results from nuclear collisions was an excess of the observed dilepton yield above the expected electromagnetic decays of neutral mesons, by a factor of 2-3, for masses above 0.2 GeV/c2. The surplus yield has generally been attributed to direct thermal radiation from the fireball, dominated by pion annihilation with an intermediate which is strongly modified by the medium. Statistical accuracy and mass resolution of the data were, however, not sufficient to reach the sensitivity required to assess in detail the character of the in-medium changes. The new experiment NA60 at the CERN SPS has now achieved a decisive breakthrough in this field.
2 Apparatus and data analysis
The apparatus is based on the muon spectrometer previously used by NA50, and a newly added telescope of radiation-tolerant silicon pixel detectors, embedded inside a 2.5 T dipole magnet in the vertex region Gluca:2005 ; Keil:2005zq . Matching of the muon tracks before and after the hadron absorber, both in angular and momentum space, improves the dimuon mass resolution in the region of the light vector mesons from 80 to 20 MeV/c2 and also decreases the combinatorial background of muons from and K decays. Moreover, the additional bend by the dipole field leads to a strong increase of the detector acceptance for opposite-sign dimuons of low mass and low transverse momentum. The rapidity coverage is 3.3y4.3 for the , at low pT (compared to 3y4 for the J/). Finally, the selective dimuon trigger and the fast readout speed of the pixel telescope allow the experiment to run at very high luminosities.
The results reported here were obtained from the analysis of data taken in 2003 with a 158 AGeV indium beam, incident on a segmented indium target of seven disks with a total of 18% (In-In) interaction length. At an average beam intensity of 5107 ions per 5 s burst, about 31012 ions were delivered to the experiment, and a total of 230 million dimuon triggers were recorded on tape. The data reconstruction starts with the muon-spectrometer tracks. Next, pattern recognition and tracking in the vertex telescope are done; the interaction vertex in the target is reconstructed with a resolution of 200 m for the z-coordinate and 10-20 m in the transverse plane. Only events with one vertex are kept; interaction pileup and reinteractions of secondaries and fragments are thus rejected. Finally, each muon-spectrometer track is extrapolated to the vertex region and matched to the tracks from the vertex telescope.
The combinatorial background of uncorrelated muon pairs mainly originating from and K decays is determined using a mixed-event technique Ruben:2005qm . Two single muons from different like-sign dimuon triggers are combined into muon pairs in such a way as to accurately account for details of the acceptance and trigger conditions. The quality of the mixed-event technique can be judged by comparing the like-sign distributions generated from mixed events with the measured like-sign distributions. It is remarkable that the two agree to within 1% over a dynamic range of 4 orders of magnitude in the steeply falling mass spectrum Ruben:2005qm . After subtraction of the combinatorial background, the remaining opposite-sign pairs still contain “signal” fake matches, i.e. associations of muons to non-muon tracks in the pixel telescope. This contribution is only 7% of the combinatorial background level. It has been determined in the present analysis by an overlay Monte Carlo method. We have verified that an event-mixing technique gives the same results, both in shape and in yield, within better than 5%. More details on the experimental apparatus and data analysis will be given in a forthcoming extended paper; for now see Ruben:2005qm ; Andre:2006 .
3 Results
A significant part of the results presented in this paper has recently been published Arnaldi:2006 . That part will therefore be less extensively treated than other parts published here for the first time.
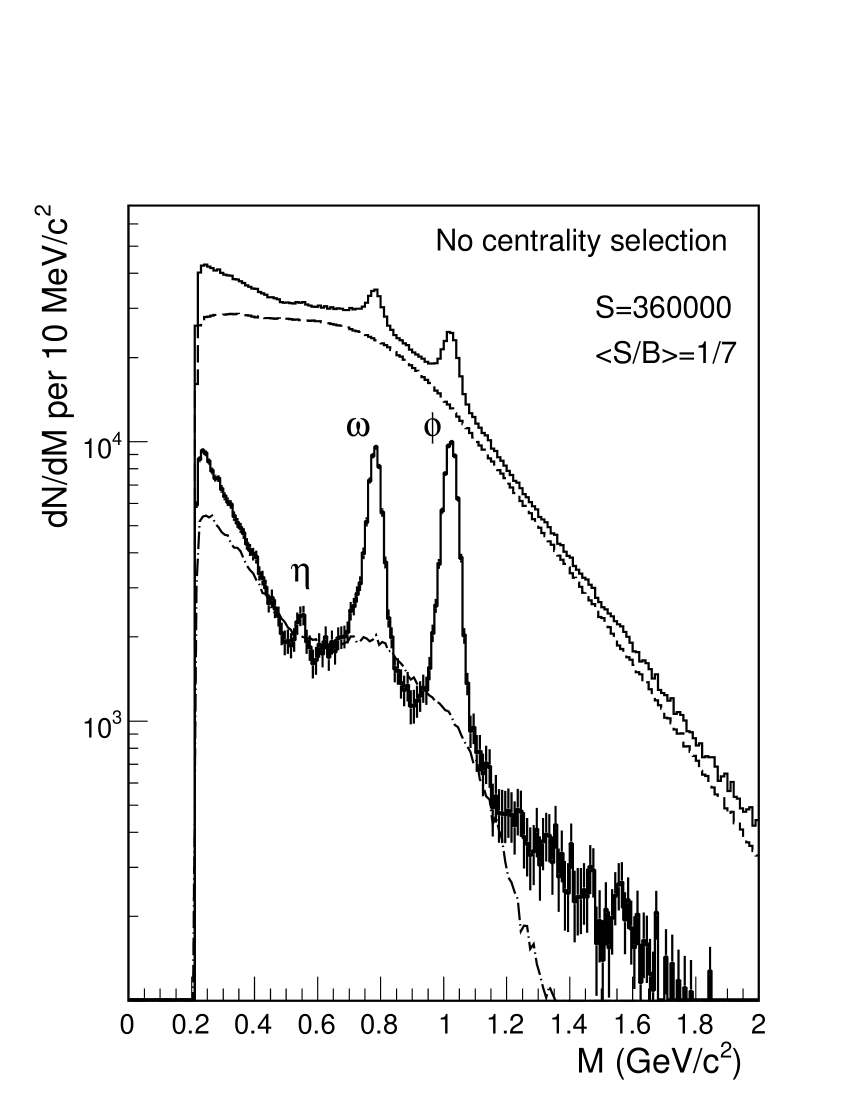
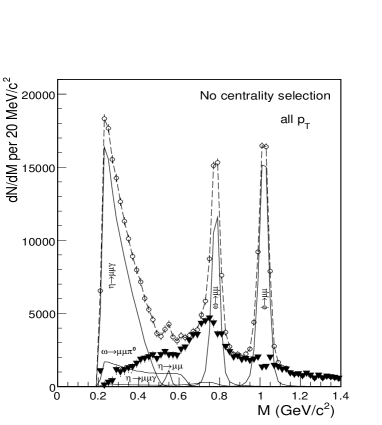
Fig. 1 shows the opposite-sign, background and signal dimuon mass spectra, integrated over all collision centralities. After subtracting the combinatorial background and the signal fake matches, the resulting net spectrum contains about 360 000 muon pairs in the mass range 0-2 GeV/c2 of Fig. 1, roughly 50% of the total available statistics. The average charged-particle multiplicity density measured by the vertex tracker is =120, the average signal-to-background ratio is 1/7. For the first time in nuclear collisions, the vector mesons and are completely resolved in the dilepton channel; even the decay is seen. The mass resolution at the is 20 MeV/c2. The subsequent analysis is done in four classes of collision centrality defined through the charged-particle multiplicity density: peripheral (4-30), semiperipheral (30-110), semicentral (110-170) and central (170-240). The signal-to-background ratios associated with the individual classes are 2, 1/3, 1/8 and 1/11, respectively.
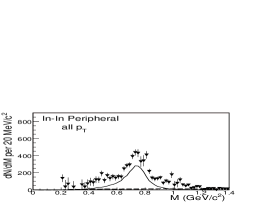
The peripheral data can essentially be described by the expected electromagnetic decays of the neutral mesons. Muon pairs produced from the 2-body decays of the , , and resonances and the Dalitz decays of the , and
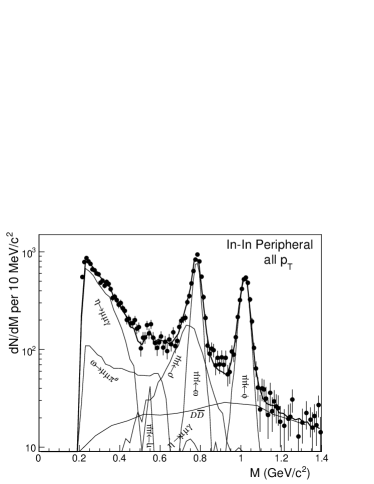
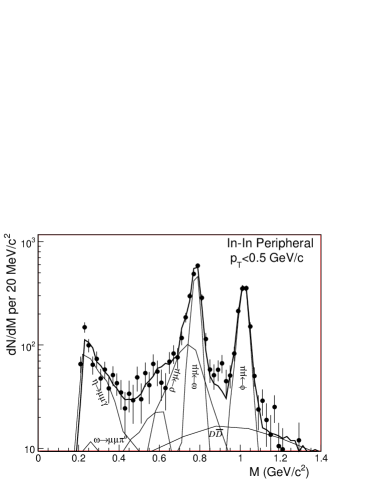
were simulated using the improved hadron decay generator GENESIS genesis:2003 , while GEANT was used for transport through the detectors. Four free parameters (apart from the overall normalization) were used in the fit of this “hadron decay cocktail” to the peripheral data: the cross section ratios , and , and the level of meson pair decays; the ratio was kept fixed at 0.12 Agakichiev:mv ; genesis:2003 . The fits were done without pT selection, but also independently in three windows of dimuon transverse momentum: pT0.5, 0.5pT1 and pT1 GeV/c. Data and fits, including an illustration of the individual sources, are shown in Fig. 2 for all pT (upper) and for the particular selection pT0.5 GeV/c (lower). The fit quality is good throughout, even in the critical acceptance-suppressed -Dalitz region at low mass and low pT.
The quantitative fit results in terms of the cross section ratios, corrected for acceptance and extrapolated to full phase space (meaning here full ranges in y and pT) are displayed in Fig. 3 (upper), where the horizontal lines (with the label ) indicate the fit values without pT selection, and the data points (with statistical errors) the values obtained from the three different pT windows. The systematic errors are of order 10% in all cases, dominated by those of the branching ratios. The ratio agrees, within 10%, with the literature average for p-p, p-Be Agakichiev:mv . The ratio is higher than the p-p, p-Be average, reflecting some enhancement already in peripheral nuclear collisions. Both ratios are, within 10%, independent of the pair pT. This implies that the GENESIS input assumptions (used in the extrapolation to full pT) as well as the acceptance corrections vs. pT are correct on the level of 10%. As shown in Fig. 3 (lower), the acceptance variations with pT are minor for the and the , but very strong,
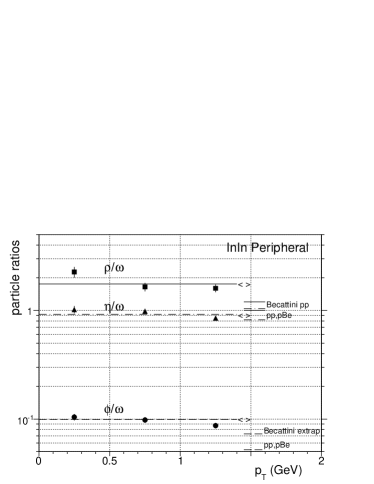
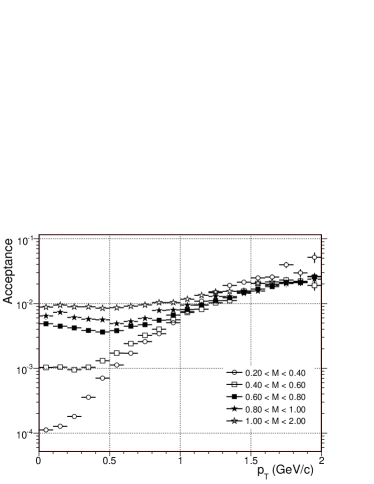
over two orders of magnitude, for the Dalitz mode (M0.4 GeV/c2). The accuracy level of 10% reached in understanding the acceptance is therefore truly remarkable.
The particle ratio behaves in a different way relative to the other two. It decreases with pT, but remains significantly higher than the p-p, p-Be average Agakichiev:mv throughout. This suggests that some annihilation, enhancing the yield of the , contributes already in peripheral collisions (see below).
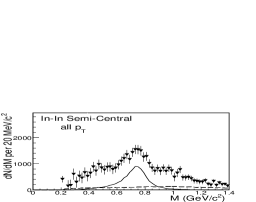
In the more central bins, a fit procedure is ruled out, due to the existence of a strong excess with a priori unknown characteristics. We have therefore used a novel procedure as shown in Fig. 4, made possible by the high data quality. The excess is isolated by subtracting the cocktail, without the , from the data. The cocktail is fixed, separately for the major sources and in each centrality bin, by a “conservative” approach. The yields of the narrow vector mesons and are fixed so as to get, after subtraction, a smooth underlying continuum. For the , an upper limit is defined by “saturating” the measured data in the region close to 0.2 GeV/c2; this implies the excess to vanish at very low mass, by construction. The resonance and Dalitz decays are now bound as well; is fixed as before. The cocktail (shown in Figs. 5, 6, 8 and 9 for illustration purposes) is bound by the ratio =1.2. The accuracy in the determination of the and yields by this subtraction procedure is on the level of very few %, due to the remarkable local sensitivity, and not much worse for the .
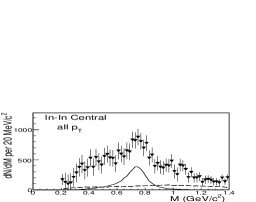
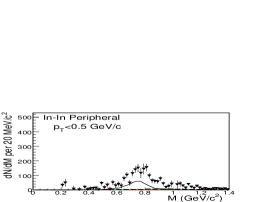
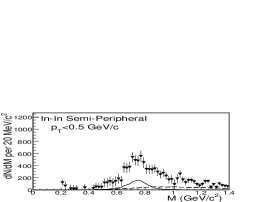
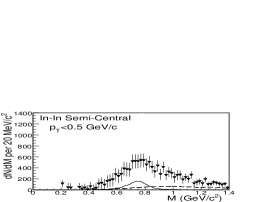
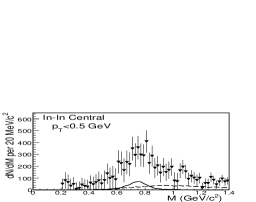
The excess mass spectra for all 4 multiplicity bins, resulting from subtraction of the “conservative” hadron decay cocktail from the measured data, are shown in Figs. 5 and 6 for all pT and the particular selection pT0.5 GeV/c, respectively. The cocktail and the level of charm decays, found in the three upper centrality bins to be about 1/3 of the measured yield in the mass interval 1.2M1.4 GeV/c2 Ruben:2005qm , are shown for comparison. The qualitative features of the spectra are striking: a peaked structure is seen in all cases, broadening strongly with centrality, but remaining essentially centered around the position of the nominal pole. At the same time, the total yield increases relative to the cocktail , their ratio (for M0.9 GeV/c2) reaching values of 4 for all pT, even close to 8 for pT0.5 GeV/c, in the most central bin. Such values are consistent with the CERES Agakichiev:1997au results, if the latter are also referred
to the cocktail and rescaled to In-In. The errors shown are purely statistical. The systematic errors are dominantly connected to the uncertainties in the level of the combinatorial background, less so to the fake matches. For the data without pT selection, they are estimated to be about 3%, 12%, 25% and 25% for the 4 centralities in the broad continuum region, while the -like structure above the continuum is much more robust. Uncertainties associated with the subtraction of the hadron decay cocktail reach locally up to 15%, dominated by those of the -Dalitz form factor. For the data with pT0.5 GeV/c, the systematic errors

are still under investigation.
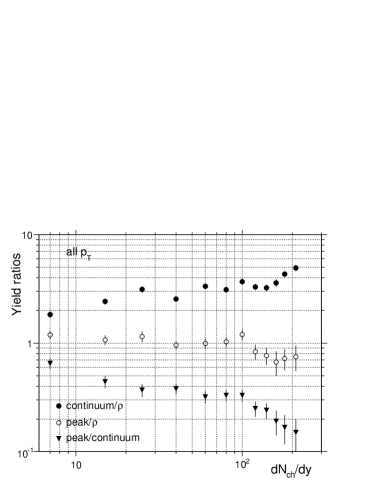
For the data without pT selection, a quantitative analysis of the shape of the excess mass spectra vs. centrality has been performed, using a finer subdivision into 12 centrality bins. Referring to Fig. 5, the data were subdivided into three mass windows with equal widths: 0.44M0.64 (L=Lower), 0.64M0.84 (C=Center), and 0.84M1.04 GeV/c2 (U=Upper). From the yields in these windows, a peak yield R = C - 1/2(L+U) and a continuum yield 3/2(L+U) can be defined. Fig. 7 (upper) shows the ratios of peak/ (R/), continuum/ (3/2(L+U)/), and peak/continuum (RR), where stands for the cocktail . The errors shown are purely statistical. The relative systematic errors between neighboring points are small compared to the statistical errors and can therefore be ignored, while the common systematic errors are related to those discussed in the previous paragraph and are of no relevance here. The ratio peak/ is seen to decrease from the most peripheral to the most central bin by nearly a factor of 2, ruling out the naive view that the shape can simply be explained by the cocktail residing on a broad continuum, independent of centrality. The ratio continuum/ shows a fast initial rise, followed by a more flat and then another more rapid rise beyond dNch/dy = 100; this behavior is statistically significant. The sum of the two ratios is the total enhancement factor relative to the cocktail ; it reaches about 5.5 in the most central bin. The ratio of the two ratios, peak/continuum, amplifies the two separate tendencies: a fast decay, a nearly constant part, and a decline by a further factor of 2 beyond dNch/dy = 100, though with large errors due to R.
A completely independent shape analysis was done by just evaluating the RMS = of the mass spectra in the single total mass interval 0.44M1.04 GeV/c2. The results are shown in Fig. 7 (lower), both for the full data and after subtraction of charm on the level discussed for Figs. 5, 6 (except for the most peripheral bin where the continuum yield above 1 GeV/c2 was assumed to be 100% charm).
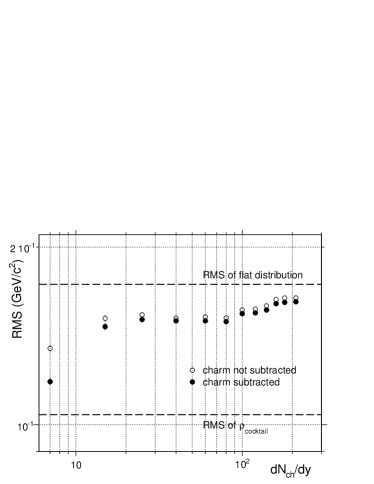
They are in perfect qualitative agreement with the more “microscopic” shape analysis discussed before, rising from values close to the cocktail all the way up to nearly a flat-continuum value. The extra rise beyond dNch/dy = 100 is highly significant here, due to the very small statistical and systematic errors.
4 Comparison to theoretical models
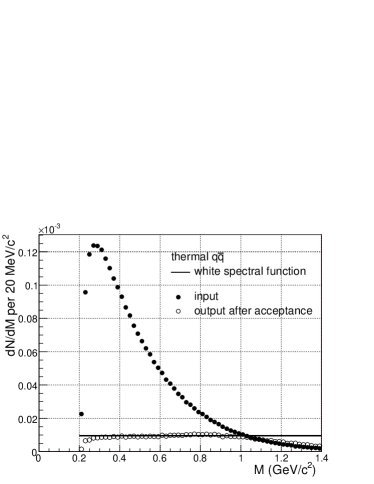
The qualitative features of the excess mass spectra shown in Figs. 5 and 6 are consistent with an interpretation as direct thermal radiation from the fireball, dominated by annihilation. A quantitative comparison of the data to the respective theoretical models can either be done at the input of the experiment, requiring acceptance correction of the data, or at the output, requiring propagation of the theoretical results through the experimental acceptance. All the data contained in this paper have so far not been corrected for acceptance, and therefore only the second alternative is available at present (the first one being under preparation). To help intuition, Fig. 8 illustrates the effects of acceptance propagation for the particularly transparent case of annihilation, associated with a uniform spectral function rapp:nn23 . By coincidence, without pT selection, the resulting mass spectrum at the output is also uniform within 10% up to about 1.0 GeV/c2, resembling the shape of the spectral function at the input. In other words, the always existing steep rise of the theoretical input at low masses (Fig. 8), due to the photon propagator and a Boltzmann-like factor Rapp:1995zy ; Rapp:1999ej ; Brown:kk ; Brown:2001nh , is just about compensated by the falling acceptance in this region as long as no pT cut is applied. Variations of the input pT spectrum within reasonable physics limits affect the flatness of the output by at most 20%. Strong cuts in pT like 0.5 or 1 GeV/c, however, completely invalidate the argument.
On the basis of this discussion, the excess mass spectra shown in Fig. 5 can approximately be interpreted as spectral functions of the , averaged over momenta and the complete space-time evolution of the fireball. The broad continuum-like part of the spectra may then reflect the early history close to the QCD boundary with a nearly divergent width, while the narrow peak on top may just be due to the late part close to thermal freeze-out, approaching the nominal width. The pT-cut data shown in Fig. 6, on the other hand, do not allow such interpretation, due to the extreme acceptance cut on the low-mass side of the ; compare also Fig. 3 (lower).
Among the many different theoretical predictions for the properties of the intermediate mentioned in the introduction, only few have been brought to a level suitable for a quantitative comparison to the data. Before the first release of the present data in 2005, the in-medium broadening scenario of Rapp:1995zy ; Rapp:1999ej and the moving mass scenario related to Brown:kk ; Brown:2001nh were
evaluated for In-In at dNch/d=140,
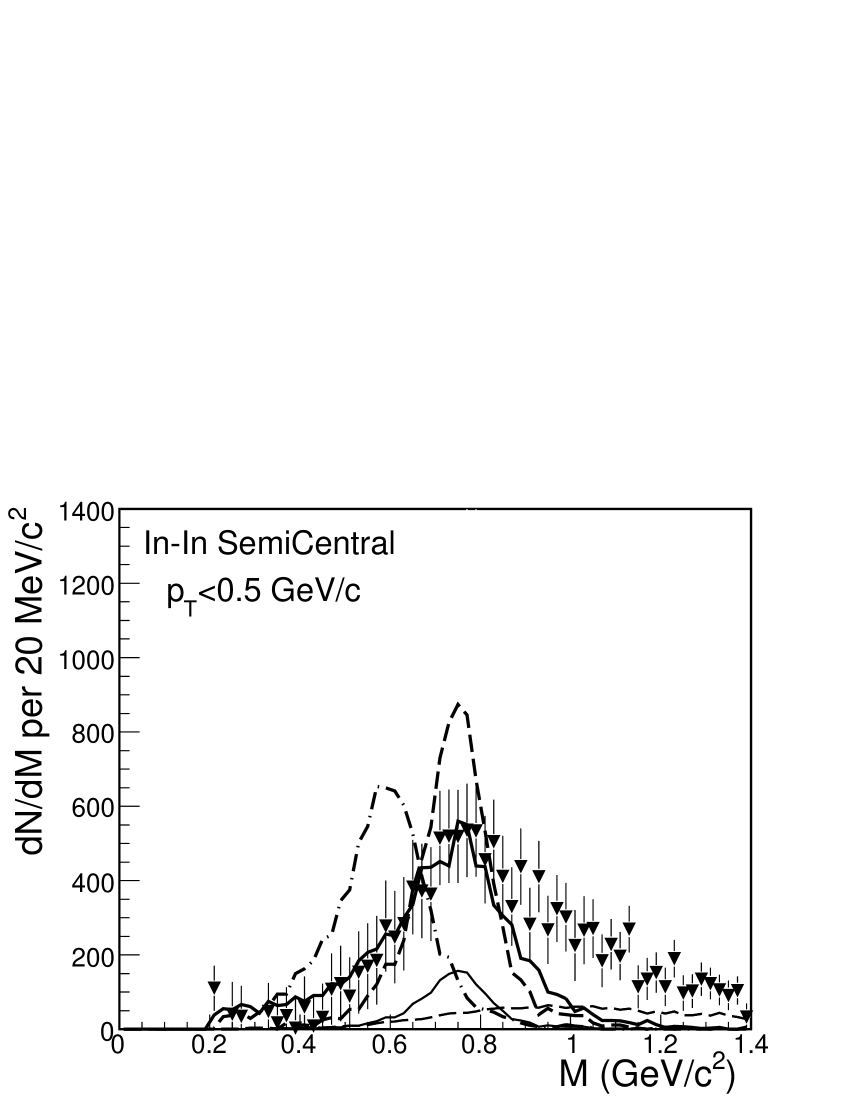
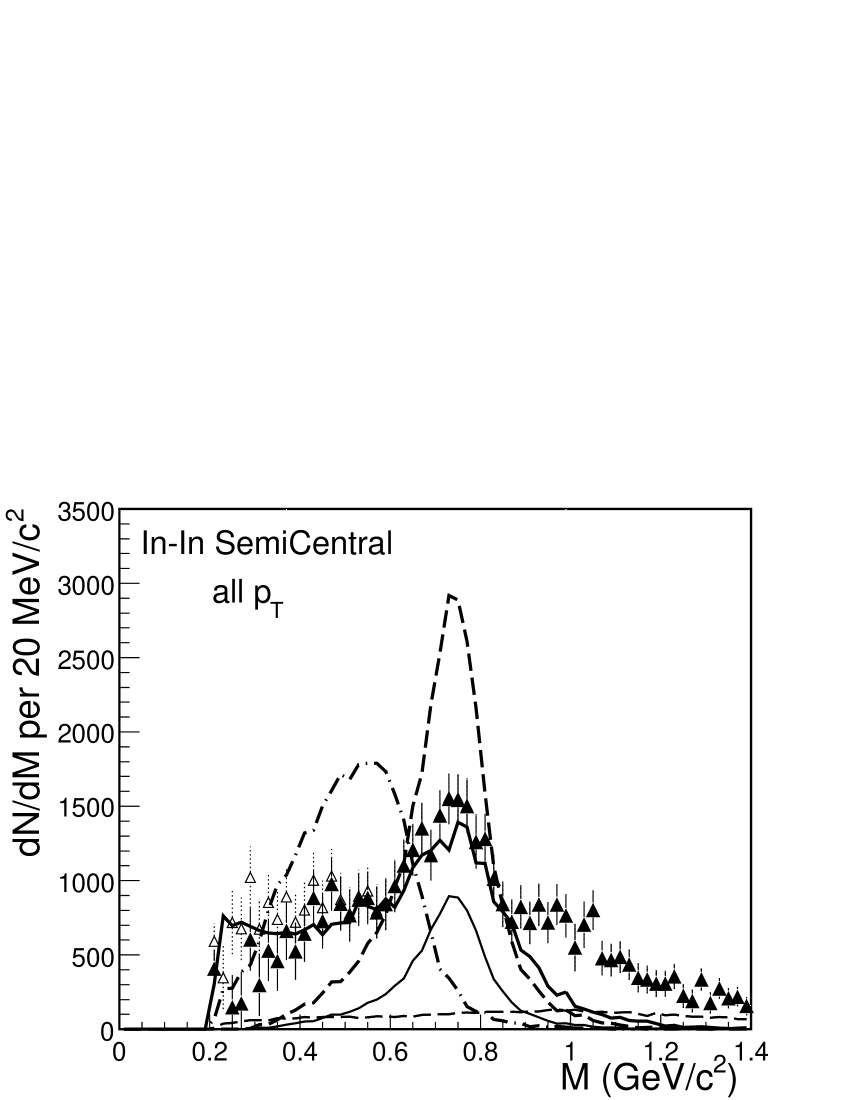
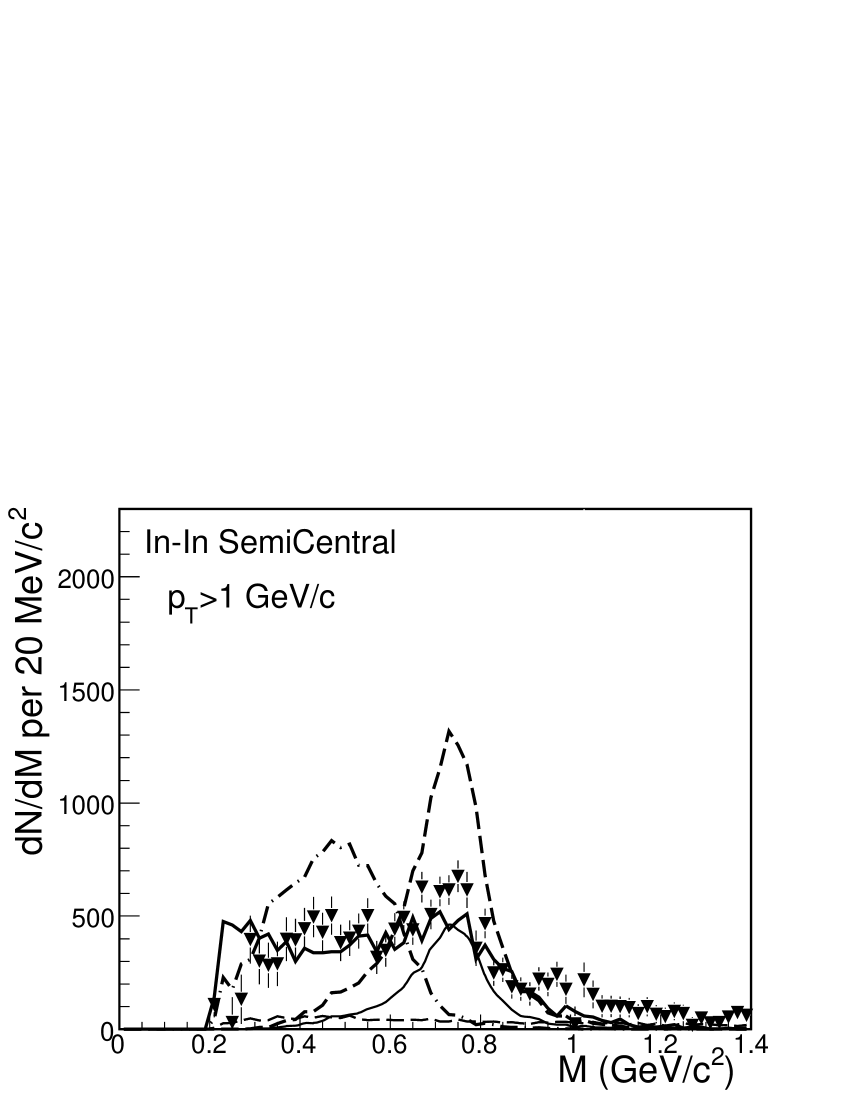
using exactly the same fireball evolution model extrapolated from Pb-Pb, and taking explicit account of temperature as well as of baryon density rapp:nn23 . In Fig. 9, these predictions (as well as the unmodified ) are confronted with the data for the semicentral bin. The integrals of the theoretical spectra are independently normalized to the data in the mass interval M0.9 GeV/c2 in order to concentrate on the spectral shapes, independent of the uncertainties of the fireball evolution. Note again that data and predictions can only be interpreted as space-time averaged spectral functions for the part without pT selection (Fig. 9, center), but not for the other two. Irrespective of the choice of the pT window, however, some general conclusions can be drawn. The unmodified is clearly ruled out. The moving mass scenario related to Brown/Rho scaling, which fit the CERES data Rapp:1999ej ; Agakichiev:1997au , is also ruled out, showing the much improved discrimination power of the present data. Only the broadening scenario appears to be in fair agreement with the data.
In the meantime, the release of the data in 2005 has triggered a number of new theoretical developments. Contrary to initial critics brownrho:nn , Brown/Rho scaling could not be saved by varying fireball and other parameters within extremes, including switching out the effects of temperature altogether rapphees:nn ; skokov:nn . The excess of the data at M0.9 GeV/c2 may be related to the prompt dimuon excess found by NA60 in the intermediate mass region Ruben:2005qm . It is not accounted for by the model results shown in Fig. 9, and it is presently (nearly quantitatively) described either by hadronic processes like 4, 6.. (including vector-axial-vector mixing) hees:nn , or by partonic processes like annihilation rr:nn . This is a challenging theoretical ambiguity to be solved in the future. A chiral virial approach has also been able to nearly quantitatively describe the data zahed:nn .
5 Conclusions
The data unambiguously show that the primarily broadens in In-In collisions, but does not show any shift in mass. Consequently, model comparisons favor broadening scenarios, but tend to rule out moving-mass scenarios coupled directly to the chiral condensate. The issue of vector-axialvector mixing, also sensitive to chiral restoration, remains somewhat open at present. We expect that precise pT dependences, presently under investigation, will give more insight into the different sources operating in different mass regions.
References
- (1) R. D. Pisarski, Phys. Lett. 110B, 155 (1982)
- (2) C. A. Dominguez, M. Loewe and J. C. Rojas, Z. Phys. C59, 63 (1993)
- (3) R. D. Pisarski, Phys. Rev. D 52, R3773 (1995)
- (4) G. Chanfray, R. Rapp and J. Wambach, Phys. Rev. Lett. 76, 368 (1996); R. Rapp, G. Chanfray and J. Wambach, Nucl. Phys. A617, 472 (1997)
- (5) R. Rapp and J. Wambach, Adv. Nucl. Phys. 25, 1 (2000)
- (6) G. E. Brown, M. Rho, Phys. Rev. Lett. 66, 2720 (1991); G. Q. Li, C. M. Ko and G. E. Brown, Phys. Rev. Lett. 75, 4007 (1995)
- (7) G. E. Brown and M. Rho, Phys. Rept. 363, 85 (2002)
- (8) T. Hatsuda and S. H. Lee, Phys. Rev. C 46, 34 (1992)
- (9) G. Agakichiev et al. (CERES Collaboration), Eur. Phys. J. C4, 231 (1998)
- (10) G. Agakichiev et al. (CERES Collaboration), Phys. Rev. Lett. 75, 1272 (1995)
- (11) G. Agakichiev et al. (CERES Collaboration), Phys. Lett. B422, 405 (1998); B. Lenkeit et al., Nucl. Phys. A661, 23c (1999); G. Agakichiev et al., Eur. Phys. J. C41, 475 (2005)
- (12) G. Usai et al. (NA60 Collaboration), Eur. Phys. J. C43, 415 (2005)
- (13) M. Keil et al., Nucl. Instrum. Meth. A539, 137 (2005) and A546, 448 (2005)
- (14) R. Shahoyan et al. (NA60 Collaboration), Eur. Phys. J. C43 (2005) 209; Quark Matter, Budapest, 2005
- (15) A. David, PhD Thesis, Instituto Superior Técnico, Lisbon, 2006; CERN-THESIS-2006-007
- (16) R. Arnaldi et al. (NA60 Collaboration), Phys. Rev. Lett. 96 (2006) 162302
- (17) S. Damjanovic, A. De Falco and H. Wöhri (NA60 Collaboration), NA60 Internal Note 2005-1
- (18) R. Rapp, private communication (2003)
- (19) G. E. Brown and M. Rho, arXiv:nucl-th/0509001 and nucl-th/0509002
- (20) H. van Hees and R. Rapp, arXiv:hep-ph/0604269
- (21) V. V. Skokov and V. D. Toneev, Phys. Rev. C 73 (2006) 021902
- (22) H. van Hees and R. Rapp, arXiv:hep-ph/0603084
- (23) T. Renk and J. Ruppert, arXiv:hep-ph/0605130.
- (24) K. Dusling, D. Teaney and I. Zahed, arXiv:nucl-th/0604071