High- Production with Respect to the Reaction Plane Using the PHENIX Detector at RHIC
Abstract
The origin of the azimuthal anisotropy in particle yields at high ( GeV/c) in RHIC collisions remains an intriguing puzzle. Traditional flow and parton energy loss models have failed to completely explain the large observed at high . Measurement of this parameter at high will help to gain an understanding of the interplay between flow, recombination and energy loss, and the role they play in the transition from soft to hard physics. Neutral mesons measured in the PHENIX experiment provide an ideal observable for such studies. We present recent measurements of yields with respect to the reaction plane, and discuss the impact current models have on our understanding of these mechanisms.
pacs:
25.75.-q, 25.75.Dw1 Introduction
Two of the greatest mysteries that have arisen from the RHIC physics program are the source of the apparent flatness of the high ( GeV/c) suppression of ref:tadaaki_pizRaa and the source of non-zero at high ref:highptv2 . The existence of intermediate to high was suggested early in the RHIC program ref:gvw , and has been the subject of many theoretical treatments (see ref:shuryak ; ref:dfj for some additional examples). Traditional flow and parton energy loss pictures have failed to describe the magnitude of this anisotropy. Measurement of the azimuthal asymmetry at high will shed light on the contributions from flow, recombination, and energy loss, as well as the transition from soft to hard production mechanisms.
2 Measuring and yields in PHENIX
The orientation of the reaction plane is measured event-by-event using the set of two PHENIX Beam-Beam Counters (BBCs), which reside at the region . Each detector is an array of 64 hexagonal, close-packed quartz Cherenkov counters, located 150 cm from the interaction point. The charge measured by each counter is proportional (on average) to the multiplicity of particles hitting it. The reaction plane angle is determined from the value of . Because the two BBCs provide independent measurements of , we can estimate the resolution of the combined measurement via standard techniques ref:resolution .
For measuring photons and s, we use the Electomagnetic Calorimeter (EMCal) ref:emcal . Candidate clusters are required to pass identification cuts, and distributions are formed from pairs of these clusters. The resulting yields are binned in angle with respect to the reaction plane (). A similarly binned mixed event background is then subtracted. The counts in the remaining peak centered on the mass are integrated in a window (where is the width of a Gaussian fit to the peak). Six bins in are used in the interval .
To measure , we fit the raw (uncorrected) distribution as
| (1) |
The resulting parameter needs to be corrected for the reaction plane measurement resolution, hence the designation . The resolution is determined for each centrality bin, and leads to the corrected value . The yields as a function of can then be corrected with a factor
| (2) |
3 Results and Discussion
To obtain , we exploit the fact that the ratio of the yield at a given to the inclusive yield is equivalent to the ratio of the angle-dependent to the inclusive . Thus multiplying these relative yields by an inclusive measured , we have:
| (3) |
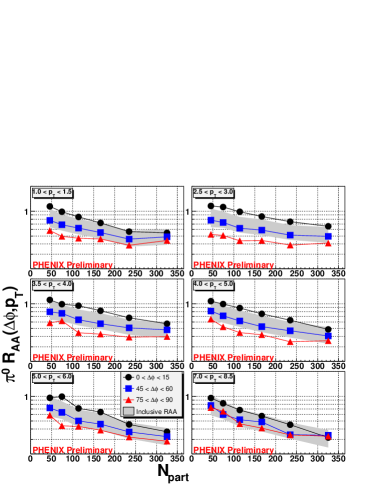
The as a function of is shown in Figure 1. We note that there appears to be a slightly different centrality dependence, according which bin in which the is being measured. This feature is emphasized by plotting the data on a semi-log scale, showing that the behaves differently in different bins.
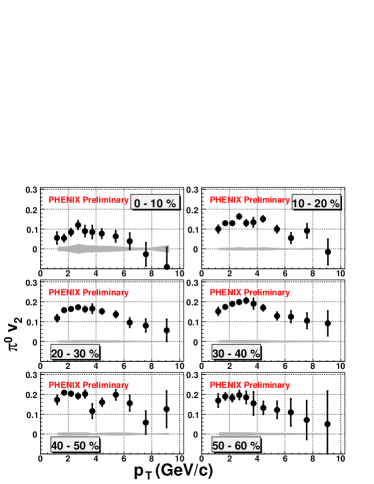
The resulting is shown in Figure 2. For the first time we observe up to 10 GeV/c. While the value of the decreases beyond intermediate , it nonetheless shows a substantial and perhaps constant value out to the highest measured transverse momenta.
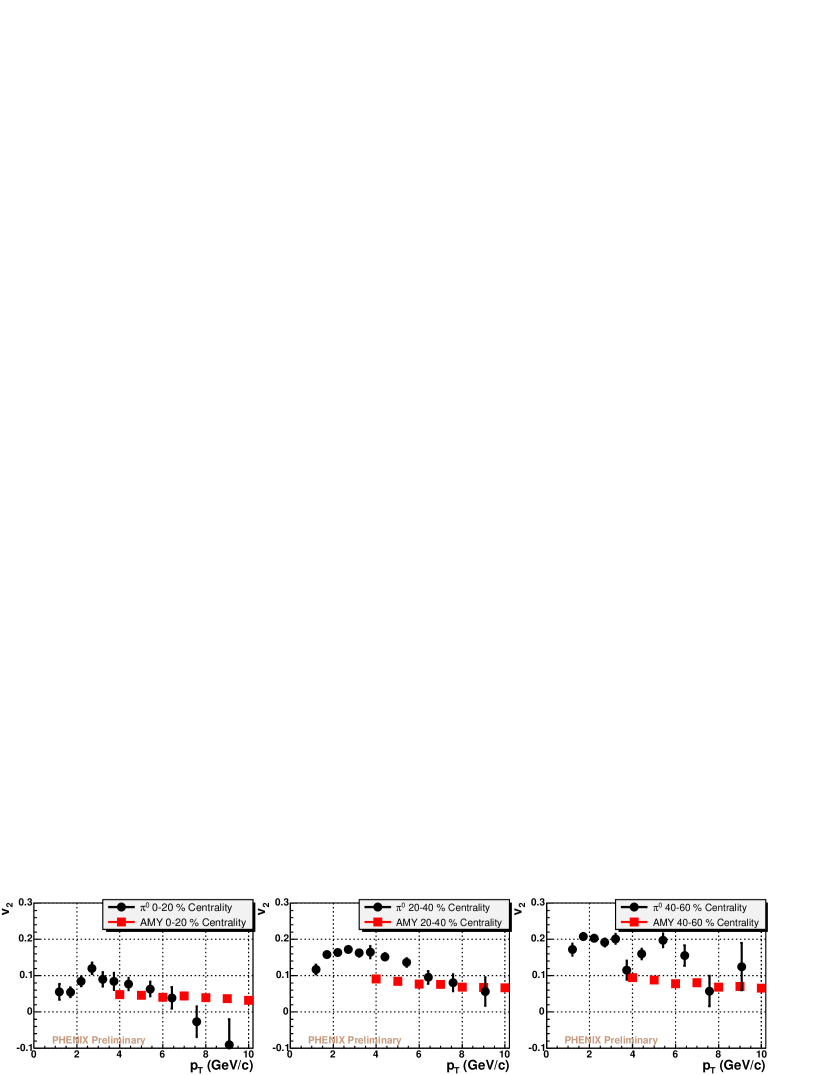
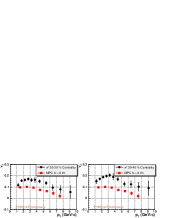
To gain insight into the mechanisms at work at high , we turn to models. We compare the to two models, a calculation done by Turbide et al. ref:turbide (using an Arnold-Moore-Yaffe (AMY) formalism ref:amy ) and the Molnar Parton Cascade (MPC) model ref:mpc . Figure 3 shows calculations from these models, plotted alongside data for similar centralities. The AMY calculation contains energy loss mechanisms only, and we see that the data appear to decrease to a value at high that is consistent with this model; the level of agreement is most striking in the 20-40% bin.
The MPC model has a number of mechanisms, including corona effects, energy loss, and the ability to boost lower partons to higher (a unique feature). The calculation shown in Figure 3 does a better job of reproducing the overall shape of the , though it is systematically low. It is important to note that this calculation is done for one set of parameters, so it should be very interesting to see if the MPC can better reproduce the data for a different set of parameters (the opacity of the medium, for example).
The prevailing thought is that the high behavior of the is due to energy loss mechanisms. If this is true, the should be sensitive to the geometry of the collision. To test this behavior, we seek to combine the two traditional geometric parameters (centrality, or collision overlap, and angle of emission) into a single parameter, a quantity which we will refer to as “”. Details of the calculation are described in ref:leff , as well as below.
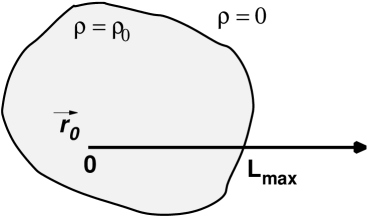
The Guylassy-Levai-Vitev (GLV) formalism can be used to calculate jet energy loss for a set of scattering centers , where . In practice, an average over these centers is performed. As shown in Figure 4, if a static uniform color charge density within some region ( and zero outside the region) is assumed, the resulting energy loss is . More realistically, if the density seen by the particle changes along the path, we have (which reduces to the quadradic dependence for a constant density). Application of this to a 1D Bjorken expansion, with
| (4) |
and given a jet trajectory (assuming for the jet), we have
| (5) |
Therefore we have
| (7) | |||||
This effective energy loss is calculated from the parton-density weighted average of the length from hard-scattering origin to edge of an ellipse. Additionally, we perform a Glauber Monte Carlo sampling of starting points to account for fluctuations in the location of the hard-scattering origin of the particles’ paths within the region of overlap between the colliding nuclei. The crucial feature of is that it is proportional to the energy loss sustained by the parton as it traverses the medium.
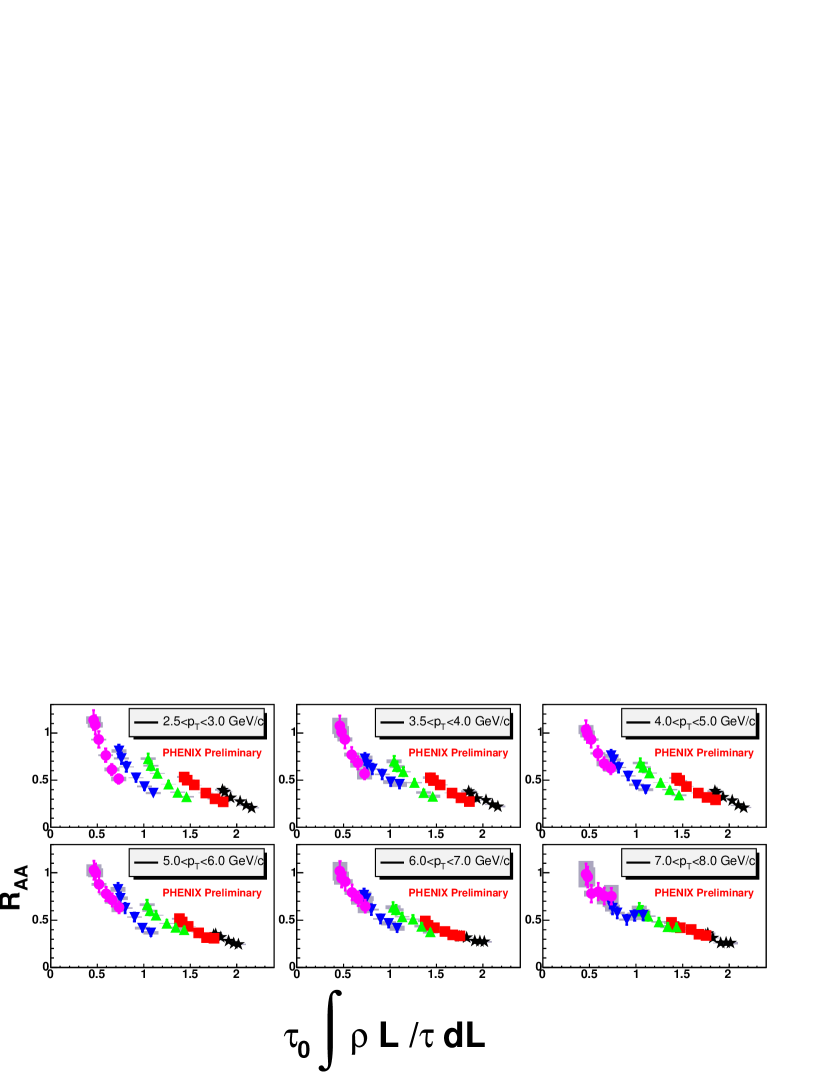
The resulting dependence of for all centralities and angles on is shown in Figure 5. If the observed arose from only geometric effects, we would expect the data to exhibit a universal dependence on . For low , this is clearly not the case; something more than just energy loss is taking place there. However, when the reaches 7 GeV/c and above, the data do indeed appear to have a dependence on a single curve. This apparent scaling strongly suggests that the dominant effect on at high- is energy loss. These data can help to constrain energy loss models, and perhaps help to understand the nature of that energy loss (is it radiative, collisional, or some combination of both?).
4 Conclusions
We have presented the first measurement of high for s. It is now clear that the at high does decrease but to a non-zero value. Comparison of with models suggest that the dominant mechanism at work at high is energy loss. In addition, we have presented the first measurement of as a function of angle with respect to the reaction plane. When the data are examined as a function of an effective path length through the medium, the scaling that arises at high also argues for energy loss as the dominant mechanism at work.
References
- (1) T. Isobe, nucl-ex/0510085
- (2) S. Adler et al., Phys. Rev. Lett. 96, 032302 (2006)
- (3) M. Guylassy et al., Phys. Rev. Lett. 86, 2537 (2001)
- (4) E. Shuryak, Phys. Rev. C66 027902 (2002)
- (5) A. Drees et al., Phys. Rev. C71 034909 (2005)
- (6) A. M. Poskanzer, S. A. Voloshin, Phys. Rev. C58, 1671 (1998)
- (7) L. Aphecetche et al., Nucl. Instr. Meth. A499 521 (2003)
- (8) S. Turbide et al., Phys. Rev. C72 014906 (2005)
- (9) P. Arnold et al., J. High Energy Phys. 05, 051 (2003)
- (10) D. Molnar, nucl-th/0503051
- (11) B. Cole, Eur.Phys.J. C43, 271 (2005)