The COSY-MOMO Collaboration
Study of the and reactions close to threshold
Abstract
Two–kaon production in proton–deuteron collisions has been studied at three energies close to threshold using a calibrated magnetic spectrograph to measure the final 3He and a vertex detector to measure the pair. Differential and total cross sections are presented for the production of –mesons, decaying through , as well as for prompt production. The prompt production seems to follow phase space in both its differential distributions and in its energy dependence. The amplitude for the He reaction varies little for excess energies below 22 MeV and the value is consistent with that obtained from a threshold measurement. The angular distribution of the decay pair shows that near threshold the –mesons are dominantly produced with polarization along the initial proton direction. No conclusive evidence for production is found in the data.
pacs:
13.60.Le, 14.40.Aq, 14.40.CsI Introduction
The study of meson production in proton–nucleus collisions near threshold is of interest because of the intricate reaction mechanism that allows the momentum transfer to be shared among several nucleons and this feature becomes yet more critical as the mass of the meson is increased. The simplest reaction of this type is , which has the great experimental advantage that the 3He can be detected in a spectrometer and the meson identified from the missing mass in the reaction. The cross sections for the near–threshold production of Nikulin , eta , Wurzinger95 , and and Wurzinger96 have been extracted in this way. One drawback of this approach is, however, that in certain cases the backgrounds from multipion production can be quite large and rapidly varying. A more intrinsic problem in the case of the production of the spin–one and mesons is that an inclusive measurement will contain no information on their polarization. Both these difficulties can be overcome if products of the decay of the meson are detected in coincidence with the recoiling 3He. The obvious solution in the case reported here is to measure the channel which, according to the Particle Data Group (PDG), has a 49.1% branching ratio PDG06 . The experiment represents an extension of our previous work, where we studied two–pion production in the reaction for excess energies up to 70 MeV Bellemann99 .
The basic apparatus and how it is used to identify the candidates are described in Sec. II, with the method of analyzing these events obtained at three different excess energies being reported in Sec. III. The separation of events from those of prompt production is based principally on the distribution in the invariant mass. However, it is important to demonstrate that this division is consistent with the distributions in the other kinematical variables and this is achieved in Sec. IV. The angular distributions show evidence for pure –wave production of both prompt and pairs, with the latter being completely dominated by those where the has polarization along the beam direction. Only upper limits could be placed upon the production in this reaction of the scalar meson decaying into . The total cross sections for both kaon production reactions are given in Sec. V, where it is seen that the energy dependence of prompt and production seem to follow respectively three–body and two–body phase space. Furthermore, the amplitude for the reaction is consistent with that obtained at SATURNE using the missing–mass method Wurzinger96 . Our conclusions are summarized in Sec. VI.
II Experiment
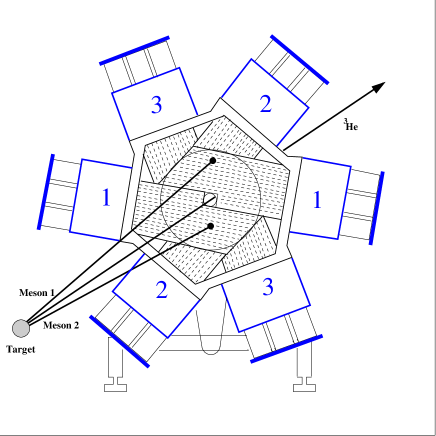
The experiment was carried out at the MOMO (Monitor of Mesonic Observables) facility, which is installed at an external beam position of the COSY accelerator of the Forschungszentrum Jülich. Near threshold, the 3He produced in the reaction go into a narrow forward cone, where they can be analyzed with the high resolution 3Q2DQ spectrograph Big Karl Drochner98 . Two sets of multiwire drift chambers (MWDC), placed in the focal plane, were used to measure the tracks of charged particles. Of these particles, the 3He could be identified unambiguously using two scintillation hodoscopes, placed downstream of the MWDC and separated by 4 m, which provided energy–loss and time–of–flight information. The effectiveness of this approach is illustrated in Fig. 1, where it is seen that different particle types show up as well–separated groups.

Two charged kaons were measured in coincidence with the 3He ions using the MOMO vertex detector. This combination had been proved to work successfully for two–pion production in Ref. Bellemann99 . The vertex detector, a schematic view of which is shown in Fig. 2, consists of three layers of 2.5 mm thick scintillating fibers with 224 parallel fibers in each layer. These are rotated by 60∘ to each other with read–outs through phototubes on opposite sides. The detector is placed outside the vacuum chamber containing the target, some 20 cm downstream of the target. Hits in three layers are required in order to avoid the combinatorial ambiguities associated with two hits.
In contrast to the near–threshold two–pion production experiment Bellemann99 , the multipion background is very large for effective masses in the GeV/c2 region. In view of this, and in order to identify the produced particles unambiguously as kaons, the detector was supplemented by a hodoscope consisting of 16 wedge–shaped scintillators, each 2 cm thick, the details being given in Ref. theses . This modified vertex detector was calibrated with events from elastic scattering. Charged kaons could thus be detected and their production vertex measured with full azimuthal acceptance within a polar angular range of . This modified vertex detector was calibrated with events from elastic scattering. It is important to note that, since there is no magnetic field associated with the MOMO detector, it is not possible to identify the charge of an individual kaon and this automatically symmetrizes some of the distributions.
The liquid deuterium target was a cylinder of diameter 6 mm and 4 mm thickness with m mylar windows Jaeckle94 . The small beam diameter of less than 2 mm led to a precise determination of the emission directions, i.e. polar and azimuthal angles. The incident beam intensity was monitored by calibrated scintillators which, on the basis of the known target areal density, allowed the absolute cross sections to be evaluated Drochner98 .
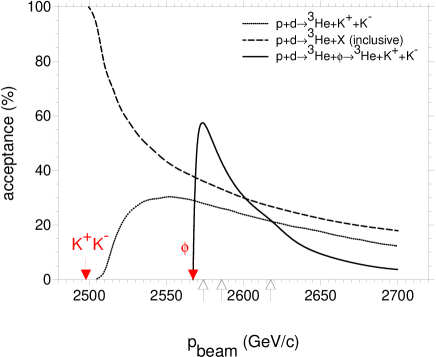
Monte Carlo estimates of the overall efficiency of the apparatus to detect the 3He and 3He final states are shown in Fig. 3 as functions of the beam momentum. Big Karl has a momentum bite of of the central momentum. For this momentum it has a horizontal and vertical acceptance of mrad and mrad about the beam direction and smaller acceptance for the other momenta. Therefore a little above threshold all the 3He from inclusive 3He production should be covered. However, the total system is blind under such conditions since the emitted kaons fall within the central hole of the MOMO detector and are lost. On the other hand, near its threshold, the acceptance for the is high, because the transverse momentum of the 3He is low while the kaon opening angle is comparatively large.
The experiment was carried out at three overall excess energies , 40.6, and 55.2 MeV, i.e excess energies in the 3He system of , 8.5, and 23.1 MeV. The corresponding beam momenta are marked on Fig. 3, from where it can be seen that the efficiency for detection was always greater than 20. Also marked there are the and thresholds, though the latter is made fuzzy by the meson’s MeV/c2 width PDG06 . It should be stressed that kaons with momenta below 160 MeV/c are stopped within the end wall of the MOMO scattering chamber so that the probability of two kaons reaching the detector is always larger than .
The limited momentum bite of the spectrograph meant that between three and five settings of its central value were required for each beam momentum in order to cover the full phase space of the reaction. The integrated luminosity was typically cm-2 per setting. Runs were performed with an empty target cell in order to study the background. The events recorded under these conditions were analyzed in the same way as those from the target–full runs. The fraction of background events was only 0.2% and these were subtracted from the data sample.
III Data Analysis
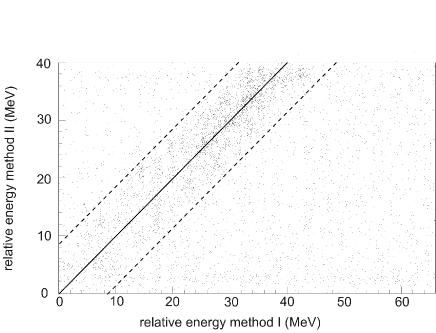
Having identified 3He candidates on the basis of the spectrograph and MOMO information, much of the background could be eliminated by demanding that the events be coplanar in the cm system. The measurement of the 3He momentum together with the kaon directions means that one has a two–constraint fit to the reaction and this reduces the uncertainties in both the identification of the reaction and of its kinematics. As an example of this, we show in Fig. 4 the excitation energy, obtained from the missing–mass in Big Karl, plotted against that deduced from the invariant mass extracted using the reconstructed kaon momenta. Good events lie along the diagonal and we retain those within MeV/c2 of the value expected from the spectrograph measurement.
The corrections necessary for the extraction of the differential cross sections depend upon the particular angle and energy bin as well as on the spectrograph setting. The efficiency for resonant two–kaon production via the is therefore different from that of the prompt production integrated over the excitation energy.
The luminosity measurement needed to derive absolute cross sections has systematic uncertainties of 5 from the target thickness and 5 from the beam intensity. Another systematic uncertainty stems from the efficiency correction, which ranges from 5% up to 20% for small values of the excitation energy in the system. With a beam intensity of s-1, the dead time was negligible. The numbers of identified events were transformed to cross sections, taking the detector efficiencies into account.
IV Differential Distributions
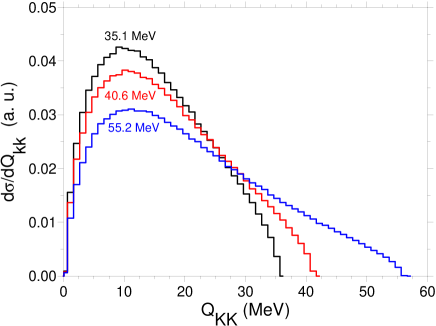
In Figs. 5 and 6 we show the projections of the Dalitz-like plot for the reaction at the three excess energies onto axes corresponding to the excitation energies and in the and He systems respectively. Since the value of is fixed completely by the measurement with the high resolution spectrograph Big Karl, the distribution in this variable is the best determined of all the differential cross sections. All the other distributions rely primarily on the information furnished by the vertex detector, though the spectrograph data refines these through the kinematic fitting.


There is evidence for the production of the meson at all three energies but the physics background arising from a prompt production looking like phase space is very large. This behavior of the prompt pairs is very different from that found for the reaction, studied with the same apparatus Bellemann99 , where effects from double –wave production are very evident.
Fits to the excitation energy spectra have been undertaken in terms of phase space and phase space modulated by a peak, which has been taken to have a Breit–Wigner form with a natural width MeV/c2 PDG06 . This has been folded with an energy resolution width , which reflects uncertainties in the overall system, including the beam momentum spread, as well as effects arising from the binning of the data. The predictions of these fits are shown in Fig. 5, with their reflections on the He spectra being presented in Fig. 6. The broad agreement achieved here supports the basic ansatz that the only distortion of phase space is that due to the peak. In addition to kinematic effects, the broader peak at 55.2 MeV is due in part to the less favorable beam conditions.


Within the present statistics, the differential cross sections for both the prompt and emission are independent of the 3He cm angle, as expected for –wave production. Fig. 7 shows the variation of the cross section as a function of the opening angle between the two kaons. The phase–space distribution is expected to be about times bigger in the backward direction than in the forward. This is a purely kinematic effect, as is the peak arising from production. The decay kaons are emitted back to back in the rest system, which coincides with the overall cm system at the threshold. At the lowest energy there is therefore an enhancement close to but, for higher excess energy, this is shifted towards smaller opening angles due to the random orientation of the decay products with respect to the momentum.
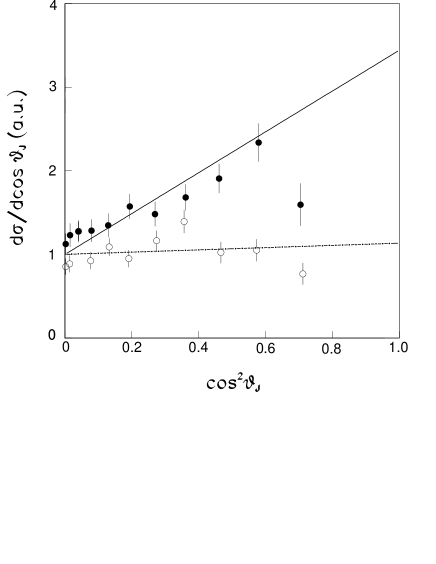
Figure 8 shows the distribution in the angle between one of the kaons and the beam axis in the overall cm system. Pure phase–space would lead to isotropy but even the –wave production of the meson can lead to some dependence on if the –meson is produced polarized. This can be seen more transparently in the Gottfried–Jackson frame GJ , described below. This polarization effect also decreases as the beam energy is raised, because of the random orientation of the produced meson in the cm frame.
In the Gottfried-Jackson frame GJ ; Byck73 , the total momentum of the system is zero, which means that it is the rest frame. Since the is a vector meson, the distribution in the relative momentum of the kaons from its decay is sensitive to its polarization with respect to some quantization axis:
| (1) |
Here the spin-density matrix elements and correspond to the populations with magnetic sub–state and the average of respectively. On the other hand, the production of an –wave pair would lead to a flat distribution in the decay angle .
The helicity distribution is obtained by choosing the quantization axis to lie along that of the recoiling 3He nucleus. Since any anisotropy here must be proportional to the square of the 3He momentum, i.e. the excess energy in the He system, it is not surprising that the results shown in Fig. 9 at MeV are consistent with a flat distribution.
The axis for the Jackson angle is taken to be the relative momentum in the initial system which, for near–threshold production, can be replaced by the incident proton momentum. In the right panel of Fig. 10 the distribution in this angle is shown separately for the –rich region, where MeV, and the remainder. In order to demonstrate the very different slopes in the two regions, the data have been arbitrarily scaled such that the cross sections have similar values when . These slopes are determined by the fraction of the cross section associated with production and the polarization. The straight lines in the figure are obtained by using the contribution determined from the fits to the distribution of Fig. 5 assuming that the meson is produced purely with . This ansatz describes the main features of the data in both energy regions. Alternatively, fitting Eq. (1) to the data with MeV gives , where the error bar is statistical and does not take into account that arising from the identification of the cross section.
The data of Fig. 5 may be used to try to put limits on the cross section for scalar meson production and, in particular, on the . Whereas PDG reports that the decay is merely seen, a recent measurement of the decay into pions and kaons performed at BES2 BES yielded a branch into . We re-analyzed the distribution adding incoherently a third component corresponding to a state of mass 980 MeV/c2 and width MeV/c2. The fits yielded zero cross section for the branch with upper limits of 6%, 7%, and 9% of the prompt cross section at our three energies.
In Fig. 11 we show the shape expected for a contribution to the differential spectrum at the three excess energies. The maximum around MeV spoils the agreement with the shape of the experimental spectra. However, typically only three data points are in this range and it is precisely here that the uncertainties in the efficiency corrections are the largest. Higher statistics data would be needed to pin down unambiguously the fraction of scalar meson production in the present reaction. Such data might be obtained from studies of the stronger decay channel into two pions but the angular acceptance of the MOMO vertex detector is too small to detect these particles.
V Total Cross Sections
The total and prompt kaon production cross sections, obtained by integrating the fits to Fig. 5, are presented in Table 1. In the case, the branching ratio BR PDG06 has been included. The value of the energy resolution parameter is that deduced from the peak, after taking the natural width of MeV/c2 into account.
| Beam Momentum (MeV/c) | |||
|---|---|---|---|
| (MeV) | |||
| (nb) | |||
| (MeV) | |||
| (nb) | |||
| (nb/sr) |
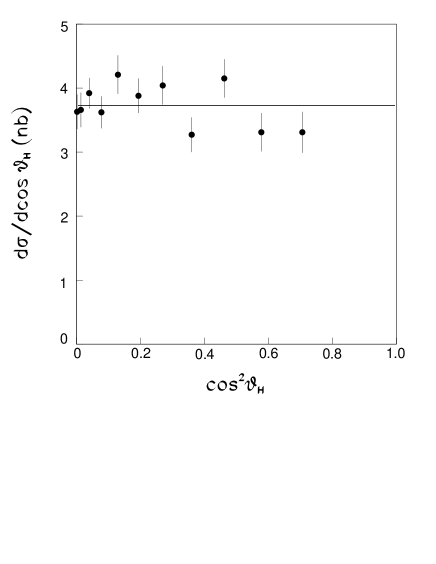
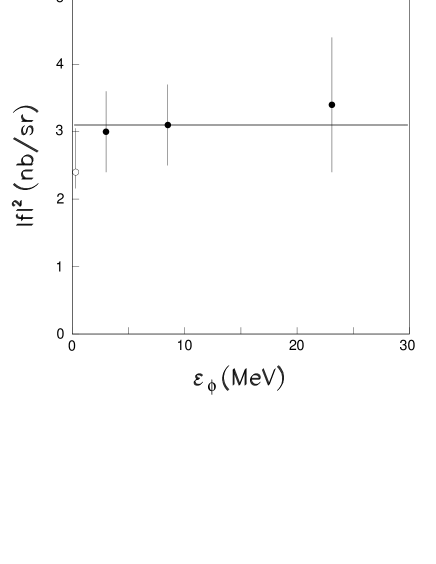
The spin–averaged square of the matrix element for production can be extracted from the total cross section using
| (2) |
where is the phase–space factor of the ratio of the incident to the final cm momenta. Provided that there is no strong interaction between the and the 3He, one would expect at these low energies to have predominantly –wave production with very little variation of , and this is what is seen from the results shown in Table 1. Furthermore, the values obtained are consistent with that found with the SPESIV spectrometer Wurzinger96 , which at MeV gave nb/sr, where the first error is statistical and the second systematic. The mean value of this and our results, which are shown together in Fig. 12, is nb/sr. This very smooth behavior with energy is to be contrasted with the case of , where the amplitude is seen to be suppressed as soon as the excess energy is similar to the width of the Wurzinger95 , though the interpretation of these data has been questioned HK .
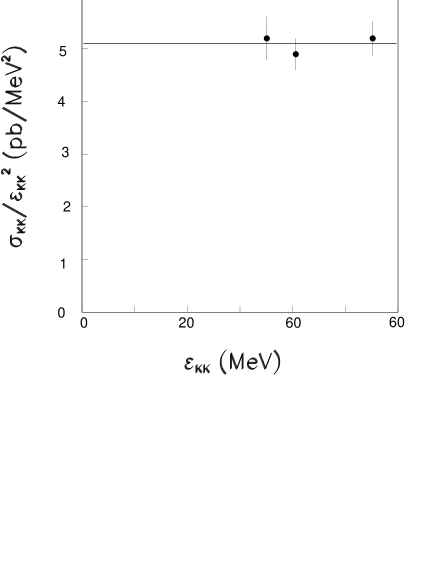
If the prompt production is not influenced by resonances or other dynamical effects, then the total cross section might be expected to vary like phase space, i.e. as . The ratio shown in Fig. 13 is consistent with the constant value of pb/MeV2. The absence of any obvious effects from the –wave resonances, both in the total production cross sections and in the distributions of Fig. 5, could be due to their very large widths and small branching ratios PDG06 .
The only dynamical estimate of production in this reaction has been made in a two–step model, where a pion beam is produced via on one target nucleon, with the meson being created through a subsequent reaction on the second nucleon in the target. Though this approach reproduces reasonably well the rates for , , and production, it underpredicts production by at least a factor of five Faeldt95 . Other theoretical models are therefore necessary to describe production, possibly involving intermediate as well as mesons.
The ratio of to production in various nuclear reactions has often been discussed in terms of the OZI rule OZI , which suggests that, due to mixing at the quark level, the ratio
| (3) |
should be of the order of . As discussed by Wurzinger et al. Wurzinger96 , the difficulty in extracting numerical values for this ratio resides in the very strong and unexplained energy dependence observed in the amplitude for production Wurzinger95 . If we follow their prescription to correct for this and other effects, we find that , which is much larger than the ratio obtained in near–threshold production in proton–proton collisions at similar excitation energies Hartmann .
VI Conclusions
In summary, we have made exclusive measurements of the reaction at three energies above the threshold. By making fits to the excitation energy distribution in terms of phase space plus a resonance contribution, we have decomposed the cross section into terms corresponding to prompt and production. Distributions in other variables seem to be consistent with this assumption and no firm evidence is found for the scalar resonance decaying into . Both data sets are consistent with pure –wave production, with the cross section varying like and the as . The most striking effect though comes from the study of the decay distribution in the rest frame, which shows that the is formed predominantly with polarization along the proton beam direction, and this must be an important clue to the dynamics. Data on the analogous reaction are currently being analyzed at CELSIUS Karin . The polarization of the is measured through the decay and the results could be particularly illuminating.
ACKNOWLEDGEMENTS
The quality of the beam necessary for the success of this work is due mainly to the efforts of the COSY operator crew. Thanks goes also to Big Karl technical staff for continuous help. Support by Forschungszentrum Jülich (FFE) and Bundesministerium für Forschung und Wissenschaft is gratefully acknowledged.
References
- (1) V.N. Nikulin et al., Phys. Rev. C 54, 1732 (1996).
- (2) J. Berger et al., Phys. Rev. Lett. 61, 919 (1988); B. Mayer et al, Phys. Rev. C 53, 2068 (1996).
- (3) R. Wurzinger et al., Phys. Rev. C 51, R443 (1995).
- (4) R. Wurzinger et al., Phys. Lett. B 374, 283 (1996); R. Wurzinger, PhD thesis, University of Bonn (1992); A. Kozela, PhD thesis, Jagellonian University, Cracow (1994).
- (5) W.-M. Yao et al., J. Phys. G 33, 1 (2006).
- (6) F. Bellemann et al. (COSY–MOMO Collaboration), Phys. Rev. C 60, 061002 (1999); F. Bellemann, PhD thesis, University of Bonn (1998).
- (7) M. Drochner et al., Nucl. Phys. A 643, 55 (1998).
- (8) R. Ibald, PhD thesis, University of Bonn (2000); J. Munkel, PhD thesis, University of Bonn (2001); H.A. Schnitker, PhD thesis, University of Bonn (2002).
- (9) V. Jaeckle et al., Nucl. Instrum. Meth. A 349, 15 (1994).
- (10) K. Gottfried and J.D. Jackson, Nuovo Cim. 33, 309 (1964).
- (11) E. Byckling and K. Kajantie, Particle Kinematics, (Wiley, N.Y., 1973).
- (12) G. Fäldt and C. Wilkin, Phys. Lett. B 354, 20 (1995); L.A. Kondratyuk and Yu.N. Uzikov, Phys. At. Nucl. 60, 468 (1997).
- (13) S. Okubo, Phys. Lett. 5, 165 (1963); G. Zweig, CERN report TH-401 (1964); J. Iizuka, Prog. Theor. Phys. Suppl. 38, 21 (1966).
- (14) M. Hartmann et al., Phys. Rev. Lett. 96, 242301 (2006).
- (15) M. Ablikim et al., Phys. Lett. B 607, 243 (2005).
- (16) C. Hanhart and A. Kudryavtsev, Eur. Phys. J. A 6, 325 (1999).
- (17) K. Schonning and B. Höistad (private communication).