Systematics of Stopping and Flow in Au+Au Collisions
Abstract
Excitation functions of flow and stopping observables for the Au+Au system at energies from 40 to 1500 MeV per nucleon are presented. The systematics were obtained by merging the results of the INDRA and FOPI experiments, both performed at the GSI facility. The connection to the nuclear equation of state is discussed.
pacs:
25.70.-zLow and intermediate energy heavy-ion reactions and 25.75.LdCollective flow and 25.70.MnProjectile and target fragmentation1 Introduction
The study of collective flow in nucleus-nucleus collisions has been an intense field of research for the past twenty years reisdorf97 ; herrmann99 . At beam energies below several GeV per nucleon, it is mainly motivated by the goal to extract the equation of state (EoS) of nuclear matter from the quantitative comparison of measurements with the results of microscopic transport-model calculations stocker86 ; danielewicz00 ; danielewicz02 . Considerable progress has been made in this direction in recent years but the constraints on the EoS obtained so far remain rather broad danielewicz02 ; flow_chapt .
The results of flow measurements performed before 1999 have been extensively reviewed in refs. reisdorf97 ; herrmann99 . In the meanwhile, a variety of new results has become available regarding the directed reisdorf04 ; lemmon99 ; htun99 ; liu00 ; prendergast00 ; magestro00a ; crochet00 ; crochet01 ; devismes02 ; uhlig05 ; westfall01 ; andronic01 ; andronic03 ; magestro00 ; cussol02 ; lukasik05 ; abd00 ; chkhaidze01 ; simic01 ; bastid04 ; bastid05 and elliptic lukasik05 ; abd00 ; chkhaidze01 ; simic01 ; bastid04 ; bastid05 ; pinkenburg99 ; andronic01npa ; chung02 ; andronic05 ; stoicea04 ; lukasik04 flow. These recent experiments have expanded the study of flow over a broader range of incident energies. New results became available on collective motion of produced particles crochet00 ; crochet01 ; devismes02 ; uhlig05 . Several studies have focussed on balance (or transition) energies associated with sign changes of a flow parameter pinkenburg99 ; andronic01npa ; chung02 ; andronic05 ; magestro00 ; cussol02 ; lukasik05 . High statistics measurements allowed to explore the transverse momentum dependence of flow liu00 ; andronic01 ; andronic03 ; bastid05 ; andronic05 .
Since flow is generated by pressure gradients, it is clear that its quantitative study reveals aspects of the EoS. However, by itself, flow is not sufficient to fix the EoS. We need to know, as a function of beam energy, what density was achieved in the collision. An optimal condition that matter be piled up to form a dense medium, is that the two colliding ions be stopped in the course of the collision, before the system starts to expand. Information on the stopping can be obtained by studying the rapidity density distributions of the ejectiles in both the beam direction (the original direction) and the transverse direction. Recently reisdorf04 , the ratio of the variances of the transverse to the longitudinal rapidities was proposed as an indicator of the degree of stopping and it was found to correlate with flow provided the incident energy exceeded MeV. While this flow-stopping correlation is only indirectly connected to a pressure-density correlation, it represents a potentially interesting constraint for microscopic simulations tending to extract the EoS from heavy ion data.
The main purpose of this review is to present the excitation functions of flow (directed and elliptic) and of stopping in 197Au + 197Au collisions. This heavy, symmetric system has been studied with a variety of detectors in the intermediate energy domain throughout the last two decades:
| Experiment | Reference | E/A (MeV) |
|---|---|---|
| PLASTIC-BALL | doss86 ; doss87 ; gutbrod89rep ; gutbrod90 | 150-1050 |
| MSU-ALADIN | tsang93 ; hsi94 ; tsang96 | 100-400 |
| LAND-FOPI | leifels93 | 400 |
| FOPI | ritman95 ; andronic01npa ; andronic05 | 90-1500 |
| EOS | partlan95 | 250-1150 |
| MULTICS-MINIBALL | dagostino95 ; dagostino96 | 35 |
| MSU-4 | magestro00 | 25-60 |
| INDRA-ALADIN | lukasik02 ; lukasik05 ; lefevre04 | 40-150 |
| CHIMERA | pagano05 | 15 |
The phase space coverage and the range of observables reported in these studies vary considerably. All these data sets could be and, in most cases, were indeed used for flow studies. However, except for the comparative study between the Plastic Ball and the EOS data on directed flow partlan95 , and between the Plastic Ball, the FOPI and the INDRA data on elliptic flow andronic01npa ; lukasik05 , no detailed comparison has been made so far, in this energy domain, of the results obtained by different experimental groups with different detectors.
In this work we will concentrate on the results obtained with the FOPI and INDRA detector systems in experiments performed at the heavy-ion synchrotron SIS at GSI Darmstadt andronic01 ; reisdorf04 ; lukasik05 ; andronic05 . The covered ranges of incident energies were MeV to GeV in the FOPI and to MeV in the INDRA experiments. By combining the results obtained with the two detectors, having well adapted designs for the two different energy regimes, we were able to construct coherent systematics revealing a remarkable evolution of flow and stopping over a large range of incident energies.
The observed agreement in the overlap region will serve as a measure of the absolute accuracy of the experimental data. We will focus on two aspects in this context, the systematic errors associated with the unavoidable deficiencies of the experimental devices and on the systematic errors resulting from the analysis methods which are not necessarily independent of the former. Since the two detectors have different acceptances and the reaction mechanism evolves in the energy region covered by the two experiments, particular attention will be given to the problem of impact-parameter selection and to the corrections for the reaction plane dispersion, which need to be adapted accordingly. For the latter a new method has been devised and applied to the INDRA data.
2 The detectors
The INDRA detector is constructed as a set of 17 detection rings with azimuthal symmetry around the beam axis. The most forward ring consists of 12 Si () – CsI(Tl) (15 cm long) telescopes. The angular range to is covered by 8 rings of 192 telescopes in total, each with three detection layers: ionization chambers (5 cm of at 50 mbar), Si-detectors () and CsI(Tl) scintillators with lengths decreasing from 13.8 cm to 9 cm with increasing angle. The remaining 8 rings, covering the region , have two detection layers: ionization chambers (5 cm of at 30 mbar and CsI(Tl) scintillators (7.6 to 5 cm). The total granularity is 336 detection cells covering 90% of the 4 solid angle.
In the forward region (), ions with 5Z80 are identified using the E-E method. Over the whole angular range, isotope identification is obtained for 1Z4 using the technique of pulse-shape discrimination for the CsI(Tl) signals. A complete technical description of the detector and of its electronics can be found in pouthas95 , details of the calibrations performed for the GSI experiments are given in lukasik02 ; trzcinski03 .
The FOPI detector gobbi93 ; ritman95 is comprised of two main components: the forward Plastic Wall and the Central Drift Chamber, covering regions of laboratory polar angles of 1.2 30∘ and 34 145∘, respectively. The Plastic Wall consists of 764 individual plastic scintillator units. Detected reaction products are identified according to their atomic number, up to , using the measured time-of-flight (ToF) and specific energy loss. Particles detected with the Central Drift Chamber () are identified according to their mass () by using the measured magnetic rigidity and specific energy loss. The 3-dimensional tracking profits from a high equivalent detector granularity. At beam energies of MeV and above, the forward drift chamber Helitron can be employed for mass identification of light fragments () at angles 7 29∘.
The FOPI detector has an effective granularity exceeding that of INDRA by about a factor of 4, a property matched to the increasing multiplicity of charged particles with rising beam energy111The -integrated charged particle multiplicities in central collisions increase from typically about 40 at MeV to 95 at MeV and exceed 200 (with one quarter of them being charged pions) at GeV.. Both, INDRA and FOPI detectors are essentially blind to neutral particles, such as neutrons, and ’s. The higher granularity is, however, not the only feature helping to cope with higher energies. As the energy of the emitted particles rises, a level is reached where the principle of stopping the particle in a sensitive detecting material in order to determine its energy is no longer adequate because the material depth needed leads to a high probability of nuclear reactions undermining the energy measurement. To avoid this difficulty, one switches to time-of-flight and magnetic rigidity (in addition to energy loss) measurements: the apparatus becomes larger and is no longer under vacuum. Hence the detection thresholds for the various ejectiles are raised. For the FOPI detectors this means that, e.g., at MeV fragments with cannot be detected at midrapidity anymore.
3 Impact parameter
In a binary collision of massive ‘objects’, the transfer of energy, momentum, angular momentum, mass etc. between the two partners will be strongly affected by the impact parameter . As a consequence one expects to observe large event-to-event fluctuations due to impact parameter mixing. To be meaningful, a comparison of experimental observations among each other or with the predictions of theoretical simulations has to be performed for well defined and sufficiently narrow intervals of impact parameter. Generally in microscopic physics and, in particular, in nuclear physics, the impact parameter is not directly measurable but has to be estimated from global observables characterizing the registered events. Global observables are determined using all or a significant fraction of the detected particles.
The basic, so-called geometrical model assumption cavata90 , underlying the association of an impact parameter with an observed value is that changes strictly monotonically with allowing to postulate
| (1) |
where the left (right) hand equation holds for decreasing (rising) with . The distribution is determined experimentally in terms of differential cross sections per unit of in a minimum bias class of events, i.e. where a minimum number of conditions was required to trigger data taking.
At intermediate to low incident energies, especially for MeV, the literature abounds with an impressive diversity in the choice of global observables that have been used in attempts to select either narrowly constrained impact parameters (keywords ‘highly exclusive’ or ‘ultracentral’) or events of special interest (keywords ‘fully equilibrated’, ‘fully evaporated’, ‘signals of phase coexistence’). The observables vary from very simple ones like proton, neutron or total charged-particle multiplicity to more specific ones as, e.g., participant proton multiplicity () gosset77 ; doss85 , total (ET) phair92 ; pak96 or light charged particle transverse kinetic energy (E) lukasik97 , ratio of transverse-to-longitudinal kinetic energy () kuhn93 ; reisdorf97a , degree of isotropy of momenta () strobele83 ; larochelle96 , transverse momentum directivity () beckmann87 ; bock87 ; alard92 ; phair93 , longitudinal kinetic-energy fraction (Ee) bertch78 ; cugnon83 , linear momentum transfer awes81 , total kinetic-energy loss () charity91 ; piantelli02 , average parallel velocity () peter90a , midrapidity charge () ogilvie89a , total charge of Z2 products () hubele91 ; schuttauf96 , longitudinal component of the quadrupole moment tensor () bauer88 . Even more complex observables are those obtained from sphericity hanson75 ; brandt79 , from the kinetic energy tensor gyulassy82 ; buchwald83 or momentum tensor wu79 ; cugnon82 ; cugnon83 , the thrust () farhi77 ; kapusta81 ; cugnon83 , the deflection angle of the projectile () buchwald81 , the flow angle () stocker86 ; frankland01 , the location in a ‘Wilczyński plot’ charity91 ; lecolley96 ; frankland01 , harmonic moments () fox78 ; fox79 ; frankland01 , or combined global variables () pawlowski97 . The most sophisticated methods used for impact-parameter selection are based on, e.g., principal component analysis () desesquelles95 ; desesquelles95a ; geraci04 or on neural-network techniques () bass94 ; david95 ; haddad97 .
There are also more technical event selection schemes involving the postulation of ‘complete’ events by demanding that nearly the full system charge or the full total linear momentum is accounted for. These latter methods are specific for a given apparatus since these observables, strictly constrained by conservation laws, would not be impact parameter selective when using a perfect detection system. In this case, a comparison of different experimental data sets at a high level of precision is difficult and a comparison with theoretical approaches must use apparatus specific filter software that reproduces the hardware cuts causing the observed selectivity. In the present study, aiming towards joining up the data of two rather different setups, we will try to avoid using such concepts. We will restrict ourselves to the use of ‘simple’ global observables such as total charged particle multiplicity or transverse energy or its variants (limited to ) and which, although it involves also the longitudinal kinetic energy, is highly correlated to due to energy conservation constraints.
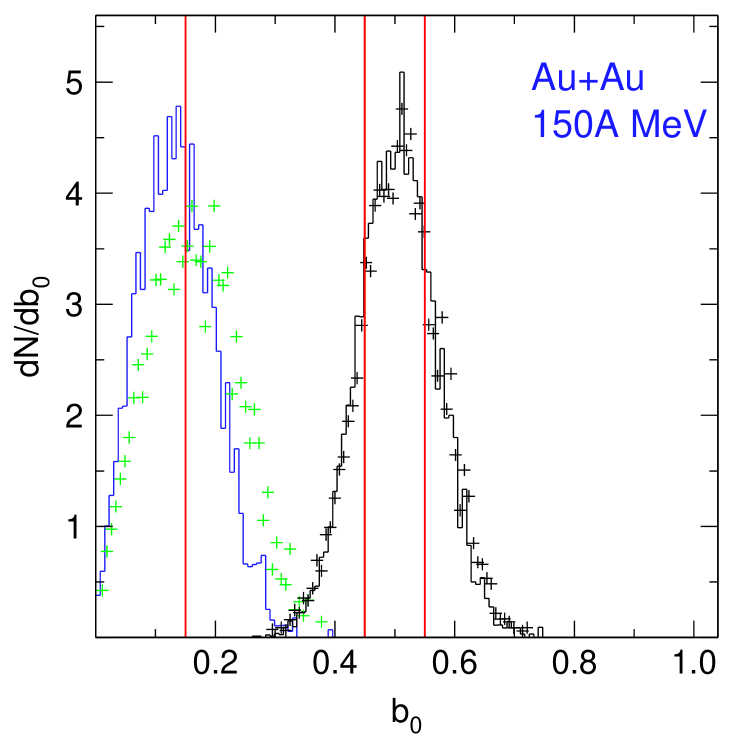
The quality of the achieved selectivity in impact parameter is illustrated in fig. 1. It shows distributions of the scaled impact parameter as obtained from the IQMD transport code hartnack98 simulations for the reaction 197Au + 197Au at MeV. We take fm and estimate from the calculated differential cross sections for the or multiplicity distributions, using the geometrical sharp-cut approximation. The figure gives an idea of the achievable impact parameter resolution, typically 1 to 2 fm for Au on Au, an unavoidable finite size effect. The semi-central event class, at this energy, happens to be almost invariant against the choice of the selection method. For the central sample, about 130 mb here, the selection is somewhat more effective than the multiplicity selection, an observation andronic01npa found to hold for all higher energies studied with FOPI. We also conclude that with this selection technique cross section samples significantly smaller than 100 mb cannot be considered as representative of the chosen nominal value.
In this simulation perfect acceptance was assumed. In reality, limitations of the apparatus will further reduce the achievable selectivity. For the case of FOPI, extensive simulations suggested that the additional loss of performance is small, provided the incident energy per nucleon, , is at least 150 MeV and the considered range of reduced impact parameter does not significantly exceed .
At sufficiently high , the measured directed flow can be used for a model-independent comparison of the relative performance of different selection methods. This is illustrated in fig. 2 with FOPI data for the reaction Au+Au at MeV and for impact-parameter selections using either or the multiplicity of charged particles in the geometrical sharp-cut approximation.
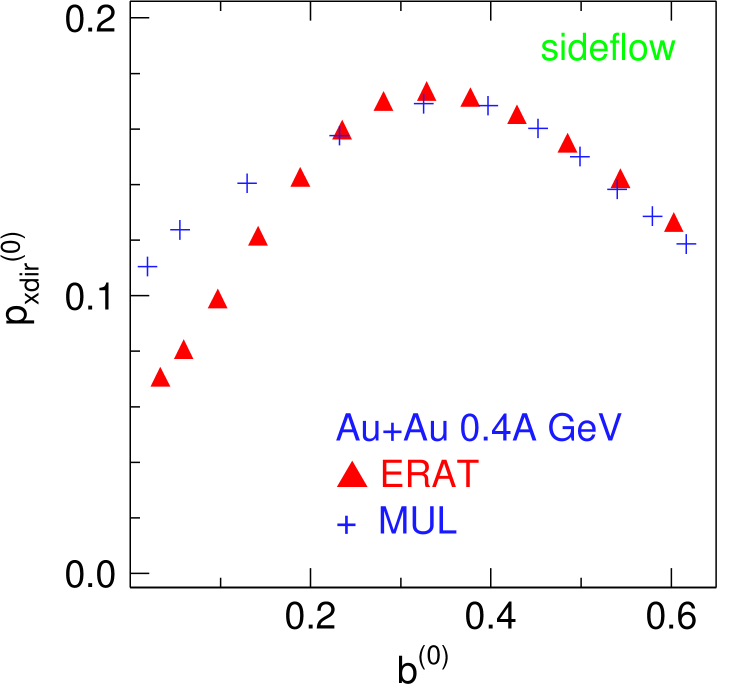
The scaled directed flow is where ( fragment charge, spatial part of the center of mass projectile 4-velocity, is the transverse projection of the fragment 4-velocity on the reaction plane danielewicz85 ). The sum is taken over all measured charged particles with , excluding pions, and is the c.m. rapidity. For symmetry reasons, has to converge to zero as . The figure, therefore, indicates that (i) the resolution is not perfect in either case and (ii) for the most central collisions the selection provides a more stringent impact parameter resolution than the multiplicity selection, as already expected on the basis of the simulations (fig. 1). The maximum value of , on the other hand, and the interval where it is located are robust observables which do not significantly depend on the selection method. Based on these observations, when FOPI data is analyzed, in general one employs a mixed multiplicity- strategy for centrality selection.
Not all global observables behave monotonically with impact parameter, as evident for from fig. 2. If they are used to select central collisions an additional cut is required to suppress the high branch. Non-monotonic behaviour can also result from losses of heavy ejectiles close to zero degree or close to target rapidity. These losses tend to increase with decreasing and (or) increasing . In the FOPI case we limit our analysis to and require that at least of the total charge has been identified, a moderate, apparatus specific, constraint that does not significantly bias the topology of central collisions.
While for particle multiplicities the idea of a monotonic correlation is intuitively expected, this is not self-evident for transverse energy. At sufficiently high energy ( MeV), transverse energy is increasingly generated by the repeated action of many elementary collisions on the nucleonic level. Since the number of such collisions increases with increasing target-projectile overlap, high transverse energies are correlated with low impact parameters. If is smaller than about 100 MeV mean field effects involving the system as a whole dominate. One observes deflections of the projectile-like and target-like remnants to finite polar angles generating transverse energies that are associated with large impact parameters which carry large angular momenta. This complication can be avoided by using the sum of transverse momenta of light charged particles () which is more strongly related to the dissipated energy and does not involve properties of heavier fragments.
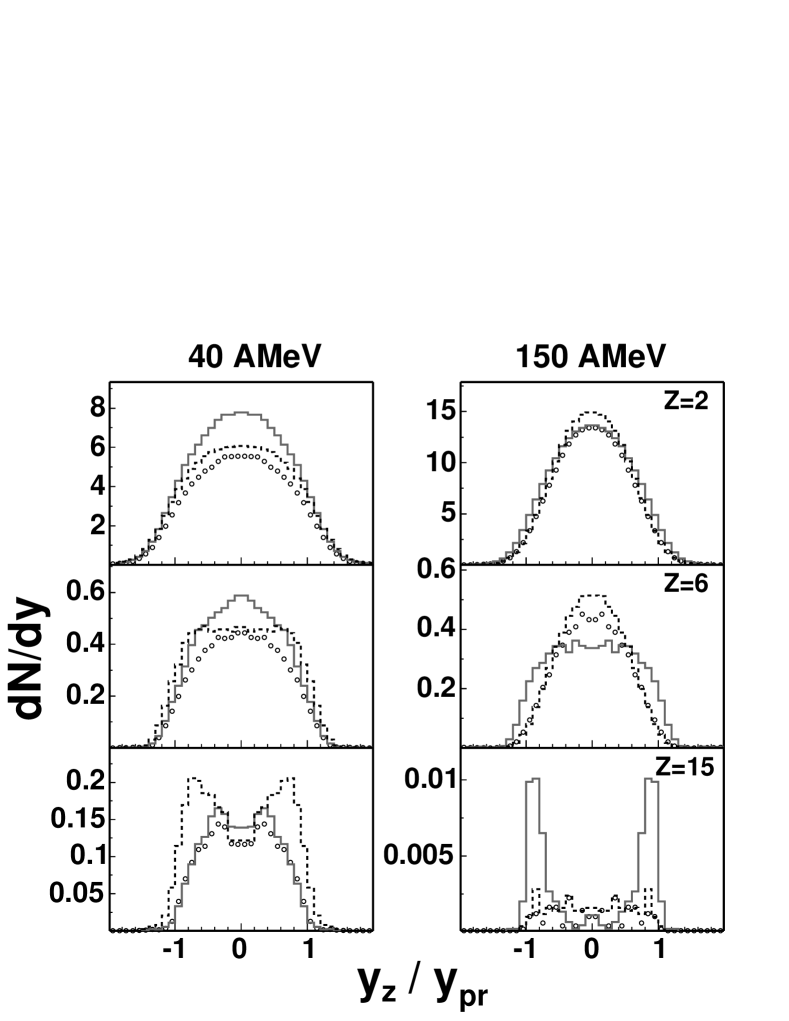
These complexities are illustrated in fig. 3 using INDRA data for Au+Au at MeV and MeV. Shown are charge-separated longitudinal rapidity distributions for central collisions, selected with three different observables, multiplicity, and . To the extent that stronger yield accumulations near midrapidity indicate higher centrality, the multiplicity binning is more selective of central collisions than at MeV while at MeV the reverse is true. This appears more pronounced for the cases of larger fragments shown in the lower panels.
For the and selections in fig. 3 the centrality has been defined by all the relevant reaction products except the one of interest. This method of excluding the ‘particle of interest’ (POI) from the selection criteria allows to avoid autocorrelations between the studied observable and the one used for the estimation of centrality. On the other hand, the exclusion of the POI makes the observable used for the impact parameter selection particle dependent, i.e. no longer globally event dependent. This may affect the partitions belonging to a given centrality bin since, depending on the particle, the event may, or may not fulfill the criteria for a given centrality class. It has serious consequences when the autocorrelation is strong, especially for low energy collisions which are characterized by the presence of intermediate and heavy mass fragments carrying substantial amounts of momentum. Excluding, or missing, such a fragment unavoidably affects the measure of the impact parameter and increases its fluctuations. does not depend on the exclusion or detection of heavy fragments and thus is better suited for lower energies.
On the other hand, in the case of the INDRA detector, the multiplicity observable does not seem to be the optimal centrality selector at high energies (fig. 3, right bottom panel) where due to inefficiencies for light particles (multi-hits, punch throughs), this observable may admix less central events with higher multiplicities of fragments to the most central bin. Using as a centrality selector avoids switching the selection method when studying excitation functions. As can be seen in the figure, performs similar to multiplicity at MeV and similar to at MeV. Since molecular dynamics simulations confirm this observation plagnol00 , we choose in the following as a centrality measure for the INDRA data, unless indicated otherwise.
4 Rapidity density and stopping
Rapidity distributions in longitudinal () and in an arbitrarily fixed transverse direction () as obtained with the FOPI and INDRA detectors for central Au+Au collisions at MeV are shown in fig. 4.
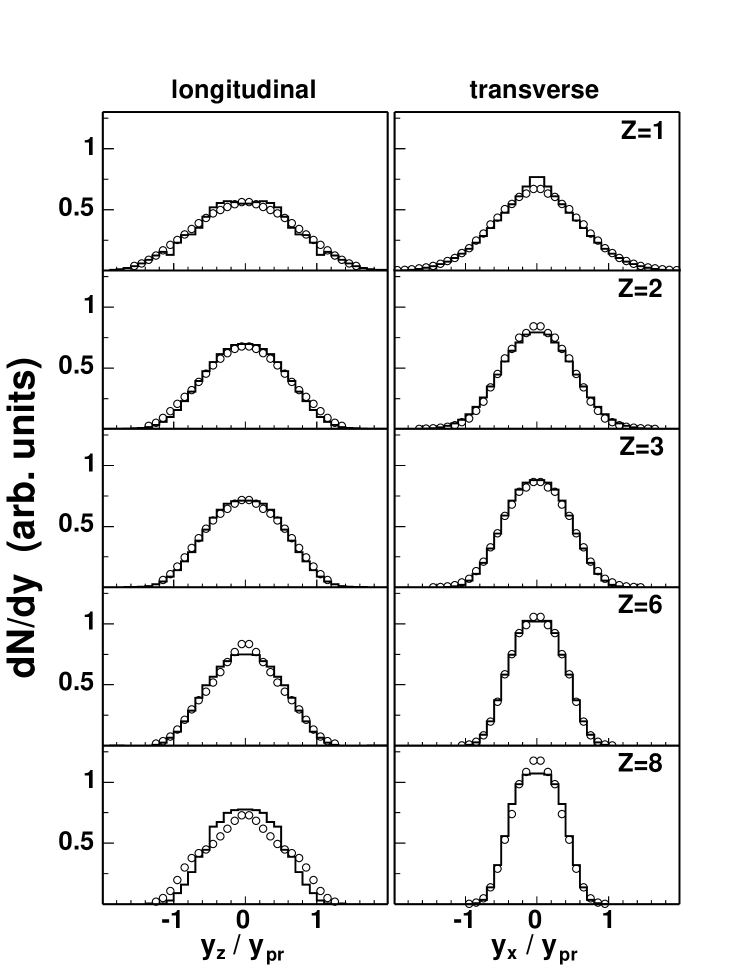
To allow a closer comparison of the shapes the distributions have been normalized to the unit area, individually for each fragment charge. The observable constructed from all detected reaction products except the particle of interest was used as impact-parameter selector. In the case of the FOPI data, the distributions have been reconstructed for the uncovered phase space and symmetrized with respect to the c.m. rapidity using two-dimensional extrapolation methods reisdorf04a in the transverse-momentum vs. rapidity plane. For these corrections represent less than of the total yield, for heavier fragments they amount up to , leading to estimated uncertainties of near midrapidity and of for . The INDRA distributions have been corrected for the 10% geometrical inefficiency pouthas95 by multiplying the yields with a factor of 1.11. The positions of the detected particles and fragments were uniformly randomized within the active area of the detection modules. For the backward c.m. distribution was used and reflected into the forward hemisphere which is affected by losses due to punch-through of energetic particles. For heavier charges the forward part was used and symmetrized to profit from the higher granularity of the detector there and to avoid the higher thresholds affecting the yields at backward angles.
Taking into account the systematic errors (not shown in the figure), the agreement of the two independent measurements is very good. This feature is far from trivial: due to different acceptances, especially for heavier fragments, the composition of the global event selector cannot be made strictly identical for the two detectors. Since at this incident energy the difference between rapidity and velocity is small, one can say that in a naive thermal equilibrium model, ignoring flow and partial transparency effects, the two kinds of distributions, longitudinal and transverse, ought to be equal, with the common variances being a measure of the (kinetic) temperature. Clearly, this is not the case, the transverse widths are smaller than the longitudinal widths, even though the selection method, using maximal , is definitely biased towards isolating the event sample (on the 130 mb level) with the largest ratio of transverse-to-longitudinal variances (although, as mentioned earlier, autocorrelations were removed).
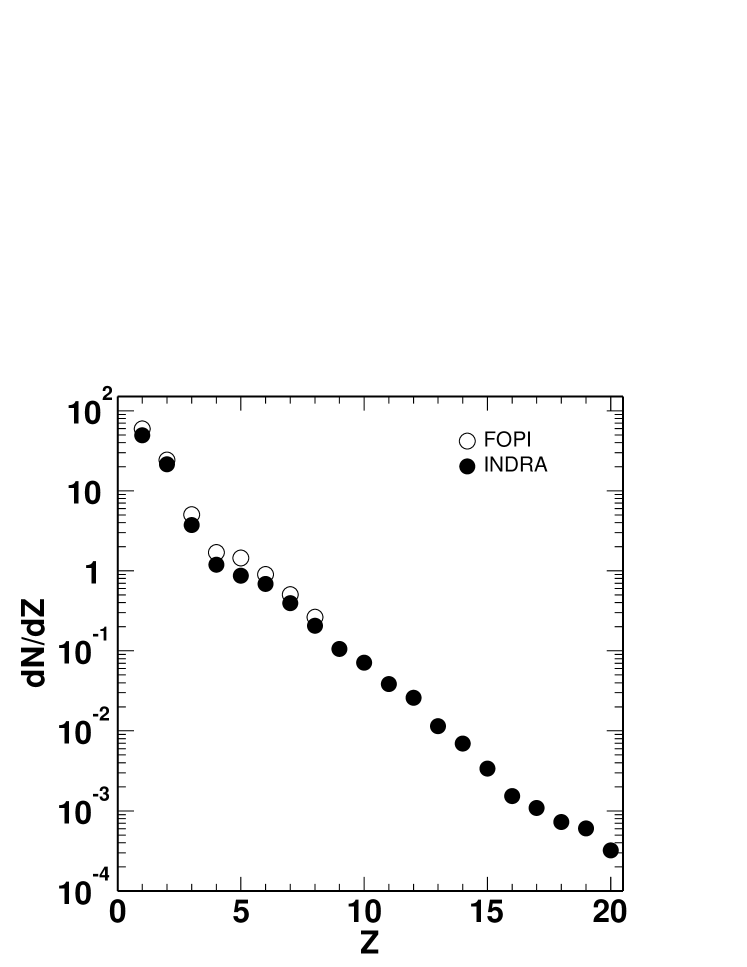
The integration over rapidity yields absolute charged-particle distributions . The results for Au+Au at MeV are shown in fig. 5. For FOPI, only yields are available at this energy while the INDRA data extend over almost 6 orders of magnitude up to . The observed yields of heavy fragments are small, however, only about 2-3% of the available charge is clusterized in fragments with , as expected at this energy where the c.m. collision energy amounts to four times the nuclear binding energy. With these 3% added, the FOPI data account for 97% of the total system charge which is consistent with the -reconstruction method. The INDRA yields are systematically lower than FOPI by between 10% and 30%. The lower yield is mainly responsible for the detection of only of the total system charge with INDRA but similar differences are also observed for larger . They are most likely caused by reaction losses and edge effects in the detectors which reduce the effective solid-angle coverage if identification is required. The light particle yields may also be affected by the higher multi-hit probabilities at this incident energy at the upper end of the INDRA regime. Extrapolating these observations over the full range of incident energies studied in this work, one may expect that reaction losses and the multi-hit probability are considerably reduced at lower incident energies for INDRA while the missing yields at large in the FOPI case will be negligible at higher energies for the mainly central and mid-central collisions that are of interest here.
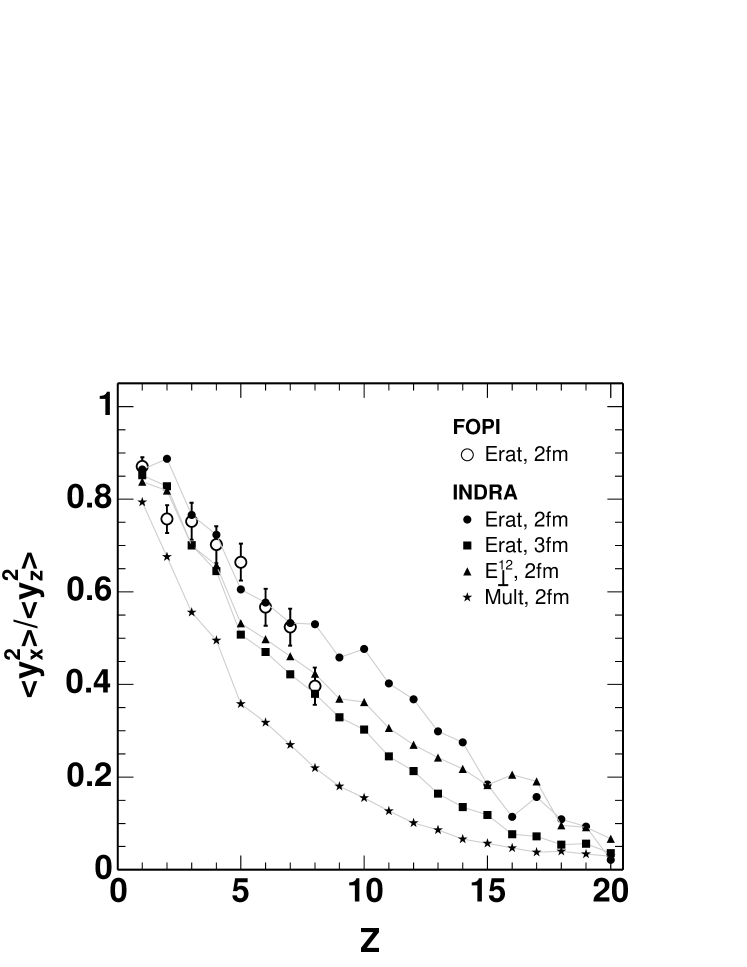
The ratio of the variances of the transverse and longitudinal rapidity distributions has recently been proposed as a measure of the degree of stopping reached in nuclear collisions reisdorf04 . The ratios obtained for central Au+Au collisions at MeV, after integration over the range of scaled c.m. rapidity -1y1, are shown in fig. 6 as a function of . The open circles represent the FOPI data with error bars which include the systematic uncertainty of the reconstruction procedure. The INDRA data are shown for and for four different impact parameter selections as indicated in the figure.
The largest ratios 0.8 to 0.9 are observed for light charged particles (). With increasing fragment , the ratios decrease continuously to values of near . In the common range of fragment and for the same impact-parameter selection ( fm), the ratios measured with FOPI and INDRA are in good agreement. The selection with and fm yields slightly smaller ratios as expected which, however, are similar to those obtained with . Large transverse momenta of light charged particles and of fragments are apparently correlated. Autocorrelations are not present here because the particle of interest is removed from the impact parameter selector (see previous section). The smallest ratios of variances are obtained for selections according to multiplicity.
The trends as observed as a function of suggest that the heavier fragments, even in rather central collisions, experience less stopping than lighter ones and keep a strong memory of the entrance channel motion. Their transverse momenta seem to be, nevertheless, generated in collisions involving nucleons or light clusters as evident from the correlation with . The momenta of struck nucleons absorbed in a cluster or the recoil momenta of nucleons knocked out from a cluster both contribute to their final momenta. Their relative weight will be smaller in larger fragments, consistent with the observed dependence. Overall, these observations are clearly in contradiction to the assumption of global equilibrium including the kinetic degrees of freedom. Qualitatively, they agree with the predictions of quantum molecular dynamics calculations for fragment production in this energy range zbiri .
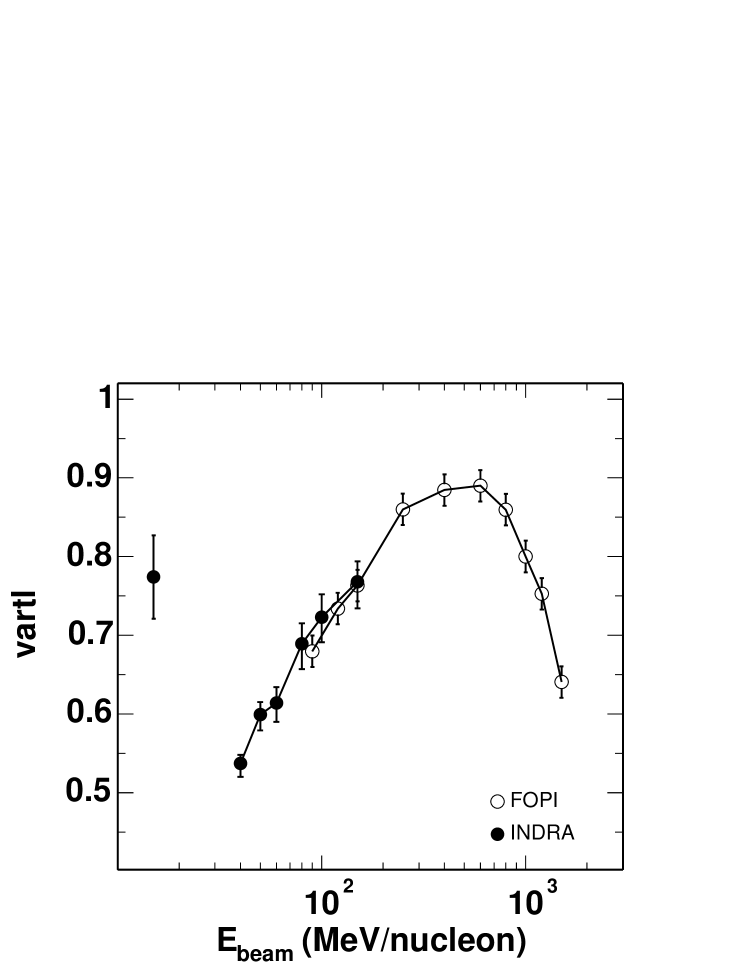
A global observable to describe stopping, , has been introduced in ref. reisdorf04 . It is defined as the ratio of the transverse over longitudinal variances of the summed and -weighted rapidity distributions. The excitation function of this observable is presented in fig. 7 for central Au+Au collisions ( fm) and for the full energy range covered in the FOPI and INDRA experiments.
The FOPI results have been obtained with the selection. The data have recently been reanalyzed by taking additional small corrections due to energy losses in structural parts of the detector into account. At the lowest three energies, this has led to an increase of by up to about 10% compared to the data published in reisdorf04 , while for the other energies the results are unaffected. The measured range of fragments extends up to for , , MeV, respectively. The contribution of heavier fragments to the observable has been estimated by extrapolating their weights and variance ratios to higher . At MeV this correction amounts to about 8%. The errors given in the figure are systematic and mainly reflect the uncertainty of the reconstruction procedure.
For the INDRA central event samples, the light-particle transverse energy E has been used to select fm for to MeV and fm for the data sample at MeV with low statistics, originally only taken for calibration purposes. For the charge-weighted average, fragments up to have been included. Except for the result at MeV, the error bars correspond to the variation of for centrality selections within fm (upper end of the error bar) and fm (lower end) and thus represent the systematic uncertainty associated with the impact parameter determination. The statistical errors are below the percent level, except at MeV, where they are the main contribution to the error shown in the figure.
The obtained excitation function of stopping is characterized by a broad plateau extending from about to MeV with fairly rapid drops above and below. The highest value reached by is about 0.9. With the INDRA data, the reduction of stopping at lower incident energies is followed down to MeV. In the overlap region, a very satisfactory agreement within errors is observed. The measurement at MeV suggests that stopping goes through a minimum at or below MeV.
It is clear that only a dynamical theory will be able to reproduce this excitation function. Using the relativistic Boltzmann-Uehling-Uhlenbeck (RBUU) transport model, an analysis of the combined FOPI stopping and flow (see later) data was recently presented gaitanos05 . The input to computer codes implementing transport theoretical models are the nuclear mean field (or EoS) and the nucleon-nucleon () cross sections . Although both are not independent in a consistent theory, it is useful to consider their effects separately. In general one finds that the cross sectional part is dominant over the mean field part for a quantitative account of the observed incomplete stopping: note that if global equilibrium, or even local equilibrium (ideal hydrodynamics), were valid cross sections would be irrelevant. Starting at the low energy end one qualitatively expects, when raising the energy, that the increasingly repulsive mean field (due to increasing compression) and the drop in Pauli-blocking of final and intermediate states in scattering (due to the increasing initial rapidity gap) conspire to raise rapidly the generation of transverse energy at the expense of the longitudinal energy. At the higher energy end (say beyond GeV) again both aspects (mean field and collisions) more or less may add up to make the drop faster. At GeV roughly one quarter of the nucleons are excited to a resonant state. The opening up of nucleonic degrees of freedom may lead to a softening of the EoS. On the other hand the in-medium Dirac masses are predicted to drop substantially in covariant theories brockmann90 ; vandalen05 ; mishra04 , a fact that will seriously modify the phase-space and kinematical factors influencing the elementary cross sections malfliet88 ; fuchs01 ; larionov03 . The calculations of ref. gaitanos05 suggest that these in-medium modifications of are indeed necessary to reproduce the observed stopping.
Besides the ‘global’ information shown in fig. 7 the ‘particle differential’ information reveals additional information on the stopping mechanisms. Figure 6 shows that the partial transparency is predominantly experienced by the heavier fragments, which presumably have survived because their constituent nucleons have suffered a less violent average collision history. This feature is also observed at the high energy end, although the ‘heavy fragment’ role is played there by mass ejectiles fopi-tobe . Restricting the stopping observable to the lightest species at the various incident energies, one obtains higher values and flatter excitation functions. The combined role of the mean field and of in-medium modified cross sections will be picked up again in section 7 where the flow information will be added to the analysis.
5 Flow, reaction plane and corrections
Originally, the directed flow has been quantified by measuring the in-plane component of the transverse momentum danielewicz85 and the elliptic flow by parametrizing the azimuthal asymmetries using the Fourier expansion fits gutbrod89 ; demoulins90 . More recently, it has been proposed voloshin96 to express both, directed and elliptic flow in terms of the Fourier coefficients ( and , respectively) and also to investigate the higher flow components. The coefficients are obtained by means of the Fourier decomposition voloshin96 ; ollitrault97 ; poskanzer98 of the azimuthal distributions measured with respect to the true reaction plane:
| (2) |
with being the azimuth of the latter. In general, the coefficients may depend on the particle type, rapidity and the transverse momentum .
The standard methods of measuring flow can be split into those using explicitly the concept of the reaction plane danielewicz85 ; voloshin96 ; ollitrault97 ; poskanzer98 and those based on the two-particle azimuthal correlations wang91 . Still other methods have been proposed recently, satisfying the needs of high energy experiments: the ‘cumulant’ methods borghini01a ; borghini01 ; borghini02a using multi-particle correlations and the method based on the Lee–Yang theory of phase transitions bhalerao03 ; bhalerao04 . The latter is expected to perform well above about MeV bhalerao03 , while the three-particle variant of the ‘cumulant’ method is claimed to be useful for extracting coefficients at energies near the balance energy and in the ultrarelativistic regime borghini02a . However, because the correlation methods require high event multiplicities and high-statistics data, and because the correlation between a particle and the flow vector is usually much stronger than that between two particles borghini02 , the reaction plane methods are still more commonly used at intermediate energies. They have also been applied in the present case.
Since detectors do not allow to measure the angular momenta and spins of the reaction products, the orientation of the reaction plane can only be estimated using the momenta. The resulting azimuthal angle, , has a finite precision, and the measured coefficients are thus biased. They are related to the true ones through the following expression ollitrault97 :
| (3) |
where the average cosine of the azimuthal angle between the true and the estimated planes, , is the required correction (also referred to as ‘event plane resolution’ or just ‘resolution’) for a given harmonic. Note that, since the true values of flow are obtained by dividing by the average cosine, they are always larger than the measured ones.
The literature offers many different methods to estimate the reaction plane, like the flow-tensor method gyulassy82 , the fission-fragment plane tsang84a , the flow Q-vector method danielewicz85 , the transverse momentum tensor ollitrault93 (also called ‘azimuthal correlation’ wilson92 ) method or others fai87 .
Among them, the Q-vector method has received special attention. Originally, the Q-vector has been defined as a weighted sum of the transverse momenta of the measured reaction products danielewicz85 :
| (4) |
with the weights chosen to be +(-)1 for reaction products in the forward (backward) c.m. hemisphere and with the possibility to exclude the midrapidity zone. The choice of the optimal weights is discussed in ogilvie89a ; tsang91 ; danielewicz95 ; poskanzer98 ; borghini01 . Definition (4) can be extended to Q-vectors built from higher harmonics poskanzer98 , thus e.g. allowing to profit from strong elliptic flow, when applicable. Usually in the flow studies, the POI is excluded from the sum in (4) to avoid autocorrelations. This does not concern the corrections, since the sub-events (see below) do not share particles.
The corrections for the reaction-plane dispersion can be obtained using various methods danielewicz85 ; danielewicz88 ; ollitrault93 ; ollitrault95 ; voloshin96 ; ollitrault97 ; ollitrault98 ; poskanzer98 ; voloshin99 ; borghini02 . What they all have in common, is the underlying assumption of the applicability of the central-limit theorem. In most of these methods the correction is searched for using the sub-event method danielewicz85 , which consists in splitting randomly each event into two equal-multiplicity sub-events and getting the correction from the distribution of the relative azimuthal angle, , between their individual Q-vectors (‘sub-Q-vectors’). This is done either by using the small angle expansion danielewicz85 or by fitting with a theoretical distribution ollitrault97 . Instead of fitting the angular distributions one can alternatively fit the distributions of the magnitude of the total Q-vector itself voloshin96 ; poskanzer98 .
Assuming the Gaussian limit, ref. ollitrault97 gives an analytical formula for the distribution of for the case that the distributions of sub-Q-vectors are independent and isotropic around their mean values. In refs. voloshin96 ; poskanzer98 one can find the formulae relevant for the distributions of the magnitude of the Q-vector.
These methods proved their usefulness for correcting measured flow values at higher energies (see e.g. danielewicz85 ; barrette94 ; aggarwal97 ; andronic01 ; andronic05 ) which fulfill the high multiplicity requirement. They are, however, not adequate for the intermediate energy reactions, below about MeV, where the particle multiplicities are lower and the events are characterized by a broad range of masses of the reaction products. Here, the applicability of the central limit theorem for devising the corrections is less obvious.
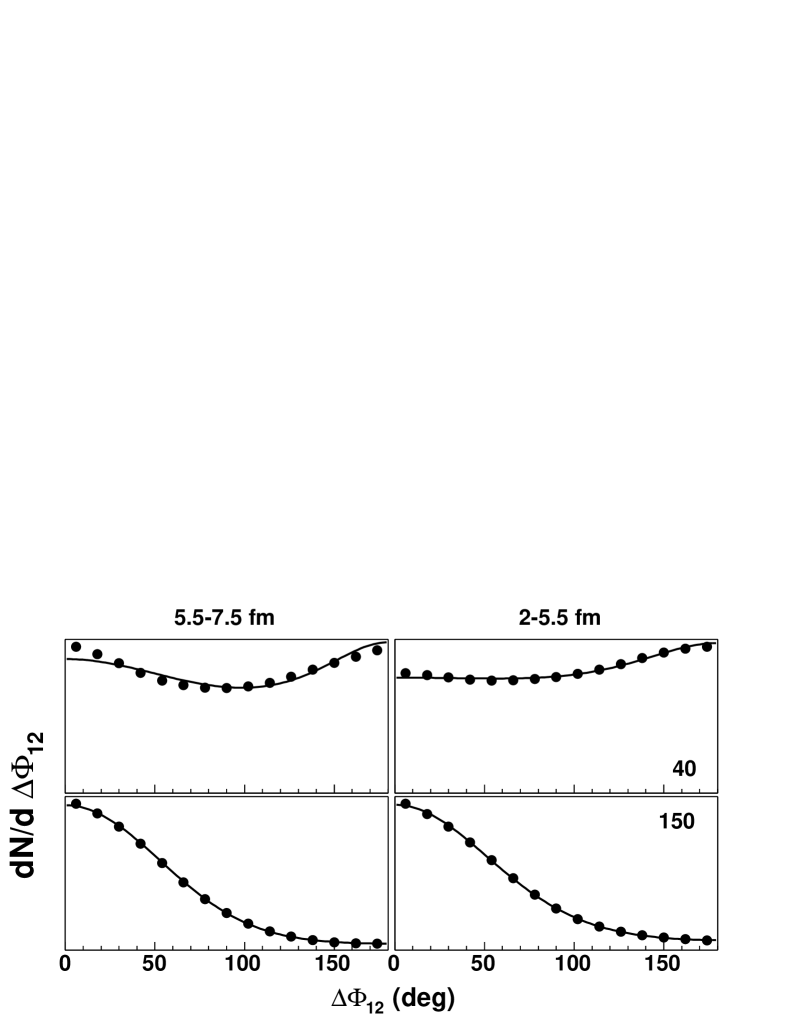
Figure 8 illustrates the difficulties one encounters at intermediate energies. It shows the experimental distributions of as measured with the INDRA detector for the Au+Au reaction at (top) and (bottom) MeV and for two intermediate centrality bins. The lines represent the fits obtained with the method described briefly below. The standard method ollitrault97 can, in principle, be used to derive the corrections for energies down to about MeV, however it fails to describe distributions like those at MeV with double maxima or maxima at backward angles, which reflect the presence and importance of the in-plane enhancement and of the correlation between sub-events.
Since at low and intermediate energies the sub-events are expected to be strongly correlated ollitrault95 and the distributions of the Q-vector no longer necessarily isotropic ollitrault97 , we have extended the method of Ollitrault ollitrault97 by explicitly taking into account these two effects in the theoretical distribution of the sub-Q-vectors. The new method relies on the assumption of the Gaussian distribution of the flow sub-Q-vectors. This assumption has been verified to hold even at MeV, except for very peripheral collisions, by performing tests with the CHIMERA-QMD model in which angular momentum is strictly conserved method .
The form of the joint probability distribution of the random sub-Q-vectors has been searched for following the method outlined in appendix A of borghini02 , by imposing the constraint of momentum conservation on the -particle transverse momentum distribution and using the saddle-point approximation.
The resulting distribution has the form of a product of two bivariate Gaussians:
| (5) |
where we followed the convention of ollitrault97 of including the in ; the subscripts 1, 2 refer individually and s generally to sub-events; the subscripts x and y refer to the in- and out-of-plane direction, respectively. This distribution differs from those proposed in ollitrault97 ; ollitrault95 ; borghini02 in that it combines all three effects that influence the reaction plane dispersion at intermediate energies, namely the directed flow (through the mean in-plane component or the resolution parameter ollitrault97 ), the elliptic flow (through the ratio ) and the correlation between the sub-events ollitrault95 (through the correlation coefficient ). It reduces to the one of ollitrault97 for and , and to the one of borghini02 for . In deriving eq. (5) it was assumed that the in- and out-of-plane correlation coefficients are equal.
Making the division into sub-events random ensures that the distributions of the sub-Q-vectors are equivalent, in particular they have the same mean values and variances. Since the total-Q-vector is the sum of the sub-Q-vectors, , one finds the following relation between the resolution parameter obtained from the distribution of the Q-vector, , and that obtained from the distribution of sub-Q-vectors, :
| (6) |
Relation (6) shows how the correlation between sub-events influences the reaction plane resolution. In particular, it indicates that the resolution improves in case the sub-events are anti-correlated (), which is predicted to be the case below about MeV except for very peripheral collisions method .
As in ollitrault97 , the joint probability distribution (5) is used after integrating it over the magnitudes of the sub-Q-vectors and one angle, leaving the as the only independent variable. Unlike in ollitrault97 , the resulting distribution can not be presented in an analytical form. It depends on 3 parameters () which can be obtained from fits to the experimental or model data. The quality of the obtained fits is very good, even in the non-standard cases encountered at low energies (fig. 8).
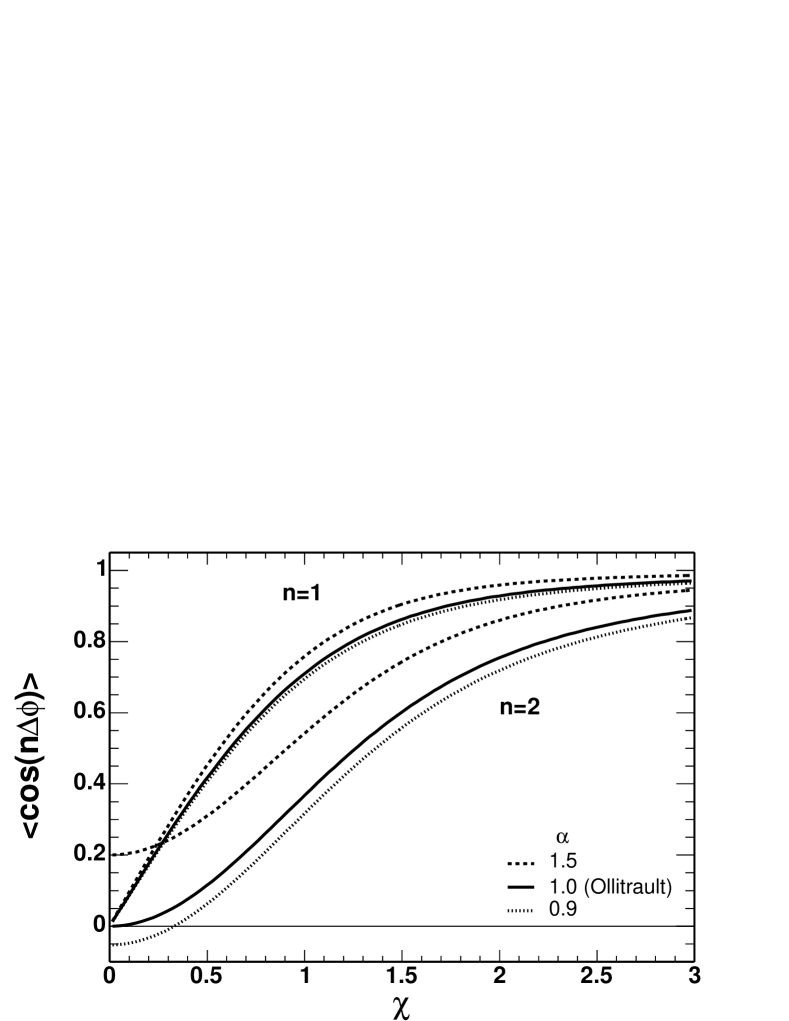
The corrections for the n-th harmonic , depending now on and , can be calculated (also numerically) as the mean values of the obtained over the total-Q-vector distribution, in a similar way as in ollitrault97 . Figure 9 shows how the elongation of the Gaussian (), resulting from elliptic flow, modifies the corrections for the first two harmonics. It demonstrates that the in-plane emissions () enhance slightly the resolution for and considerably for – even in the absence of the directed flow. On the other hand, squeeze-out () deteriorates the resolution. The figure, in particular, shows that the correction can change the sign of elliptic flow in the case of small directed flow and squeeze-out.
Since the correlation between the sub-events increases at the lower energies, the knowledge of the correlation coefficient becomes crucial. Estimated values, obtained from model calculations, can be useful as constraints for in the fitting procedure. For example, the CHIMERA-QMD calculations predict to be around -0.43 for MeV and fm and about -0.2 at MeV. Alternatively, mean values of some rotational invariants which are derived from the measured data can be used to reduce the number of fit parameters and to constrain the fitting routine to search for a conditional minimum method_iwm .
Instead of fitting the azimuthal distributions one can express the probability distribution (5) in terms of the components of one of the sub-Q-vectors in the reference frame of the other, or in terms of the absolute values of the sum and of the difference of the sub-Q-vectors. The corresponding 2-dimensional experimental distributions can then be fit using such formulae. The method of fitting the distributions of components of the sub-Q-vector has been found sensitive enough to perform well without additional constraints.
The corrections obtained using various methods are presented in fig. 10. They are close to one, independent of the method, for the range of higher incident energies ( MeV) where the directed flow is large and the reaction plane well defined by the high-multiplicity distribution of detected particles. At around MeV, they go through a minimum and depend strongly on the chosen method. The FOPI flow results, as published in refs. andronic01 ; andronic05 , have been corrected using the standard method, excluding the midrapidity region of of the scaled c.m. rapidity from the Q-vector to improve the resolution. The corrections used here for the INDRA data are obtained with the new method in two ways, by fitting the azimuthal distributions and by fitting the distributions of components of the sub-Q-vectors. The mean values are given in fig. 10 (full circles) with error bars representing the systematic uncertainty as given by the difference of these results. At MeV, the statistical errors dominate. Even at their minima, the corrections are not smaller than 0.6 and 0.5 for directed and elliptic flow, respectively, indicating that the measured flow values will increase, after applying the corrections, by no more than about a factor of two.
For a comparison of the different methods and of their applicability, also the corrections according to the standard method of Ollitrault ollitrault97 have been determined. This corresponds to fixing the parameters and in the new method. Near MeV, the results are close to zero which would require nearly infinitely large corrections (triangles in fig. 10). The figure, furthermore, shows the same corrections according to the standard method as obtained for the FOPI case (circles). They are very similar and, in the overlap region, virtually identical to the result for INDRA if the limit of the FOPI acceptance is applied in the INDRA case (stars). This very close agreement is not unexpected because good agreement was already observed for the uncorrected flow data obtained with the two detection systems lukasik04 ; lukasik05 ; andronic05 . The standard method, nevertheless, fails below about MeV. As mentioned above, the independent, isotropic Gaussian approximation is no longer confirmed by satisfactory fits of the experimental distributions.
Several additional observations and comments can be made. Comparing the results of the new and standard methods (filled circles and triangles) shows a dramatic improvement of the resolution obtained by taking the effects of the correlation between the sub-events and of the in-plane enhancement into account. It should be stressed, that both these effects are responsible for the finite correction for the directed flow at MeV, near the expected balance energy magestro00 . Non-vanishing resolution, suggested by the new method, indicates that even here the reaction plane can be defined, and apparently, questions the occurrence of the ’global’ balance, which otherwise would manifest itself with the vanishing of . However, the finiteness of the corrections around MeV may also partially result from the incompleteness of the experimental data and from the mixing of events with different centralities, which may add up to mask the signal of the ’global’ balance. The fitting procedure yields relatively accurate results for the corrections for the first two harmonics in case of the complete results of the simulations (e.g. 2-5% accuracy for MeV and 0.2-0.4% for MeV and fm method ), and in particular, is able to reveal the signal of the ’global’ balance, but in the case of experimental data it will certainly return some effective corrections biased by the experimental uncertainties and inefficiencies. The effects of the latter may not necessarily drop out by applying eq. (3) to correct the measured observables, but may require additional corrections. At the higher energies, the results of the standard and the new methods approach each other but, in the overlap region of the FOPI and INDRA experiments, the differences are still significant, and need further investigation.
Comparing the less and the more complete data sets (stars and triangles, respectively) shows that the resolution improves with the completeness of the data. Triangles represent INDRA events with at least 50% of the system charge collected to which an additional single fragment carrying the missing momentum and charge was added. This artificial completion of events was found important for peripheral collisions where, due to the energy thresholds, the heavy target-like fragment is always lost. The distributions of the relative angle between sub-events become then narrowly peaked at small relative angles which improves the resolution of the reaction plane.
However, it is not only the reaction plane correction that relies on the completeness of the measured data. Also the measured parameters are affected by the non-isotropic loss of particles due to multi-hits (INDRA) or unresolved tracks in high-track-density regions (FOPI). A rough estimate of the correction method due to multi-hit losses for can be obtained, for segmented detectors like INDRA, by using the unfolded ’true’ in- and out-of-plane multiplicities and calculating the true and measured mean by integrating the azimuthal distribution (2) over the in- and out-of-plane quadrants. The ’true’ multiplicities can be estimated using the calculated (e.g. in a way similar to that of ref. vanderwerf78 ) or simulated (using the detector filter and the model data) multiplicity response function specific for a given detector. An analogous procedure can be applied also for ; however, due to the lack of the forward-backward center of mass symmetry of the detector, the results may be less accurate. The flow parameters obtained from the INDRA data presented in the next section have been additionally corrected for the multi-hit losses using the above procedure. For , these additional corrections vary from about 7% at MeV to about 33% at higher energies for and do not exceed 15% for . For and they increase from about 18% at MeV to about 36% at MeV and about 70% at MeV, for the centrality bins in question. Within this simple procedure, the corrections depend essentially on the average of the in- and out-of-plane multiplicities and only weakly on their difference, that is why the corrections basically increase with the increasing multiplicity (thus with the centrality and incident energy). This explains the large correction factor at MeV. Nevertheless, since is small at this energy, the absolute change of the measured value due to the correction is small compared to that at lower energies.
Generally, one may remark that, at energies below about MeV, devising the corrections becomes a delicate task. The corrections are no longer those in the usual sense, say, of a few percent. Depending on the method, they may change the measured results by a large factor, mainly because of the smallness of directed flow around MeV. The accuracy relies in addition on the completeness of the data. Flow data free of reaction plane dispersions are, nevertheless, very desirable since they allow to compare the results obtained with different detectors. They are also of great interest from the theoretical point of view, by permitting the direct comparison with the model predictions. In problematic cases, however, detailed filtering of the model results and treating them with the experimental type of analysis may still be necessary, if not for the direct comparison on the level of uncorrected observables, then for the reliable estimate of the systematic uncertainties associated with the correction scheme.
The effects of momentum conservation, distortions due to removal of the particle of interest (expected to be important at low multiplicities (energies)) and possible corrections to the reaction plane resolution due to the detector inefficiencies (missing part of the Q-vector) remain a subject for future study.
6 Directed and elliptic flow
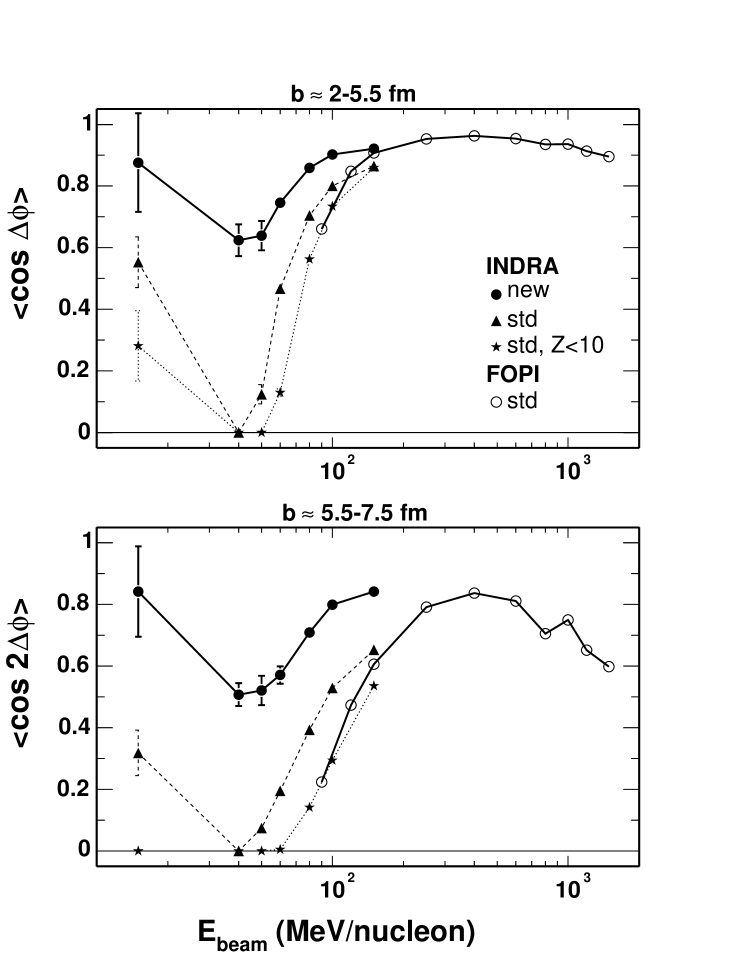
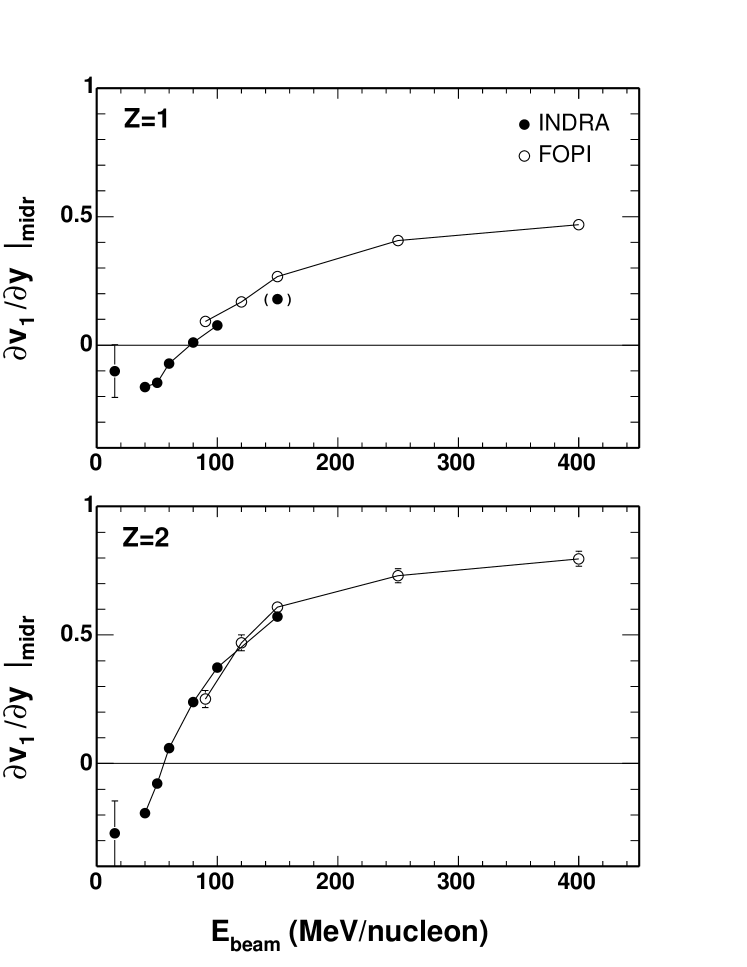
The rapidity dependence of the slope of the directed-flow at midrapidity for and 2 particles, integrated over transverse momentum, is shown in fig. 11. The INDRA data is combined with the FOPI data (published for in andronic01 ), both measured for mid-central collisions with impact parameters of 2–5.5 fm and shown after correcting for the reaction plane dispersion. The FOPI data has been corrected using the method of ollitrault97 while the INDRA data has been corrected using the method outlined in sect. 5. In both data sets the reaction plane has been reconstructed using the Q-vector method with the weights , excluding the POI. In case of the FOPI data the midrapidity region of of the scaled rapidity has been excluded from the Q-vector to improve the resolution. The INDRA data has been corrected for the effects of momentum conservation ogilvie89 . In both cases linear fits have been performed in the range of of the scaled c.m. rapidity, except for the MeV data where the range of was used.
The excitation function of the slope of the directed flow at midrapidity for changes sign around MeV. The apparent minimum around MeV is mostly suggested by the MeV data point and should be confirmed by other measurements. The FOPI data has been additionally corrected for the effects of unresolved tracks in the in-plane high track density region. This correction influences also the slope of the rapidity distribution, increasing it by up to 15% for and up to 5% for . The INDRA results have been corrected for the effect of multi-hit losses (see sect. 5). The still apparent discrepancy between the INDRA and FOPI results at MeV can be partially attributed to the losses of particles due to punch-through effects in the INDRA detector at high energies. Up to 10% of the difference may also come from the different methods used for correcting the reaction plane dispersions (see fig. 10).
For , the slope of is seen to rise monotonically with energy over the full range of 15 to 400 MeV per nucleon which is covered by the two experiments. Here, the agreement in the overlap region is slightly better reflecting the better efficiency of the INDRA detector for particles. The trends observed for the uncorrected data lukasik05 for are preserved. Unlike in ref. magestro00 , the excitation function does not show a clean signature of a minimum (see ref. lukasik05 for discussion). It changes sign between 50 and 60 MeV per nucleon, in agreement with the extrapolated values of the balance energy, , obtained from the higher energy measurements zhang90 ; partlan95 ; crochet97 .
Negative flow is observed not only for (fig. 11) but with even larger slopes also for other light fragments. This intriguing phenomenon has already been reported for the lighter systems 40Ar + 58Ni, 58Ni + 58Ni, and 129Xe + natSn, provided the ‘1-plane-per-particle’ method was used for estimation of the reaction plane cussol02 . For these systems, a balance energy has been determined by associating it with the minima of the approximately parabolic excitation functions of the flow parameter which, in the cases of 40Ar + 58Ni and 58Ni + 58Ni, appeared at negative flow values. Negative flow values of light reaction products can indeed be measured experimentally, provided the detector is able to measure ‘quasi-complete’ events, including the heavy fragments. Then, the observed anti-flow of light products is measurable relative to the reaction plane fixed and oriented by the heavy remnants.
A possible scenario of the anti-flow has been proposed for the lighter systems in cussol02 , and for the heavy systems, emphasizing the role of the strong Coulomb field, in lukasik05 . Despite the appeal of a globally defined balance energy, it is worth noticing that directed flow apparently never vanishes completely. It was shown with BUU calculations that at the balance energy the flow cancellation results from a complex transverse momentum dependence and that the flow pattern is influenced by EoS and li99 . The presently available differential data, measured by FOPI down to 90 AMeV andronic01 suggest that the change of sign of is dependent, in addition to transverse momentum, also on particle type and rapidity.
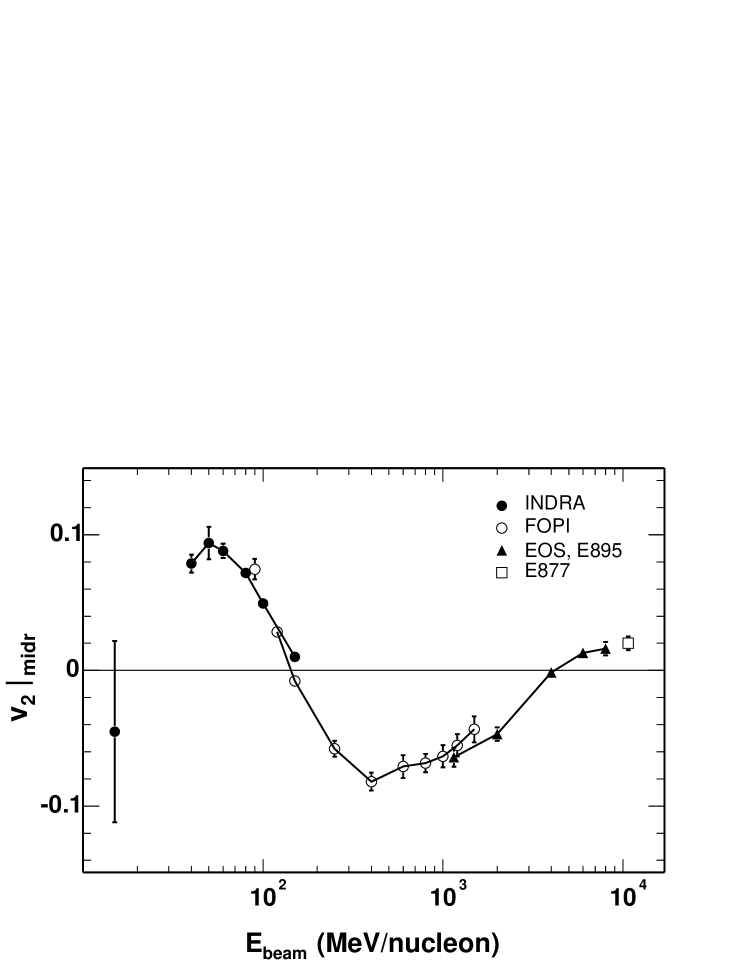
The results on measured at midrapidity are summarized in fig. 12. Elliptic flow varies as a function of energy from a preferential in-plane, rotational-like tsang84 ; wilson90 ; lacey93 , emission () to an out-of-plane, or ‘squeeze-out’ gutbrod90 () pattern, with a transition energy of about MeV. This transition energy is larger than that for the directed flow (see above and the discussion in ref. crochet97 ) and was shown to depend on centrality, particle type and transverse momentum andronic01npa ; andronic05 . For higher energies, the strength of the collective expansion overcomes the rotational-like motion, leading to an increase of out-of-plane emission. A maximum is reached at MeV, followed by a decrease towards a transition to preferential in-plane emission pinkenburg99 ; bmunzinger98 . This behavior is the result of a complex interplay between fireball expansion and spectator shadowing andronic05 , with the spectators acting as clocks of the expansion times. For instance, in the energy range MeV, the passing time of the spectators decreases from 30 to 16 fm/c, implying that overall the expansion gets about two times faster in this energy range. This interpretation is supported by the observed scaling of elliptic flow as a function of transverse momentum scaled with beam momentum andronic05 . We note that the energy dependence of elliptic flow is similar to that of directed flow reisdorf97 ; herrmann99 ; reisdorf04 , with the extra feature of the transition to in-plane flow at GeV pinkenburg99 . This high energy transition has received particular interest as it is expected to provide a sensitive probe of the EOS at high densities danielewicz98 . At SPS and RHIC energies, the in-plane elliptic flow is determined by the pressure gradient-driven expansion of the almond shaped isolated fireball ollitrault92 and is currently under intensive experimental investigation voloshin03 ; retiere04 ; lacey05 .
The agreement between the corrected INDRA and FOPI data is good. The INDRA results have been corrected using the new method, including the correction for the multi-hit losses (see sect. 5). According to IQMD calculations, the reaction plane correction for the lowest FOPI energy of MeV appears to be somewhat overestimated. On the other hand, this may partially compensate for the lack of corrections due to unresolved tracks which were not applied for in the FOPI case. Overall, the differences between the corrections is small enough, so that comparisons of uncorrected data sets are already meaningful. A good agreement was found to exist for the INDRA lukasik04 ; lukasik05 , FOPI andronic05 and Plastic Ball gutbrod90 data in the reference frame of the directed flow and without the correction for reaction plane resolution lukasik04 ; andronic05 .
A remarkable feature of the observable is that it allows to show a continuous evolution over a region covering completely different reaction mechanisms, from those dominated by the mean field near the deep inelastic domain, and the multifragmentation in the Fermi energy domain towards the participant-spectator regime at relativistic energies.
7 Correlation between stopping and flow
Information on stopping and flow in heavy ion collisions represents part of the input to theoretical efforts to deduce constraints on the EoS. Remembering that the EoS is a relation between pressure and density, it is intuitively understandable that these two heavy ion observables are related to the EoS: flow is generated by pressure gradients established in compressed matter, while the achieved density is connected to the degree of stopping. Recently, it was observed reisdorf04 that a strong correlation exists between the stopping, measured in central collisions and the directed flow measured at impact parameters where it is maximal (see fig. 2). The relevant data are shown in fig. 13 in the upper left panel. Plotted against each other are two dimensionless global event observables characterizing stopping, , and global scaled directed flow, , both defined earlier.
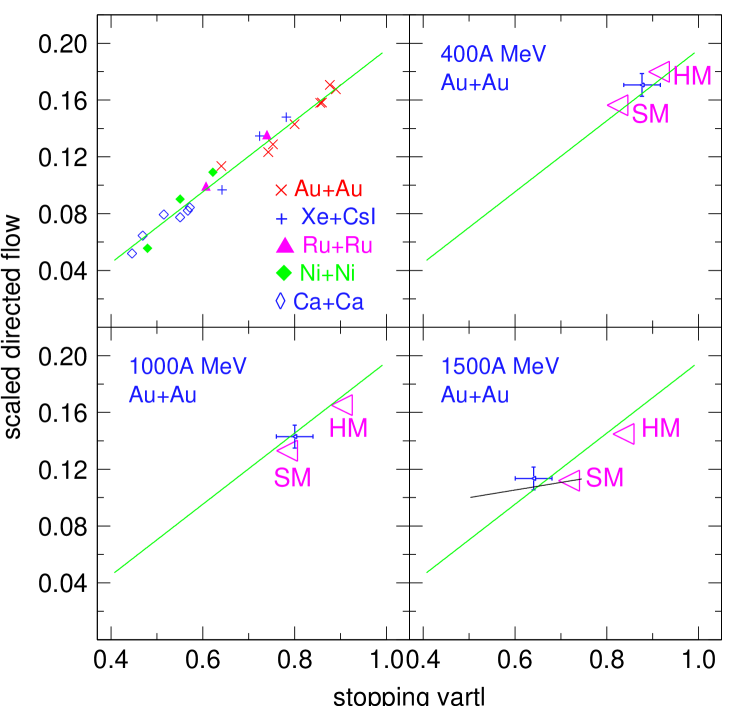
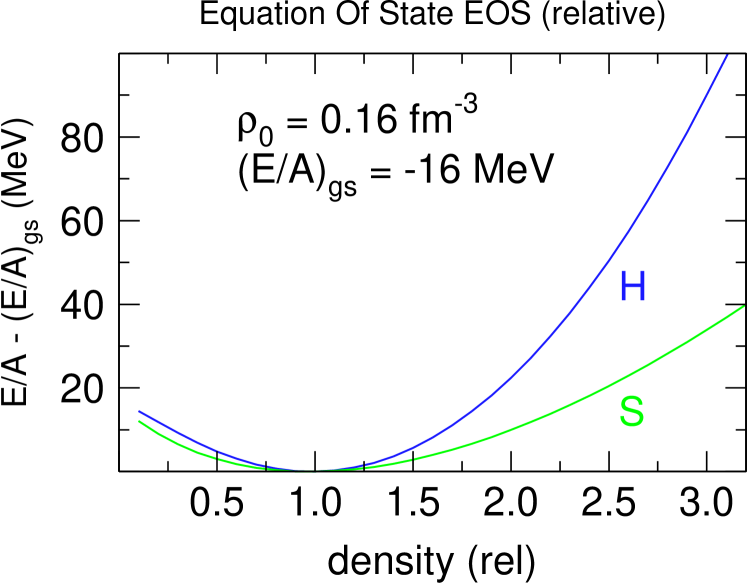
The data points correspond to 21 system-energies with varying system size (from Ca+Ca to Au+Au) and energy (from to MeV). The straight correlation line represents a linear least-squares fit to the data and is repeated in the other panels. These other panels show the location along the correlation line of theoretical simulations using the IQMD code for Au + Au at , and MeV as indicated. The points are marked and , respectively, for a stiff (incompressibility MeV) and a soft ( MeV) EoS. The in and stands for the momentum dependence of the interaction. IQMD incorporates a phenomenological Ansatz fitted to experimental data on the real part of the nucleon optical potential. The relevant experimental points are given together with their estimated systematic errors (these errors were omitted for clarity in the upper left panel, but are of comparable magnitude for all the data). The main purpose is to show the sensitivity of these combined observables to variations of the zero-temperature EoS as compared to the uncertainty of the data. The EoS, that are purely technical, are shown in fig. 14. The trajectory of the simulation when changing seems to follow the correlation line, the distance between and is larger at MeV than at MeV (i. e. the sensitivity is increased at the higher energy), but then does not seem to further increase at the highest energy, possibly due to the increase of transparency suggested by fig. 7. Data measured at energies below MeV do not continue the same linear correlation, an interesting topic that deserves further studies.
In our exploratory IQMD simulations hartnack98 ; leifels we have not tried to be realistic with regard to in-medium modifications of the nucleon nucleon cross sections , using instead the vacuum values standardly implemented in the code hartnack98 . An estimate of the trajectory in the flow versus stopping plot when the EoS is kept constant, but the are decreased is shown in the right hand lower panel of fig. 13. For this estimate we rely on the more sophisticated calculations of ref. gaitanos05 which show that a switch to more realistic smaller decreases the stopping by about and the scaled sideflow by , i.e. acts more strongly, relatively speaking, on the stopping than on the scaled flow, as expected. The modification trajectory crosses the correlation line because it has a different, flatter, slope than the EoS modification trajectory joining the to the point (which is not plotted) which happens to have a slope very similar to that of the experimental correlation line. Generally speaking, one can say that an underestimation of the apparent transparency will lead to an underestimation of the stiffness of the EoS. Nevertheless, the procedure just outlined suggests that an EoS closer to than would seem to be more appropriate to describe the data. The same conclusion was reached from the comparison of the FOPI data on directed flow, including its dependence, to IQMD calculations andronic03 and from the comparison of the out-of-plane expansion to BUU calculations stoicea04 .
Despite this encouraging result we would like to stress at this time that it would be premature to draw firm conclusions from one particular transport code and it is beyond the scope of this experimental contribution to the subject to conclusively settle the question of the EoS. Besides trying to predict correctly the global observables just shown, probably a good strategy to start with, the simulations must then proceed to reproduce the more differential data such as the variations of the stopping and of the various flow components with the particle type, as shown here in figs. 6 and 11, respectively. Another important physics quantity one would like to have under theoretical control, in order to be convincing on the conclusion side, is the created entropy. Although this is not a direct observable, the entropy at freeze-out is strongly constrained by the degree of clusterization (of which we showed an example in fig. 5) and the degree of pionization. An idea of the freeze-out volume can be obtained from two-particle correlations kotte05 , or even multi-particle correlations piantelli05 ; tabacaru06 . All this is a rather challenging task. We refer to the work of Danielewicz, Lacey and Lynch danielewicz02 for a summary of the situation obtained a few years ago using a subset of the then available heavy ion data reaching up to the AGS energies.
8 Summary and outlook
We have presented a systematics of directed and elliptic flow and of stopping for 197Au + 197Au reactions in the intermediate range of energies from 40 to 1500 MeV per nucleon by merging the data from INDRA and FOPI experiments performed at the SIS synchrotron at GSI. The overlap region of the two data sets, 90 to 150 MeV per nucleon incident energy, has been used to confirm their accuracy on an absolute scale, and a very satisfactory agreement has been found.
Particular emphasis was given to the experimental reconstruction of the impact parameter and to the corrections required by the dispersion of the reconstructed azimuthal orientation of the reaction plane. The superiority of observables based on transverse energy, either the ratio of transverse to longitudinal energy or the transverse energy of light charged particles with , over multiplicity for the selection of central collisions has been demonstrated. A new method, derived by extending the Gaussian approximation of the sub--vector distributions to the non-isotropic case and by including the effect of correlation between the sub-events, has been presented and applied to the data at the lower incident energies at which the multiplicities are still moderate and the range of emitted fragment is still large, even in the most central collisions. The differences between the standard and the new corrections of derived flow parameters are significant up to incident energies as high as 150 MeV per nucleon.
The deduced excitation functions of the and observables describing directed and elliptic flow exhibit several changes of sign which reflect qualitative changes of the underlying dynamics as a function of the bombarding energy. The transition from mean-field dominated attractive sidewards flow to repulsive dynamics is observed for and particles at 80 MeV and 60 MeV per nucleon, respectively, in mid-central collisions. The transition from predominantly in-plane to out-of-plane emissions occurs at 150 MeV per nucleon for particles. The second change-of-sign at several GeV per nucleon marks the transition to the ultrarelativistic regime. These transition points are quite well established and not very sensitive to the chosen correction method. The present study shows that also the maxima reached by the flow parameters are reliable within the typically 5% systematic uncertainties due to the corrections and the impact parameter selection. Within this margin they may be used to test transport-model predictions and their sensitivity to the chosen parameterization of the nuclear EoS.
It has, furthermore, been shown that the significance of the comparison can be enhanced by including the experimentally observed stopping as represented by the ratio of the variances of the integrated transverse and longitudinal rapidity distributions. This observable can best be determined for central collisions at which the directional flow vanishes for symmetry reasons whereas the compression in the collision zone presumably reaches its maximum. The common origin of the observed stopping and flow is evident from the strict correlation of the two observables, including finite size effects. However, their individual sensitivity to the magnitude of the nucleon-nucleon cross sections and to the flow parameters is different and can be used to resolve ambiguities between these two main ingredients of the models. The sensitivity to parameters of the equation of state is shown to increase with bombarding energy over the present energy range, and a soft EoS is clearly favored by the data.
Further constraints for the determination of the parameters of the equation of state can be obtained by including the detailed dependences of flow on the fragment , the impact parameter and the accepted ranges of transverse momentum and rapidity into the comparison with theory. These data, for the present reactions, are either available already or in preparation. This will have to be accompanied by theoretical studies of the still existing systematic differences between specific code realizations. The importance or necessity of full antisymmetrization at low energies or of a covariant treatment at high bombarding energies and the role of nucleonic excitations will have to be assessed.
On the experimental side, a gap of missing flow data for the Au+Au system exists at energies below 40 MeV per nucleon where interesting information on transport coefficients as, e.g., shear versus bulk viscosity or thermal conductivity may be obtained. The origin of the observed negative flow should be confirmed and clarified. At higher energies, new information, possibly also on the symmetry part of the equation of state, can be expected from new experiments involving isotopically pure projectiles and targets and detector systems permitting mass identification at midrapidity.
Acknowledgements.
The authors would like to thank Y. Leifels for the implementation of the IQMD code at GSI, the FOPI and INDRA-ALADIN Collaborations for the permission to include partially unpublished data in this comparative study, and J.-Y. Ollitrault for stimulating discussions on flow evaluation and corrections.References
- (1) W. Reisdorf and H.G. Ritter, Annu. Rev. Nucl. Part. Sci. 47, (1997) 663.
- (2) N. Herrmann et al., Annu. Rev. Nucl. Part. Sci. 49, (1999) 581.
- (3) H. Stöcker and W. Greiner, Phys. Rep. 137, (1986) 277.
- (4) P. Danielewicz, Nucl. Phys. A 673, (2000) 375.
- (5) P. Danielewicz et al., Science 298, (2002) 1592.
- (6) C. Fuchs and H.H. Wolter, ’Modelization of the EOS’, contribution to this volume.
- (7) W. Reisdorf et al., Phys. Rev. Lett. 92, (2004) 232301.
- (8) R.C. Lemmon et al., Phys. Lett. B 446, (1999) 197.
- (9) M.M. Htun et al., Phys. Rev. C 59, (1999) 336.
- (10) E.P. Prendergast et al., Phys. Rev. C 61, (2000) 024611.
- (11) D.J. Magestro et al., Phys. Rev. C 62, (2000) 041603(R).
- (12) P. Crochet et al., Phys. Lett. B 486, (2000) 6.
- (13) P. Crochet et al., J. Phys. G 27, (2001) 267.
- (14) A. Devismes et al., J. Phys. G 28, (2002) 1591.
- (15) F. Uhlig et al., Phys. Rev. Lett. 95, (2005) 012301.
- (16) G.D. Westfall, Nucl. Phys. A 681, (2001) 343c.
- (17) H. Liu et al., Phys. Rev. Lett. 84, (2000) 5488.
- (18) A. Andronic et al., Phys. Rev. C 64, (2001) 041604.
- (19) A. Andronic et al., Phys. Rev. C 67, (2003) 034907.
- (20) D.J. Magestro et al., Phys. Rev. C 61, (2000) 021602.
- (21) D. Cussol et al., Phys. Rev. C 65, (2002) 044604.
- (22) J. Łukasik et al., Phys. Lett. B 608, (2005) 223.
- (23) N.N. Abd-Allah, J. Phys. Soc. Jpn. 69, (2000) 1068.
- (24) L. Chkhaidze et al., Phys. Lett. B 479, (2001) 21.
- (25) L.J. Simić and J. Milošević, J. Phys. G 27, (2001) 183.
- (26) N. Bastid et al., Nucl. Phys. A 742, (2004) 29.
- (27) N. Bastid et al., Phys. Rev. C 72, (2005) 011901.
- (28) A. Andronic et al., Phys. Lett. B 612, (2005) 173.
- (29) C. Pinkenburg et al., Phys. Rev. Lett. 83, (1999) 1295.
- (30) A. Andronic et al., Nucl. Phys. A 679, (2001) 765.
- (31) P. Chung et al., Phys. Rev. C 66, (2002) 021901(R).
- (32) G. Stoicea et al., Phys. Rev. Lett. 92, (2004) 072303.
- (33) J. Łukasik et al., Prog. Part. Nucl. Phys. 53, (2004) 77.
- (34) K.G.R. Doss et al., Phys. Rev. Lett. 57, (1986) 302.
- (35) K.G.R. Doss et al., Phys. Rev. Lett. 59, (1987) 2720.
- (36) H.H. Gutbrod et al., Rep. Prog. Phys. 52, (1989) 1267.
- (37) H.H. Gutbrod et al., Phys. Rev. C 42, (1990) 640.
- (38) M.B. Tsang et al., Phys. Rev. Lett. 71, (1993) 1502.
- (39) W.C. Hsi Phys. Rev. Lett. 73, (1994) 3367.
- (40) M.B. Tsang et al., Phys. Rev. C 53, (1996) 1959.
- (41) Y. Leifels et al., Phys. Rev. Lett. 71, (1993) 963.
- (42) M.D. Partlan et al., Phys. Rev. Lett. 75, (1995) 2100.
- (43) M. D’Agostino et al., Phys. Rev. Lett. 75, (1995) 4373.
- (44) M. D’Agostino et al., Phy. Lett. B 371, (1996) 175.
- (45) A. Le Fèvre et al., Nucl. Phys. A 735, (2004) 219.
- (46) A. Pagano, private comm.; see also Proceedings of the International Workshop on Multifragmentation IWM2005, Catania, Italy, 2005, ed. by R. Bougault et al., (Italian Physical Society, Bologna 2006), Conf. Proc. Vol. 91.
- (47) J. Pouthas et al., Nucl. Instrum. Methods Phys. Res. A 357, (1995) 418.
- (48) J. Łukasik et al., Phys. Rev. C 66, (2002) 064606.
- (49) A. Trzciński et al., Nucl. Instrum. Methods Phys. Res. A 501, (2003) 367.
- (50) A. Gobbi et al., Nucl. Instrum. Methods A 324, (1993) 156.
- (51) J. Ritman et al., Nucl. Phys. B (Proc. Suppl.) 44, (1995) 708.
- (52) C. Cavata et al., Phys. Rev. C 42, (1990) 1760.
- (53) J. Gosset et al., Phys. Rev. C 16, (1977) 629.
- (54) K.G.R. Doss et al., Phys. Rev. C 32, (1985) 116.
- (55) L. Phair et al., Nucl. Phys. A 548, (1992) 489.
- (56) R. Pak et al., Phys. Rev. C 53, (1996) R1469.
- (57) J. Łukasik et al., Phys. Rev. C 55, (1997) 1906.
- (58) C. Kuhn et al., Phys. Rev. C 48, (1993) 1232.
- (59) W. Reisdorf et al., Nucl. Phys. A 612, (1997) 493.
- (60) H. Ströbele et al., Phys. Rev. C 27, (1983) 1349.
- (61) Y. Larochelle et al., Phys. Rev. C 53, (1996) 823.
- (62) P. Beckmann et al., Mod. Phys. Lett A 2, (1987) 163.
- (63) R. Bock et al., Mod. Phys. Lett A 2, (1987) 721.
- (64) J.P. Alard et al., Phys. Rev. Lett. 69, (1992) 889.
- (65) L. Phair et al., Nucl. Phys. A 564, (1993) 453.
- (66) G. Bertsch and A.A. Amsden, Phys. Rev. C 18, (1978) 1293.
- (67) J. Cugnon and D. L’Hôte, Nucl. Phys. A 397, (1983) 519.
- (68) T.C. Awes et al., Phys. Rev. C 24, (1981) 89.
- (69) R.J. Charity et al., Z. Phys. A 341, (1991) 53.
- (70) S. Piantelli et al., Phys. Rev. Lett. 88, (2002) 052701.
- (71) J. Pèter et al., Nucl. Phys. A 519, (1990) 611.
- (72) C.A. Ogilvie et al., Phys. Rev. C 40, (1989) 654.
- (73) J. Hubele et al., Z. Phys. A 340, (1991) 263.
- (74) A. Schüttauf et al., Nucl. Phys. A 607, (1996) 457.
- (75) W. Bauer, Phys. Rev. Lett. 61, (1988) 2534.
- (76) G. Hanson et al., Phys. Rev. Lett. 35, (1975) 1609.
- (77) S. Brandt and H.D. Dahmen, Z. Phys. C 1, (1979) 61.
- (78) M. Gyulassy et al., Phys. Lett. B 110, (1982) 185.
- (79) P. Danielewicz and M. Gyulassy, Phys. Lett. B 129, (1983) 283.
- (80) G. Buchwald et al., Phys. Rev. 28, (1983) 2349.
- (81) S.L. Wu and G. Zobernig, Z. Phys. C 2, (1979) 107.
- (82) J. Cugnon et al., Phys. Lett. B 109, (1982) 167.
- (83) E. Farhi, Phys. Rev. Lett. 39, (1977) 1587.
- (84) J. Kapusta and D. Strottman, Phys. Lett. B 106, (1981) 33.
- (85) G. Buchwald et al., Phys. Rev. C 24, (1981) 135.
- (86) J.D. Frankland et al., Nucl. Phys. A 689, (2001) 905.
- (87) J.F. Lecolley et al., Phys. Lett. B 387, (1996) 460.
- (88) G.C. Fox and S. Wolfram, Phys. Rev. Lett. 41, (1978) 1581.
- (89) G.C. Fox and S. Wolfram, Phys. Lett. B 82, (1979) 134.
- (90) P. Pawłowski et al., Z. Phys. A 357, (1997) 387.
- (91) P. Désesquelles, Ann. Phys. Fr. 20, (1995) 1.
- (92) P. Désesquelles et al., Phys. Rev. C 62, (2000) 024614.
- (93) E. Geraci et al., Nucl. Phys. A 734, (2004) 524.
- (94) S.A. Bass et al., J. Phys. G 20, (1994) L21.
- (95) C. David et al., Phys. Rev. C 51, (1995) 1453.
- (96) F. Haddad et al., Phys. Rev. C 55, (1997) 1371.
- (97) C. Hartnack et al., Eur. Phys. J. A 1, (1998) 151.
- (98) P. Danielewicz and G. Odyniec, Phys. Lett. B 157, (1985) 146.
- (99) E. Plagnol et al., Phys. Rev. C 61, (2000) 014606.
- (100) W. Reisdorf et al., Phys. Lett. B 595, (2004) 118.
- (101) K. Zbiri et al., preprint nucl-th/0607012.
- (102) T. Gaitanos et al., Phys. Lett. B 609, (2005) 241.
- (103) R. Brockmann et al., Phys. Rev. C 42, (1990) 1965.
- (104) E.N.E. van Dalen et al., Phys. Rev. Lett. 95, (2005) 022302.
- (105) A. Mishra et al., Phys. Rev. C 69, (2004) 024903.
- (106) R. Malfliet et al., Prog. Part. Nucl. Phys. 21, (1988) 207.
- (107) C. Fuchs et al., Phys. Rev C 64, (2001) 024003.
- (108) A.B. Larionov and U. Mosel, Nucl. Phys. A 728, (2003) 135.
- (109) FOPI Collaboration, to be published.
- (110) H.H. Gutbrod et al., Phys. Lett. B 216, (1989) 267.
- (111) M. Demoulins et al., Phys. Lett. B 241, (1990) 476.
- (112) S. Voloshin and Y. Zhang, Z. Phys. C 70, (1996) 665.
- (113) J.-Y. Ollitrault, preprint nucl-ex/9711003.
- (114) A.M. Poskanzer and S.A. Voloshin, Phys. Rev. C 58, (1998) 1671.
- (115) S. Wang et al., Phys. Rev. C 44, (1991) 1091.
- (116) N. Borghini et al., Phys. Rev. C 64, (2001) 054901.
- (117) N. Borghini et al., Phys. Rev. C 63, (2001) 054906.
- (118) N. Borghini et al., Phys. Rev. C 66, (2002) 014905.
- (119) R.S. Bhalerao et al., Nucl. Phys. A 727, (2003) 373.
- (120) R.S. Bhalerao et al., Phys. Lett. B 580, (2004) 157.
- (121) N. Borghini et al., Phys. Rev. C 66, (2002) 014901.
- (122) M.B. Tsang et al., Phys. Rev. Lett. 52, (1984) 1967.
- (123) J.-Y. Ollitrault, Phys. Rev. D 48, (1993) 1132.
- (124) W.K. Wilson et al., Phys. Rev. C 45, (1992) 738.
- (125) G. Fai et al. Phys. Rev. C 36, (1987) 597.
- (126) M.B. Tsang et al., Phys. Rev. C 44, (1991) 2065.
- (127) P. Danielewicz, Phys. Rev. C 51, (1995) 716.
- (128) P. Danielewicz et al., Phys. Rev. C 38, (1988) 120.
- (129) J.-Y. Ollitrault, Nucl. Phys. A 590, (1995) 561c.
- (130) J.-Y. Ollitrault, Nucl. Phys. A 638, (1998) 195c.
- (131) S.A. Voloshin et al., Phys. Rev. C 60, (1999) 024901.
- (132) J. Barrette et al., Phys. Rev. Lett. 73, (1994) 2532.
- (133) M.M. Aggarwal et al., Phys. Lett. B 403, (1997) 390.
- (134) J. Łukasik et al. in preparation.
- (135) J. Łukasik and W. Trautmann, in Proceedings of the International Workshop on Multifragmentation IWM2005, Catania, Italy, 2005, ed. by R. Bougault et al., (Italian Physical Society, Bologna 2006), Conf. Proc. Vol. 91, p. 387; preprint nucl-ex/0603028.
- (136) S.Y. van der Werf, Nucl. Instr. Meth. 153, (1978) 221.
- (137) C.A. Ogilvie et al., Phys. Rev. C 40, (1989) 2592.
- (138) W.M. Zhang et al., Phys. Rev. C 42, (1990) 491.
- (139) P. Crochet et al., Nucl. Phys. A 624, (1997) 755.
- (140) B.-A. Li and A.T. Sustich, Phys. Rev. Lett. 82, (1999) 5004.
- (141) P. Braun-Munzinger and J. Stachel, Nucl. Phys. A 638, (1998) 3c.
- (142) M.B. Tsang et al., Phys. Lett. B 148, (1984) 265.
- (143) W.K. Wilson et al., Phys. Rev. C 41, (1990) R1881.
- (144) R.A. Lacey et al., Phys. Rev. Lett. 70, (1993) 1224.
- (145) J.-Y. Ollitrault, Phys. Rev. D 46, (1992) 229.
- (146) S.A. Voloshin, Nucl. Phys. A 715, (2003) 379 .
- (147) F. Retière, J. Phys. G 30, (2004) S827.
- (148) R.A. Lacey, in Proceedings of Quark Matter 2005, Budapest, Hungary, 2005; preprint nucl-ex/0510029.
- (149) P. Danielewicz et al., Phys. Rev. Lett. 81, (1998) 2438.
- (150) The code IQMD was implemented at GSI by Y. Leifels (FOPI Collaboration), more results will be published elsewhere.
- (151) R. Kotte et al., Eur. Phys. J. A 23, (2005) 271.
- (152) S. Piantelli et al., Phys. Lett. B 627, (2005) 18.
- (153) G. Tabacaru et al., Nucl. Phys. A 764, (2006) 371.