Measurement of photons via conversion pairs in = 200 GeV AuAu collisions with the PHENIX experiment at RHIC
Abstract
Thermal photons can provide information on the temperature of the new state of matter created at RHIC. In the region of 1–3 GeV/c thermal photons are expected to be the dominant direct photon source. Therefore, a possible excess compared to a pure decay photon signal due to a thermal photon contribution should be seen in the double ratio , if sufficient accuracy can be reached. We present a method to reconstruct direct photons by measuring e+e-–pairs from external photon conversions.
1 Introduction
Direct photons are produced during all stages of heavy ion collisions at the Relativistic Heavy Ion Collider (RHIC). Because they do not interact strongly, they escape the medium unaffected by final state interactions and provide a promising signature of the earliest and hottest stage of the quark-gluon plasma (QGP) Turbide:2003si .
On a microscopic level, the main sources of direct photons from a QGP are quark-gluon Compton scattering (), quark-antiquark annihilation () and bremsstrahlung involving thermalized partons Aurenche:1998nw . Direct photons are also produced in initial hard scattering processes which involve the same reactions but among the incoming particles.
At RHIC energies thermal photons are predicted to be the dominant source of direct photons in a window between 1–3 GeV/c Turbide:2003si .
Direct photons have been measured with PHENIX in collisions at GeV Adler:2005ig . The inclusive photon spectra measured with the Electromagnetic Calorimeter (EMC) have been compared to the expected background from hadronic sources, based on the measured and spectra and a cocktail of other hadronic decays (, , ), assuming scaling.
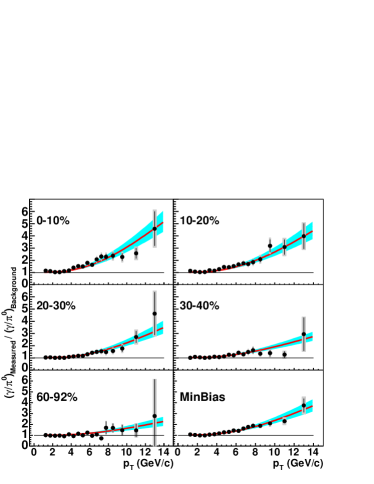
Fig. 1 shows the double ratio of the measured invariant yield ratio to the background decay ratio as a function of for minimum bias and for five centrality classes. The measurement of direct photons production at high scales with the number of binary collisions in agreement with NLO perturbative QCD predictions and therefore confirms medium effects as the origin of jet suppression. In the low region, where a thermal signature is expected, a significant measurement remains limited by systematic uncertainties due to the energy resolution and the photon identification with the EMC.
In order to overcome such limitations, dielectron pairs offer some advantages because of the superior resolution of charged particles at low momenta and excellent identification of conversion photons; while other methods Bathe:2005nz try to use low mass dielectron pairs from internal conversions, the method presented here uses real photon conversions in the beam pipe.
2 Thermal photon analysis
The excellent capabilities of the PHENIX detector to measure electrons suggest to circumvent the limitations of the conventional direct photon measurement Adler:2005ig at low photon energies by measuring photons via their conversion pairs. The momentum resolution () of the charged tracking devices proves superior to the energy resolution of the EMC () in the region of interest (1–3 GeV/c).
Two steps are used to identify e+e-–pairs from photon conversions. First a single electron identification cut is applied, which require signals from at least two phototubes in the Ring Imaging Cherenkov Detector (RICH) matching to a reconstructed charged track in the Drift Chamber (DC). No further electron identification cuts were applied since the pair cuts (see Sect. 2.1) to separate conversion photons from other e+e-–pairs are more efficient and powerful enough to provide a very clean photon conversion sample.
The extracted photon conversions are tagged with photons reconstructed in the EMC to determine the contribution from decays (see Sect. 2.2).
All yields are measured as a function of of the e+e-–pair, which makes a direct comparison of the inclusive photon yield, , and the tagged photon yield, , possible:
| (1) | |||||
| (2) |
The measured yield of inclusive photons depends on the reconstruction efficiency and the PHENIX acceptance of the conversion e+e-–pair . The tagged photon yield depends in addition on the efficiency to reconstruct the second photon in the EMC and on the conditional probability to find it in the EMC acceptance, given that the e+e-–pair has been reconstructed already. Here , as well as all other yields and correction factors, are determined as a function of the of the –pair. Therefore, in a ratio of inclusive conversion photons to conversion photons which have been tagged as decay products, the e+e-–pair reconstruction efficiency and acceptance correction factor cancel.
A ratio of the hadronic decay photon yield, , and the tagged photon yield from decays, , is calculated with simulations, for which again the acceptance correction cancels.
| (3) | |||||
| (4) |
The comparison of the ratio in data and in simulations in a double ratio leads to an expression that is equivalent to the ratio of inclusive and decay photons as shown in Eq. (5). In here also the conditional probability of finding the second photon in the PHENIX acceptance, once the e+e-–pair is already reconstructed, cancels.
| (5) |
The only remaining factor is the reconstruction efficiency of the photon in the EMC, , which has been determined with Monte Carlo simulations to be, independent of the pair- , .
2.1 Photon Conversions
Since the PHENIX tracking algorithm assumes the track to originate from the collision vertex, off-vertex conversion pairs are reconstructed with an artificial opening angle which leads to an invariant mass that is proportional to the radius at which the conversion occurs.
Therefore, photon conversions that occur in the beam pipe material (Be, radiation length) at a radius of 4 cm are reconstructed with an invariant mass of . Fig. 2 shows an invariant mass spectrum of e+e-–pairs in the range 0–0.1 GeV/c2. The peak from photon conversions in the beam pipe at 20 MeV/c2 can be clearly separated from Dalitz decays , which dominate the spectrum below 10 MeV/c2, and combinatorial background pairs, whose contribution increases toward higher invariant masses.
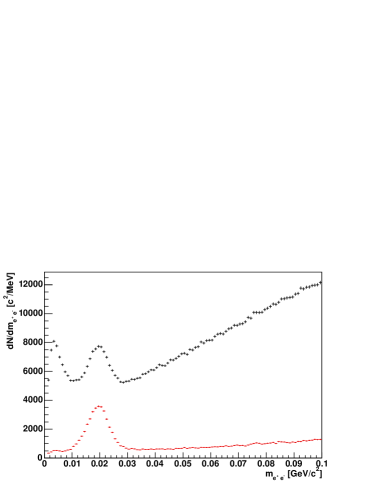
The photon conversion pairs can be distinguished from Dalitz decays and purely combinatorial pairs by cutting on the orientation of the e+e-–pair in the magnetic field. The magnetic field inside PHENIX is parallel to the beam axis. Therefore conversion pairs, which have no intrinsic opening angle, are bent only in the azimuthal direction (i.e. perpendicular to the direction of the magnetic field). In contrast, the opening angle of Dalitz pairs and combinatorial pairs can have any opening angle with respect to the magnetic field. Furthermore, the azimuthal opening angle of conversion pairs will always have the same sign, if one considers the ordered difference:
| (6) |
Fig. 2 shows the invariant mass spectra of e+e-–pairs before (black) and after (red) applying these pair cuts. The yield from integrating the mass region of the conversion peak is corrected for the remaining independent contamination of from combinatorial e+e-–pairs which has been determined with mixed events (see black line in Fig. 3). This leads to , the total yield of conversion photons as a function of .
2.2 Tagging of Decay Photons
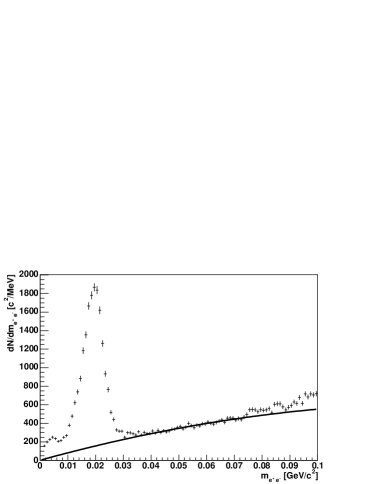
To reveal which of these conversion photons come from decays, the e+e-–pairs in the conversion peak are combined with photons which have been measured in the EMC and their invariant mass is calculated (see Fig. 4). Conversion photons that are identified as decay products of can be tagged as . This signal has a large combinatorial background due to the high photon multiplicity in collisions.
The combinatorial background is reproduced with an event mixing method, which creates uncorrelated pairs of photons and e+e-–pairs from different events. The mixed event spectra is normalized to the same event invariant mass spectra well outside the mass region and subtracted. The normalization factor is calculated as:
| (7) |
with () indicating the yield in the foreground (background) in the mass region 0–100 MeV/c2 and () the region 170–250 MeV/c2.
The normalization factor has a relative statistical error on the order of which depends only on the size of the normalization region in the foreground:
| (8) |
As an example, the resulting signal for e+e-–pairs with GeV/c is shown in Fig. 5.
Mean and are determined by a fit of the background subtracted data with a Gaussian. For comparison the data are also fitted to the sum of a second order polynomial and a Gaussian, to take into account the possibility that the shape is not completely described by the mixed event spectrum. The difference in the resulting mean and is negligible. The mean and obtained by the fit are then used to integrate the data in a region around the mean. The integration region has been chosen to optimize the signal to background ratio.
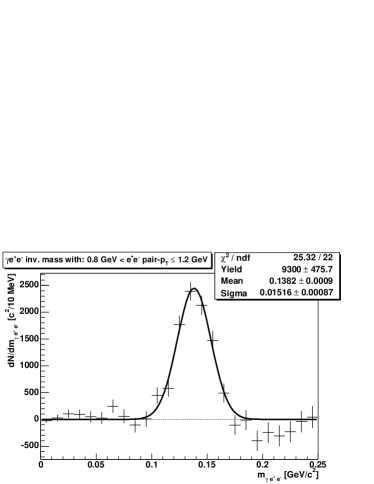
The statistical error on the extracted signal is given by:
| (9) |
With and being the yields in bin of invariant mass spectrum in same events and normalized mixed events, respectively, the summations are performed over the integration region. It is important to note that the last term in Eq. (9), is the square of the sum over the normalized background, and therefore, depends on the integration region and is not bin independent. The systematic errors on the peak extraction have not been evaluated yet.
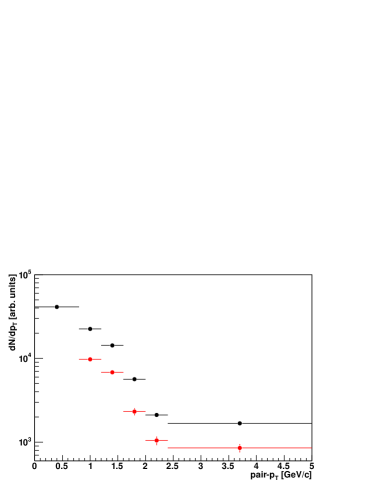
In Fig. 6 the yield, , as a function of pair- is compared to the distribution of all conversion photons . Due to the limited PHENIX acceptance, triplets can not be reconstructed for e+e-–pairs with GeV/c.
2.3 Simulations
The contribution of hadronic decays has been determined with a fast Monte Carlo simulation of and Dalitz decays. A parameterization of the spectrum measured by PHENIX Adler:2003qi has been used as input. The distribution has been generated assuming scaling () of the spectral shape and a normalization at high to , which is in agreement with PHENIX data Adler:2006hu ; Adler:2004ta .
In the region of interest, e+e-–pairs from Dalitz decays and from photon conversions have the same shape, which allows to circumvent a full Monte Carlo simulation of photon conversions in PHENIX, which would be a cumbersome process due to the low conversion probability of in the beam pipe.
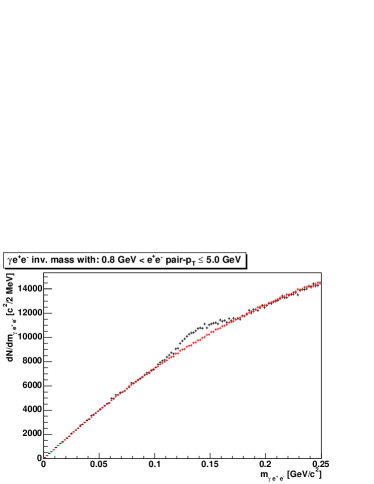
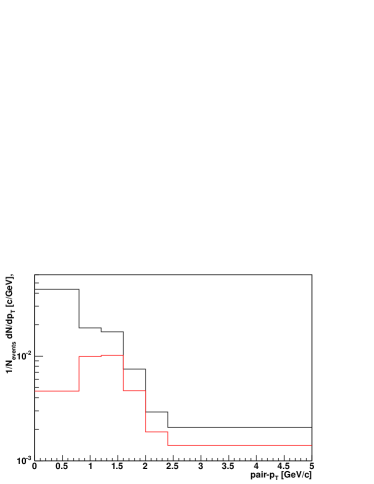
In order to produce inclusive and tagged photon yields comparable to the data, all particles (, and ) have been filtered into the PHENIX acceptance. Fig. 7 shows , the distribution of all e+e-–pairs from hadronic sources, and , the e+e-–pairs which originated from decays.
3 Conclusions
While a result can not be presented yet, the method introduced in here seems promising to find a signature of thermal photons in the low region as an excess in the double ratio as shown in Eq. (5). A detailed understanding of the combinatorial background in the invariant mass spectra of –triplets which is currently the major source of systematic uncertainties will reduce the systematic errors significantly.
References
- (1) S. Turbide, R. Rapp and C. Gale, Phys. Rev. C 69 (2004) 014903 [arXiv:hep-ph/0308085].
- (2) P. Aurenche, F. Gelis, R. Kobes and H. Zaraket, Phys. Rev. D 58 (1998) 085003 [arXiv:hep-ph/9804224].
- (3) S. S. Adler et al. [PHENIX Collaboration], Phys. Rev. Lett. 94 (2005) 232301 [arXiv:nucl-ex/0503003].
- (4) S. Bathe [PHENIX Collaboration], arXiv:nucl-ex/0511042.
- (5) S. S. Adler et al. [PHENIX Collaboration], Phys. Rev. Lett. 91 (2003) 072301 [arXiv:nucl-ex/0304022].
- (6) S. S. Adler et al. [PHENIX Collaboration], Phys. Rev. Lett. 96 (2006) 202301 [arXiv:nucl-ex/0601037].
- (7) S. S. Adler et al. [PHENIX Collaboration], Phys. Rev. Lett. 94 (2005) 082301 [arXiv:nucl-ex/0409028].