The NPDGamma Collaboration
Upper Bounds on Parity Violating Gamma-Ray Asymmetries in Compound Nuclei from Polarized Cold Neutron Capture.
Abstract
Parity-odd asymmetries in the electromagnetic decays of compound nuclei can sometimes be amplified above values expected from simple dimensional estimates by the complexity of compound nuclear states. In this work we use a statistical approach to estimate the root mean square (RMS) of the distribution of expected parity-odd correlations , where is the neutron spin and is the momentum of the gamma, in the integrated gamma spectrum from the capture of cold polarized neutrons on Al, Cu, and In and we present measurements of the asymmetries in these and other nuclei. Based on our calculations, large enhancements of asymmetries were not predicted for the studied nuclei and the statistical estimates are consistent with our measured upper bounds on the asymmetries.
pacs:
11.30.Er, 24.70.+s, 13.75.Cs, 07.85.-m, 25.40.LwI Introduction
One might assume that a quantitative treatment of symmetry breaking in neutron reactions with heavy nuclei would not be feasible. However, theoretical approaches exist which exploit the large number of essentially unknown coefficients in the Fock space expansion of complicated compound nuclear states in heavy nuclei to perform calculations that can be compared to experiment. If we assume that it is possible to treat the Fock space components of the states as independent random variables, one can devise statistical techniques to calculate, not the value of a particular observable, but the root mean square of the distribution of expected values. This strategy has been used successfully to understand certain global features of nuclear structure and reactions bb:WONG . The distribution of energy spacings and neutron resonance widths, for example, has been known for a long time to obey a Porter-Thomas distribution pp:Porter65 in agreement with the predictions of random matrix theory, and statistical approaches have been used to understand isospin violation in heavy nuclei pp:Harney86 .
The complexity of the compound nuclear states can also amplify the size of the parity-odd asymmetries by several orders of magnitude relative to single-particle estimates. This large amplification makes it practical to use nuclear parity violation, generically expected on dimensional grounds to possess amplitudes seven orders of magnitude smaller than strong interaction amplitudes, as a new setting to investigate the validity of these statistically-based theoretical approaches. Statistical analyses have successfully been applied recently to an extensive series of measurements of the parity-odd correlation in the A=100-200 mass region in neutron-nucleus scattering performed at Dubna, KEK, and LANSCE pp:Mitchell99 ; pp:TRIPLE ; pp:FLSU ; pp:FLGR . Although the comparison between theory and experiment in this work is still hampered somewhat by the lack of precise knowledge of the weak NN amplitudes and their possible modifications in the nuclear medium, theory and experiment appear to be in agreement at about the 50% level. Given the extreme complexity of the states involved, agreement between theory and experiment at this level must be counted as an overall success for the statistical approach.
Parity violation in the gamma decays of nuclei is another example where statistical methods may be employed to estimate observables. In this case the observables involve the parity-odd correlation where is the neutron spin and is the momentum of the gamma pp:FLSU ; pp:FLGR ; pp:HAYES . Just as for neutron scattering, neutron capture on elements with a large number of nucleons produces compound nuclei in highly excited states. These nuclei exhibit a huge number of possible state configurations with different angular momenta and parity and the number of transitions with different amplitudes that the compound nucleus may make to its ground state is correspondingly large as well. Because of the large number of energy levels in the compound nucleus, formed by neutron capture, one may hope that the calculation of the mean square matrix elements for the transition amplitudes may also amount to a summation of a large number of uncorrelated random contributions as in the case of the total cross section. One can then use statistical arguments to estimate the RMS value of the parity-odd -ray asymmetry.
However the case of parity violation in (n,) reactions in heavy nuclei is not quite as simple as parity violation in the total cross section for both theoretical and experimental reasons. For the total cross section, the amplification of parity violation effects is dominated by the mixing amplitude of the weak interaction, between two compound nuclear states of opposite parity (in practice s-wave and p-wave compound states). Since the total cross section is proportional to the forward elastic scattering amplitude, by the optical theorem, there is only one such contribution for any pair of opposite-parity compound states. For inelastic processes such as the (n,) reaction, however, the weak mixing between compound states can occur in either the initial or final nuclear states, and since these states are distinct in an inelastic reaction there are two possible sources of compound nuclear amplification of the parity-odd effect rather than one pp:FLGR . Because of the large density of states in the initial state near neutron separation energy, the initial state mixing will involve a larger number of components in the wave function for gamma transitions to low-lying states and therefore lead to a larger amplification. However one also has contributions from transitions to higher-lying states where final-state mixing is somewhat more important. Experimentally, precise measurements of parity-odd asymmetries are more practical for the total integrated gamma spectrum rather than individual gamma transitions. But a calculation of the asymmetry of the integral gamma spectrum requires an additional averaging over the large number of distinct final states. In addition the integral measurement also senses gamma cascades in addition to single transitions. Parity-odd correlations in the integrated gamma spectra of 35Cl, 81Br, 113Cd, 117Sn, and 139La have previously been calculated by Flambaum and Sushkov pp:FLSU and by Bunakov et. al. pp:BUNAKOV . However, more experimental information on parity-odd asymmetries in integral gamma spectra from heavy nuclei are needed in any attempt to make progress in this area.
We have searched for parity-odd directional -ray asymmetries in the capture of cold polarized neutrons on , Cu, and at the Los Alamos Neutron Science Center (LANSCE). We have performed a simple statistical estimate of the mean square value for the parity odd asymmetries in these nuclei and obtain expected upper bounds which are consistent with experiment. In addition, we performed measurements of the directional -ray asymmetry for polarized cold neutron capture on and on . is known to possess a large parity-odd gamma asymmetry pp:AVENIER ; pp:VESNA and it is used to verify the sensitivity of our apparatus. is used extensively throughout the experiment, for neutron shielding. Searches for parity-odd gamma asymmetries on several other nuclei are in progress.
These measurements are being conducted in preparation for an experiment to search for the parity violating -ray asymmetry in the capture of polarized neutrons on protons by the NPDGamma collaboration. The apparatus constructed for this measurement is capable of measuring -ray asymmetries with an accuracy of .
The remainder of the paper is organized as follows. We first provide a brief theory section in which we outline the calculation and estimate the expected root mean square of the -ray asymmetry in a current mode -ray detector from the nuclei used in the experiment. We give a short overview of the experimental layout and then describe the measurements. We conclude with a discussion about the results and the associated implications.
II Theory and Statistical Estimates
The simplest nuclear reaction which can produce a parity-odd directional distribution of -rays is the capture of polarized neutrons on protons. The differential cross-section in this simple system can be calculated explicitly from the transition amplitudes of the electro-magnetic part of the Hamiltonian between initial (capture) and final (bound) two nucleon states, which possess mixed parity due to the NN weak interaction. In the reaction the primary process is the strong interaction induced parity conserving M1 transition between the singlet and triplet S-wave states: , . The weak interaction introduces a small parity non-conserving admixture of P-wave states in the initial singlet and the final triplet S-wave states. The largest contribution to the hadronic weak interaction comes from pion exchange and the measurement of the parity-violating up-down asymmetry, , in the angular distribution of 2.2 MeV -rays with respect to the neutron spin direction (Eq. 1) , almost completely isolates the term proportional to the weak pion-nucleon coupling constant pp:ADLB .
| (1) |
Here is angle between the neutron spin direction and the -ray momentum.
For the reaction, it can be shown that there is a simple expression for the -ray asymmetry in terms of the matrix elements between initial and final states
| (2) |
Here
| (3) |
and .
In heavy nuclei the interference term which produces the asymmetry is much more complicated, involving many states. Here, a neutron may capture into an S or P wave state close to the neutron separation energy and the weak interaction mixes the corresponding amplitudes perturbatively. For almost all nuclei except in few body systems it is essentially impossible to calculate the parity violating asymmetry from the strong and weak Hamiltonian, because of the large number of -ray transitions. However, because of the large number of possible electromagnetic transitions in the compound nucleus the calculation of the mean square matrix elements for the transition amplitudes amounts to a summation of a large number of uncorrelated random amplitudes which are approximately independent of the transition energy for . One can then hope to use statistical arguments to estimate the RMS value of the asymmetry from nuclei close to a certain neutron separation energy.
Due to the large density of states close to the neutron separation energy and the correspondingly small level spacing , parity violation is expected to be dominated by the mixing of the two closest S and P wave states near , in the initial or capture state, and it is expected on general grounds that parity violation due to mixing with lower lying states may be neglected. The parity violating asymmetry comes from interference between E1 and M1 gamma transitions. The -ray asymmetry from the decaying compound nucleus as measured in a current-mode gamma detector is given by
| (4) |
Here the transitions are between initial (i) and final (f) compound nuclear states with total angular momentum and parity (p,p’). is the angular momentum coupling factor resulting from the compound state polarization pp:FLSU :
is the angular momentum of the target nucleus before neutron capture.
The dependence on the -ray transition energy in eqn. (4) comes from the phase-space factor in the transition amplitude and the linearity of the detector response as a function of energy in a current mode gamma detector. The factor
arises because the current mode gamma detector possesses no energy resolution and therefore sees a superposition of currents from all transitions. This has the effect of diluting the asymmetry . Here,
is the relative intensity of a given transition.
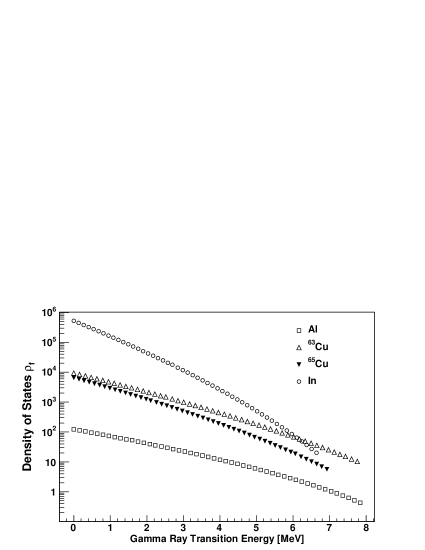
We estimate the density of final states using the Back-Shifted Fermi Gas model (BSFGM) as pp:EGBU ; pp:DILG ,
| (5) |
where is summed over for each final compound nuclear state. Here, and are determined from experimental data and the temperature parameter is defined by . is the spin cut-off parameter and the effective moment of inertia takes on values between 50% and 100% of the rigid body moment of inertia . The level density (Eq. 5) is derived assuming random coupling of angular momenta and the spin cut-off parameter arises as a result of this treatment pp:DILG . The excitation energy is the energy of the nucleus after the -ray transition from the capture state. may be zero if the transition is to the ground state. Figure 1 shows the predicted density of final states, using this model, for the , Cu, and , nuclei as a function of -ray energy.
For comparison and to estimate the uncertainty in the calculated asymmetries due to the model we also determine the asymmetries using a constant temperature model (CTM) of the final density of states pp:EGBU
| (6) |
The aim of this calculation is to find a simple “generic” formula that holds for many nuclei and provides a good estimate of the size of an asymmetry one can expect in a measurement of this nature. The denominator in eq. 4 is the parity allowed transition from the initial compound state after capture of an S-wave neutron. This transition has the largest amplitude and basically determines the intensity of the gamma signal. In general E1 transitions outnumber M1 transitions and the denominator is primarily E1 for most nuclei. We point out though, that if one has initial states such that all or most parity allowed transitions are M1 in the range of expected -ray energies, as determined by the density of states (as is the case for Al and In), then the denominator would be M1.
The root mean square of the -ray asymmetry can then be estimated as follows: We use the electric and magnetic dipole transition rates which are given by
| (7) |
respectively. The transition rates are strength functions. As the density of states increases, the average matrix element squared decreases and the transition rates are constant or slowly varying functions of energy.
The root mean square of the detected intensity of the gammas that depopulate the initial state is given by taking the average of the squared denominator in eqn. 4. Then, invoking the randomness in the transition amplitudes (under the assumption that the correlation is zero, so that the cross terms vanish), we find
| (8) | |||||
The factor arises in the standard fashion, when converting the sum over final states into an integral.
The root mean square of the interference term in the numerator gives
| (9) | |||||
Where we again used the randomness in the transition amplitudes in going to the second line. With this, the mean square asymmetry can be estimated for each target from.
| (10) |
To calculate the root mean square asymmetry for a particular nucleus, one must then determine whether the transitions to the ground state are mostly or and omit the corresponding amplitude in the denominator. In the case of and we then have , while for Cu we have .
Substituting the experimental value of the hadronic weak mean square matrix element () pp:TRIPLE and using
together with the fact that transitions are approximately 10 times faster than transitions, pp:KOPECK ; pp:MCCULL , the root mean square asymmetry can be calculated for different nuclei and neutron separation energies. When evaluating eqn. 10 for aluminum, for example, the single particle level spacing is approximately , the dilution factor and the ratio of integrals in eqn. 10 can be numerically evaluated to give . The expected RMS value of the gamma asymmetry is then about . The RMS -ray asymmetry values and other associated variables for the nuclei studied in this work are listed in table 1.
| Calculated RMS -ray Asymmetries Values (BSFGM) | |||||||||
| 8.0 | 0.3 | 0.6 | |||||||
| 7.9 | -0.4 | 0.5 | |||||||
| 7.1 | -0.4 | 0.5 | |||||||
| 6.8 | 0.4 | 400 | 0.4 | ||||||
| Calculated RMS -ray Asymmetries Values (CTM) | |||||||||
| 8.0 | 0.3 | 0.7 | |||||||
| 7.9 | -0.4 | 0.6 | |||||||
| 7.1 | -0.4 | 0.6 | |||||||
| 6.8 | 0.4 | 400 | 0.4 | ||||||
II.1 Theory Discussion
The results in tables 1 and 4 show no large enhancements. There are several reasons why one may expect this behavior. For example, the levels are highly degenerate, the sign of the asymmetry is random and the transitions mix incoherently, producing a suppression. There is also no enhancement for the direct capture calculations done here, which are appropriate for the low neutron energies used in these experiments.
In pp:FLSU Flambaum and Sushkov calculated the average value for the integral -ray spectrum relative to the S-wave amplitude for thermal neutrons
which is far from p-wave resonance so that it’s contribution to the cross section can be neglected. The root mean square asymmetry is given, in their notation, by
| (11) |
Where is an integral over the E1 and M1 radiative strength functions, detection efficiency and density of final states, corresponding to our integral in eqn. 9. Equation 11 may be compared to our result above. Flambaum and Sushkov also state that the -ray asymmetry arises as a result of the E1,M1 interference, that the transitions are random, and that the asymmetry is statistically suppressed after averaging.
The main difference between our calculations and those done by Flambaum and Sushkov is that they consider a p-wave resonance near the thermal (or cold) region mixed by parity violation with one S-wave resonance, while our treatment takes account of all S and P-wave resonances, but in the tail, far from resonance, at the average spacing D or more.
III Experiment
The NPDGamma apparatus used for the measurements is located on flight path 12 at the Manuel Lujan Jr. Neutron Scattering Center at LANSCE. The LANSCE linear accelerator delivers MeV protons to a storage ring, which compresses the beam to ns wide pulses at the base. The protons from the storage ring are incident on a split tungsten target at a rate of Hz and the resulting spallation neutrons are cooled by and backscattered from a cold moderator with a surface area of . For the measurements described here, the cold neutrons were transported to the experimental apparatus by a neutron guide and then transversely polarized by transmission through a polarized 3He cell. Three 3He ion chambers were used to monitor beam intensity and polarization. A radio frequency spin flipper was used to reverse the neutron spin direction on a pulse by pulse basis. The polarized neutrons then captured on a target placed in the center of the gamma detector array. The gamma rays from the neutron capture were detected by an array of 48 CsI(Tl) detectors operated in current mode pp:DET ; pp:swb . The entire apparatus was in a homogeneous 10 Gauss field, which was required to maintain the neutron spin downstream of the polarizer, with a gradient of less than mG/cm to make spin-dependent Stern-Gerlach steering of the polarized neutron beam negligible.
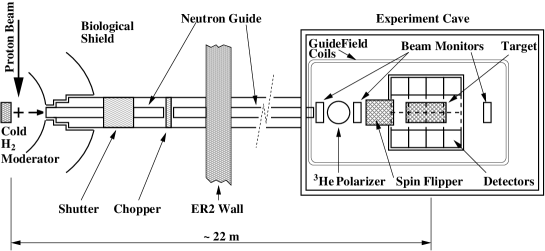
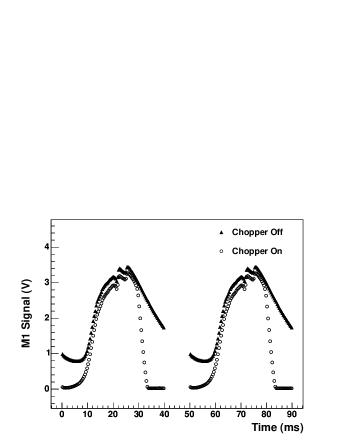
Figure 2 shows the flight path and experimental setup. The distance between the moderator and target is about 22 meters. The flight path 12 beam line consists of a neutron guide, a shutter, and a beam chopper. The pulsed spallation neutron source allowed us to know the neutron time of flight or energy accurately. The chopper is used to define the time of flight frame and to prevent neutrons from different frames to mix and thus dilute the neutron energy information. In this experiment the chopper was used to close the beam line before the end of the frame which allowed us to take beam-off (pedestal) data for ms at the end of each neutron pulse which is needed for detector pedestal and background studies (Fig. 3). The last ms after sampling stops is used by the DAQ for data transfer. A detailed description of the FP12 neutron guide and performance is given in pp:pil . The measured moderator brightness has a maximum of for neutrons with an energy of meV.
The neutrons were polarized by passing through a 12 cm diameter glass cell containing polarized ( pp:chupp ; pp:pol and references within). The beam polarization was measured with the beam monitors using neutron transmission ( polarization can be monitored using NMR). For gamma asymmetry measurements, the figure of merit is the statistical accuracy that can be reached for a certain running time, which is proportional to the product , where is the neutron transmission through the cell and is the neutron polarization pp:Jones . The neutron transmission increases with energy whereas the neutron polarization decreases with energy. In the analysis of the data the neutron polarization was calculated separately for each run by fitting the transmission spectrum to the expression , using a thickness of , which was separately measured. Here, with neutron energy in units of meV, and .
The primary technique for reducing false asymmetries generated by gain non-uniformities, slow efficiency changes and beam fluctuations is frequent neutron spin reversal. This allows asymmetry measurements to be made in each spin state for opposing pairs of detectors and for consecutive pulses with different spin states, thereby suppressing the sensitivity of the measured asymmetry to detector gain differences, drifts, and intensity fluctuations. By carefully choosing the sequence of spin reversal, the linear and quadratic components of time-dependent detector gain drifts in a sequence can be greatly suppressed. To achieve the neutron spin reversal, the experiment employed a radio frequency adiabatic neutron spin rotator (RFSR) pp:spfl which operates at -kHz for the 10 G guide field. The neutron spin direction is reversed when the RFSR is on and is unaffected when it is off. The spin flip efficiency averaged over the beam cross-section ( cm diameter) was measured to be about 99%
The polarized neutrons then captured on a target placed in the center of the gamma detector array. The targets were thick enough to stop most of the neutron beam by capture or scattering with diameters larger than the beam cross section. The capture signals from all of the targets measured were large compared to noise and background.
The housing for the liquid target was made of Teflon. The liquid is 99.9% chemically pure, with less than 0.01% water content. The aluminum and copper targets consisted of a number of sheets supported by an aluminum frame. Each target sheet is an approximately mm thick square with cm sides. The arrangement of the target into sheets with a gap between the sheets reduced attenuation in the target. The total length of the target (including gaps) was 30 cm. Target out background runs and runs with the empty frame were conducted as well and the background is taken into account in the final determination of the asymmetry (see table 2). The boron target consists of a 1 cm thick 15 cm by 15 cm sheet of sintered glued to an aluminum holder consisting of a simple (thin) aluminum sheet. The indium target was approximately 12 mm thick, covering a circular cross-sectional area with a radius of cm at the center of the beam. For each of the targets the beam was collimated to a diameter of about .
| Relative Background | ||
|---|---|---|
| Al | ||
| In | ||
| Cu | ||
| Al | 1 | |
| Cu | 0.95 | |
| 0.95 | ||
| In | 1 | |
| 1 |
The depolarization of neutrons via spin flip scattering from the nuclei dilutes the asymmetry. For all targets the neutron depolarization is a small effect which can be estimated to sufficient accuracy for nonmagnetic materials using the known neutron coherent and incoherent cross sections. Table 3 lists the estimated spin-flip probabilities for the targets used and the corresponding calculated average correction factors . The degree of spin flip scattering is neutron energy dependent and a Monte Carlo calculation for the depolarization as a function of neutron energy was applied to the data.
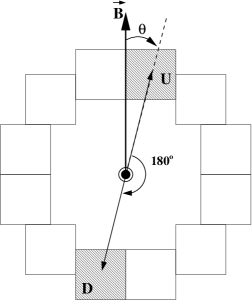
The detector array consists of 48 CsI(Tl) cubes arranged in a cylindrical pattern in 4 rings of 12 detectors each around the target area (Fig. 4). In addition to the conditions set on the detector array by the need to preserve statistical accuracy and suppress systematic effects, the array was also designed to satisfy criteria of sufficient spatial and angular resolution, high efficiency, and large solid angle coverage pp:DET . Because of the possible small size of the asymmetries and the proposed measurement accuracy the average rate of neutron capture and the corresponding gamma rate in the detectors must be high to keep the run-time reasonable. Because of the high rates and for a number of other reasons discussed in pp:DET , the detector array uses current mode gamma detection. Current mode detection is performed by converting the scintillation light from CsI(Tl) detectors to current signals using vacuum photo diodes (VPD), and the photocurrents are converted to voltages and amplified by low-noise solid-state electronics pp:swb .
In current mode detection, the counting statistics resolution is limited by the RMS width in the sample distribution. For our detector array this width is dominated by fluctuations in the number of electrons produced at the photo-cathode of the VPD, which is dominated by -ray counting statistics when the beam is on. During beam on measurements, the shot noise RMS width is then given by bb:DVR
| (12) |
where is the amount of charge created by the photo cathode per detected gamma-ray, is the average photo-current per detector and is the sampling bandwidth, set by the ms time bin width in the time of flight spectrum pp:DET ; pp:gericke2 .
IV Analysis and Results
IV.1 Asymmetry Definition
For a point target and a detector array with perfect spatial resolution, the measured -ray angular distribution would be proportional to the differential cross section , where is the angle between the neutron polarization and the momentum of the emitted photon and is the parity-odd up-down (UD) asymmetry. A third term is present if a parity-conserving (PC) left-right (LR) asymmetry exists pp:CGP . In that case . However, the relationship between the basic expression for the -ray yield and the measured asymmetry is complicated by a number of small neutron energy dependent effects. A separate asymmetry is calculated for each detector pair, as defined in Fig 4.
The physics asymmetry for a given detector pair (p), spin sequence (j), and neutron time of flight is given by
| (13) | |||||
Here, is the measured asymmetry. The background asymmetries and the relative signal level must be measured in auxiliary measurements. is the gain asymmetry between the detector pair and is the asymmetry from pulse to pulse beam fluctuations. The neutron energy and detection efficiency weighted spatial average detector cosine (up-down asymmetry) with respect to the (vertical) neutron polarization is given by , while the detector sine (left-right asymmetry) is given by . These detector-target geometry corrections have been modeled for each target geometry. Also included are the correction factors due to the neutron beam polarization , the spin flip efficiency and the neutron depolarization in the target .
The measured (raw) asymmetry for each detector pair and neutron energy can be extracted in the usual way, by forming a ratio of differences between cross-sections to their sum. However, to suppress first and second order detector gain drifts pp:bow the raw asymmetries were formed for all valid sequences of 8 macro pulses with the correct neutron spin state pattern as shown in eqn. (14).
| (14) |
Here the sum is over all four signals with the corresponding spin state in a spin sequence for the up (U) and down (D) detector in a pair. A so-called valid 8 step sequence of spin states is defined as (). Asymmetries were measured for 55 different neutron energies between approximately 2 and 16 meV, with a resolution of per time bin, respectively.
It is important to realize that signal fluctuations that are not correlated with the switching of the neutron polarization direction, such as beam and detector gain fluctuations, will average out and don’t contribute to the asymmetry. It is, however, essential that these signals have an RMS width that is small compared to the RMS width in the asymmetries of interest (driven by counting statistics) so that they do not reduce the statistical significance of the result and are averaged to zero quickly compared to the time it takes to measure the asymmetry to the desired accuracy. Possible false asymmetries due to spin-state correlated electronic pickup (additive asymmetry) and possible magnetic field induced gain changes (multiplicative asymmetry) in the detector VPDs have previously been measured and are consistent with zero to within pp:DET .
The detector pair physics asymmetries as represented by eqn. 13 can then be combined in error weighted averages over the neutron time of flight spectrum to form a single asymmetry for each detector pair in the array, for a single 8-step sequence of beam pulses. If beam intensity levels are sufficiently stable over the measurement time these sequence asymmetries can be histogrammed for each pair. Typical run lengths were minutes and included 10000 beam pulses or 1250 8-step sequences and the asymmetry measurements performed usually extended over several hundred runs.
IV.2 Results
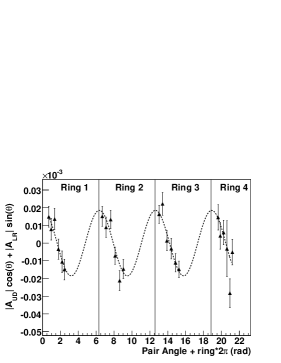
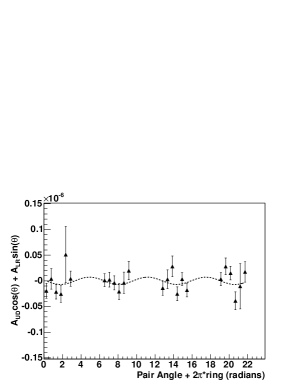
The known parity-odd gamma asymmetry in was used to verify that a nonzero asymmetry can be measured with our apparatus. The asymmetry was also used to verify the geometrical dependence of the pair asymmetries. For this purpose all 24 pair asymmetries, extracted from the histogrammed 8-step sequence asymmetries over all data obtained with that target, were multiplied by their mean geometry factors and plotted versus their corresponding mean angle. The resulting graph is shown in Fig. 5. The fit function used to extract the total array asymmetry is .
| Up-Down | Left-Right | RMS width | |
| (typ.) | |||
| Al | |||
| Cu | |||
| In | |||
| Noise (add.) | |||
| Noise (mult.) | |||
| BeamGain | N/A | N/A | |
In general, the up-down and left-right asymmetries must be extracted using the fit described above. Higher order corrections to the fitting function used here (parity violating or not) are introduced by higher partial waves in the expansion of the initial and final two nucleon states representing more complicated scalar combinations between the neutron spin and outgoing -ray momentum direction . For the up-down asymmetry the angular distribution is obtained from initial and final two-nucleon states with components up to the P-waves producing the correlation. The left-right asymmetry originates from the correlation. Parity violating corrections from higher partial waves are negligible because they represent a second order perturbation proportional to the weak coupling squared. The results of the asymmetry measurements are summarized in table 4. Note that beam asymmetries are only produced if there are pulse to pulse fluctuations in the number of neutrons and only in combination with a difference in gain between a given detector pair. Neither beam fluctuations nor detector gain differences are correlated with the neutron spin and therefore the BeamGain asymmetry does not contain any up-down or left-right dependence. Due to the sum over the eight step sequence, the BeamGain asymmetry is zero and its root mean square width is determined by the size of beam fluctuations. The additive and multiplicative noise asymmetries in 4 are measured without a light signal from the detectors (electronic noise only) and with a light signal from LEDs embedded in the detectors respectively. The large RMS width for the multiplicative noise asymmetry is a result of larger fluctuations with LEDs pp:DET .
IV.3 Errors
The final statistical errors stated in table 4 are taken from the distribution of sequence values , with histogrammed 8-step sequence asymmetries. Any non-random effect such as those introduced by the correction factors are treated as systematic errors. These enter as
and are added in quadrature with the statistical error.
The errors on the beam polarization and spin flip efficiency were calculated to be 4% and 10% respectively. The error on the geometry factor is estimated to be less than 1% from variations observed in the values when varying the step size in the Monte Carlo, simulating -ray interaction in the detectors. The error on the spin flip scattering is estimated to be on the order of a few percent. Since the systematic errors are scaled by the asymmetry, their contribution to the overall error on the asymmetry is negligible compared to the statistical error, except for the case of the target, which has a large non-zero asymmetry. For , the systematic error is . So the Up-Down physics asymmetry and its total error is . A previous measurement of this asymmetry by this collaboration found pp:greg . M. Avenier and collaborators pp:AVENIER found an Up-Down asymmetry for of , while V.A. Vesna and collaborators found pp:VESNA (see also pp:KRUP ).
V Conclusion
The NPDGamma collaboration has searched for -ray asymmetries from polarized slow neutron capture on , Cu, and . The asymmetry measurements for these targets were consistent with zero at the few level for and at the few level for Cu and . All asymmetries are consistent with zero within errors. The asymmetries obtained from the measurements are consistent with results from previous measurements. A statistical model, in combination with previous measurements of weak matrix elements in compound nuclei, was used to estimate the expected RMS size of the parity violating -ray asymmetries in , Cu, and . Based on this model it is expected that non-zero measured asymmetries will be smaller than the estimated width 68.3% of the time. The upper bounds on the measured asymmetries are therefore consistent with the estimates obtained from these statistical calculations. Based on the inverse relationship between the single particle level spacing and the size of the asymmetry, one would expect a large number of very small or essentially zero asymmetries when performing measurements for many larger nuclei, but one would also expect to find a small number of nuclei with enhanced asymmetries. We plan to continue measurements in other nuclei in the mass range to test this hypotheses more precisely and to further investigate the predictions of the statistical approach to parity violation in compound nuclei.
VI Acknowledgments
The authors would like to thank Mr. G. Peralta (LANL) for his technical support during this experiment, Mr. W. Fox (IUCF) and Mr. T. Ries (TRIUMF) for the mechanical design of the array and the construction of the stand and Mr. M. Kusner of Saint-Gobain in Newbury, Ohio for interactions during the manufacture and characterization of the CsI(Tl)crystals. We would also like to thank TRIUMF for providing the personnel and infrastructure for the stand construction. This work was supported in part by the U.S. Department of Energy (Office of Energy Research, under Contract W-7405-ENG-36), the National Science Foundation (Grants No. PHY-0100348 and PHY-0457219) and the NSF Major Research Instrumentation program (NSF-0116146), the Natural Sciences and Engineering Research Council of Canada, and the Japanese Grant-in-Aid for Scientific Research A12304014.
References
- (1) S. S. M. Wong, Nuclear Statistical Spectroscopy, Oxford University Press (1986)
- (2) C. E. Porter, Statistical Theories of Spectra: Fluctuations, Academic Press, New York, 1965
- (3) H. J. L. Harney, A. Richter, H. A. Weidenmuller, Rev. Mod. Phys, 58:607 (1986)
- (4) G. E. Mitchell, J. D. Bowman, H. A. Weidenmuller, Rev. Mod. Phys, 71:445 (1999)
- (5) G. E. Mitchell, J. D. Bowman ,S. I. Penttilä, and E. I. Sharapov, Physics Reports 354 (2001) 157-241
- (6) V. V. Flambaum and O.P. Sushkov, Nucl. Phys. A 435 (1984) 352-380
- (7) V. V. Flambaum and G.F. Gribakin, Prog. Part. Nucl. Phys. 35 (1995) 423-503
- (8) A. C. Hayes, L. Zanini, Phys. Rev. C 65, 058501 (2002)
- (9) V. E. Bunakov, V. P. Gudkov, S. G. Kadmensky, L. A. Lomachenkov and V. I. Furman, Yad. Fiz. 40 (1984) 188 [Sov. J. Nucl. Phys. 40 (1984) 119].
- (10) M. Avenier et al. Nucl. Phys. A, 436 (1985) 83.
- (11) V.A. Vesna et al. JETP Lett. 36 (1982) 209.
- (12) E. G. Adelberger and W. C. Haxton, Ann. Rev. Nucl. Part. Sci., 35 (1985) 501-558
- (13) T. von Egidy, D. Bucurescu, Phys. Rev. C 72, 044311 (2005)
- (14) W. Dilg, W. Schantl, and H. Vonach, Nucl. Phys. A 217 (1973) 269-298
- (15) J. Kopecky and M. Uhl, in: Measurement, Calculation and Evaluation of Photon Production Data, edited by C. Coceva, A. Mengoni, and A. Ventura (NEA/NCS/DOC, Bologna, 1994), p. 119.
- (16) C.M. McCullagh, M.L. Stelts, R.E. Chrien, Phys. Rev. C 23 (1981) 1394.
- (17) S.F.Mughabghab, M.Divadeenam, N.E.Holden, Neutron Cross Sections Part A (Z = 1-60), Academic Press 1981
- (18) S.F.Mughabghab, M.Divadeenam, N.E.Holden, Neutron Cross Sections Part A (Z = 61-100), Academic Press 1984
- (19) M. T. Gericke, et al., Nucl. Instr. Meth. A 540 (2005) 328.
- (20) W. S. Wilburn, J. D. Bowman, M. T. Gericke, S. I. Penttilä, Nucl. Instr. and Meth. A 540 (2005) 180.
- (21) P.-N. Seo, et al., Nucl. Instr. Meth. A 517 (2004) 285.
- (22) T.E. Chupp, et al., Submitted to Nucl. Instr. Meth.
- (23) T. Gentile et al., J. Res. Natl. Inst. Stand. Technol. 110 (2005) 299-304.
- (24) G. L. Jones et al., Nucl. Instr. Meth. A 440 (2000) 772.
- (25) P-N. Seo et al., Nucl. Instr. and Meth. to be submitted.
- (26) W. B. Davenport, W. L. Root, An Introduction to the Theory of Random Signals and Noise, John Wiley & Sons, New York, 1987.
- (27) M. T. Gericke et al., J. Res. Natl. Inst. Stand. Technol. 110, 215-219 (2005)
- (28) A. Csoto, B. F. Gibson and G. L. Payne, Phys. Rev. C 56 (1997) 631.
- (29) J. D. Bowman and J. C. VanderLeeden, Nucl. Instr. Meth. 85 (1970) 19.
- (30) G. S. Mitchell, et al., Nucl. Instr. Meth. A 521 (2004) 468.
- (31) P.A. Krupchitskii et al., Physics of particles and Nuclei 26, 6, (1994) 612-630.