Photo-production of neutral kaons on 12C in the threshold region
Abstract
Kaon photo-production process on 12C has been studied by measuring neutral kaons in a photon energy range of 0.81.1 GeV. Neutral kaons were identified by the invariant mass constructed from two charged pions emitted in the decay channel. The differential cross sections as well as the integrated ones in the threshold photon energy region were obtained. The obtained momentum spectra were compared with a Spectator model calculation using elementary amplitudes of kaon photo-production given by recent isobar models. Present result provides, for the first time, the information on reaction which is expected to play an important role to construct models for strangeness production by the electromagnetic interaction. Experimental results show that cross section of is of the same order to that of and suggest that slightly backward angular distribution is favored in the process.
keywords:
PACS:
13.60.Le; 25.20.LjKeywords: Photo-production; Strangeness; Neutral kaon; Quasi-free reaction; Cross section; Isobar model
, ††thanks: Present address: Gifu University, Gifu, 501-1193, Japan , , , , , , , , , , , , , , , , , , , , , , , , , , , , ††thanks: Present address: Institute of Particle and Nuclear Studies, High Energy Accelerator Organization (KEK), Tukuba, 305-0801, Japan , , , , , , , ,
1 Introduction
Strangeness photo-production process near the threshold attracts strong interests in the context of the baryon resonances which couple with kaon/hyperon channel. Integrated and differential cross sections as well as hyperon polarizations in the and reactions were measured with high statistics by the SAPHIR collaboration [1]. Theoretical analysis in the framework of the isobar model showed that the observed structure around 1900 MeV can be explained well by including a new resonance of 1895 MeV [2]. It was also pointed out that the values of the extracted resonance parameters are strongly influenced by the treatment of background processes, namely, the choice of the meson and hyperon resonances in t- and u-channels, and the adopted recipes for the phenomenological hadronic form factors [3]. The recent CLAS [4][5] and SAPHIR [6] data show a more pronounced structure around 1900 MeV than the old SAPHIR data. Attempts to fit the models to these data have been made [7], however, new experimental data on such as spin observables [4][8] and other isospin channels are necessary in order to properly construct the theoretical models and to obtain clear conclusions on the resonances. Strangeness photoproduction processes are expected to shine rich characteristics of the hadron structures and the strangeness-involved reactions.
From the viewpoint of the isobar model, the reaction channel, , in the threshold region has the following unique features; (1) The t-channel Born term does not contribute. (2) It is a mirror reaction to . A coupling constant, , changes its sign because of the isospin symmetry, , resulting in the different interference effect. This also holds for the exchange terms of isovector hyperon resonance in the u-channel. (3) Contribution of higher mass resonances are suppressed in the threshold region.
It was also suggested that the angular distribution of neutral kaons could be backward peaked [9]. Moreover, the amplitude of the channel, being sensitive only to couplings of the neutral particles, is supposed to better differentiate diagrams in the isobar models. Thus, the neutral reaction channel is expected to play a unique role in the investigation of the photo-production of strangeness, which cannot be revealed only by measuring charged kaon channels.
In this paper, we report the first measurement of the reaction on a nucleus () using a tagged photon beam. The integrated and differential cross sections are presented as a function of the incident photon energy, . The experimental results are compared with predictions of a Spectator model in which the elementary amplitudes of the given by isobar models were assumed.
2 Experiment
The experiment was performed using the internal tagged photon beam facility [10] at Laboratory of Nuclear Science, Tohoku University ( LNS ).
The 1.2 GeV electron beam in the STretcher Booster ring ( STB ring ) produces bremsstrahlung photons at the internal target of a thin carbon fiber of 15 m . The photons were tagged over the energy range of 0.8 1.1 GeV with by bremsstrahlung-recoil electrons, momenta of which were analyzed by a bending magnet of the STB ring. The average tagged photon rate was . The photons irradiated a thick graphite target ( natural ) which was placed at the center of the Neutral Kaon Spectrometer ( NKS ) as illustrated in Fig. 1.
Charged particles produced at the extraction window of the accelerator ring and the collimator for eliminating the beam halo were swept out by a sweep magnet followed by concrete shields. The beam line from the sweep magnet to the target was filled with a helium bag to suppress the conversion positron-electron pairs which is one of the major source of trigger backgrounds. As shown in Fig. 1, a CsI(pure) counter was placed downstream of the NKS to measure the photon tagging efficiency in the separate runs with low intensity beams. The averaged efficiency was measured to be 781 %.
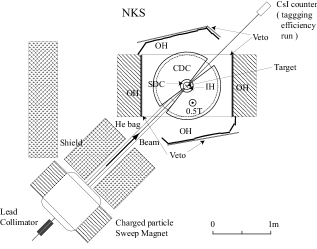
Neutral kaons were measured by detecting positive and negative pions in coincidence, which were emitted in the decay channel. The NKS was based on the TAGX spectrometer [11], originally built at Electron Synchrotron Laboratory of the Institute for Nuclear Study (INS-ES), and was re-assembled at LNS. It comprises a dipole magnet of 107 cm pole and 60 cm gap, straw ( SDC ) and cylindrical ( CDC ) drift chambers in the magnetic field of 0.5 Tesla, inner ( IH ) and outer ( OH ) plastic scintillator hodoscopes, and veto plastic counters ( Veto ) in the beam plane, covering 25% of whole solid angle.
Since background triggers due to the conversion process which occurred along the beam line were dominant, Veto of 4 cm high were installed in the mid-plane behind the OH counter arrays to suppress them. The trigger rates were typically 100 – 200 Hz, but more than half was background triggers. These background events were due to accidental coincidence between the NKS trigger and the tagger trigger, and were easily rejected by offline analysis.
3 Analysis
Horizontal momentum of a charged particle was reconstructed by the hit position information of SDC and CDC using the field map calculated by a 3D magnetic field program, TOSCA. The vertical direction of the trajectory was calculated by approximate height at the target, which was assumed the same as that of the beams, and hit position at OH, which was obtained from the time difference between two PMT signals. Time of flight was measured between the IH and the OH, where the distance is about 1 m. The time resolution was 0.6 ns ( rms ) and was good enough to separate pions from protons below 0.7 GeV/, which was the maximum momentum of the decay pions in the present kinematics. The events were removed by rejecting the events of which the vertex position was upstream the target.
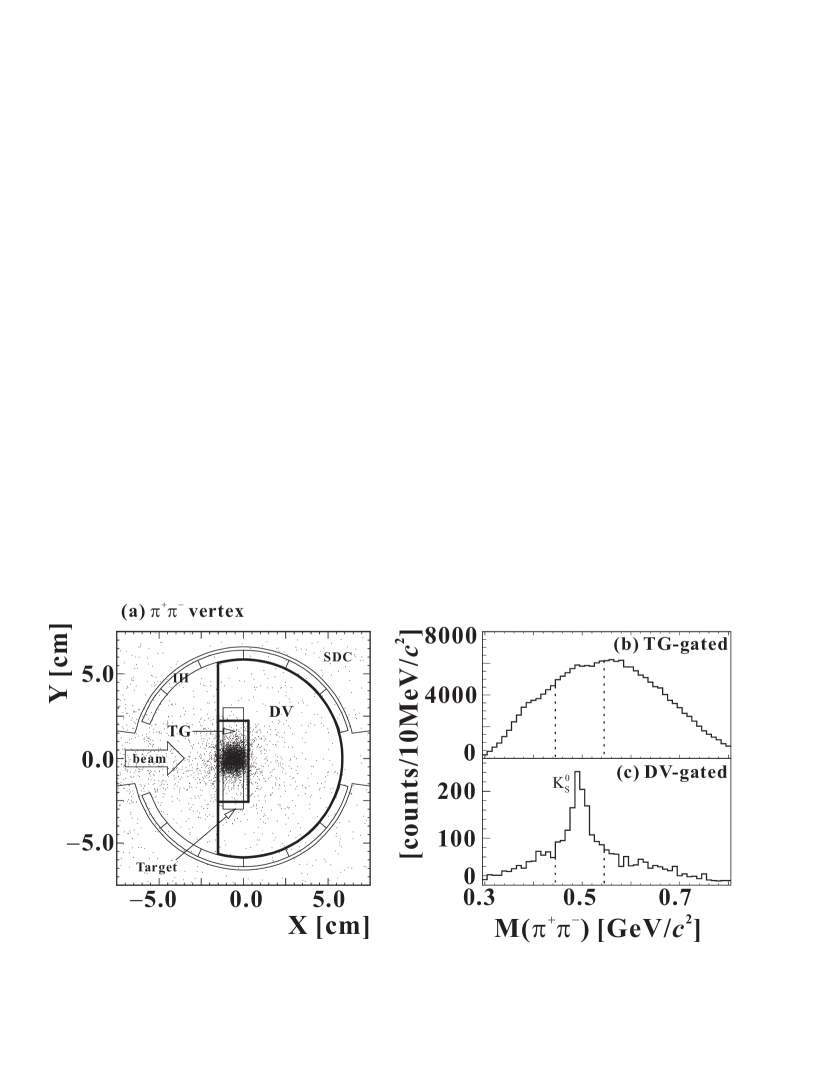
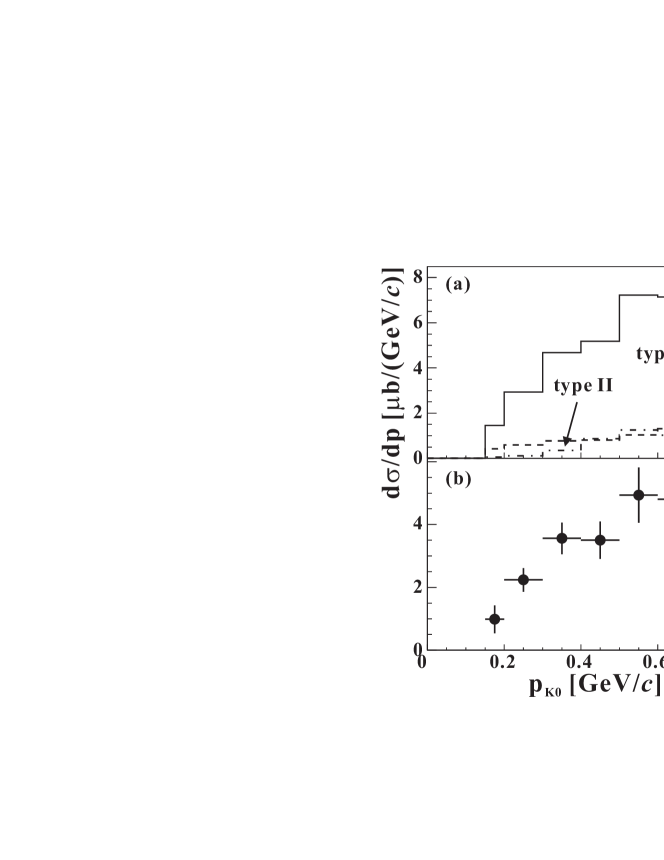
Fig. 2(a) shows the vertex point distribution of events. An opening angle ( ) cut, , was applied in order to keep a good vertex resolution, which was 1.7 mm. Almost all of the events were produced in the target denoted as TG in Fig. 2(a). They come from background processes such as a multi-pion production, , and . The invariant mass spectrum for these events does not show any peak structure as shown in Fig. 2(b). On the other hand, the invariant mass spectrum for those events whose vertex points are in the decay volume region ( DV ) shows a peak structure at the mass as demonstrated in Fig. 2(c). Since has relatively long lifetime of =2.68 cm and decays in flight, the events are enhanced by selecting the vertex points outside the target.
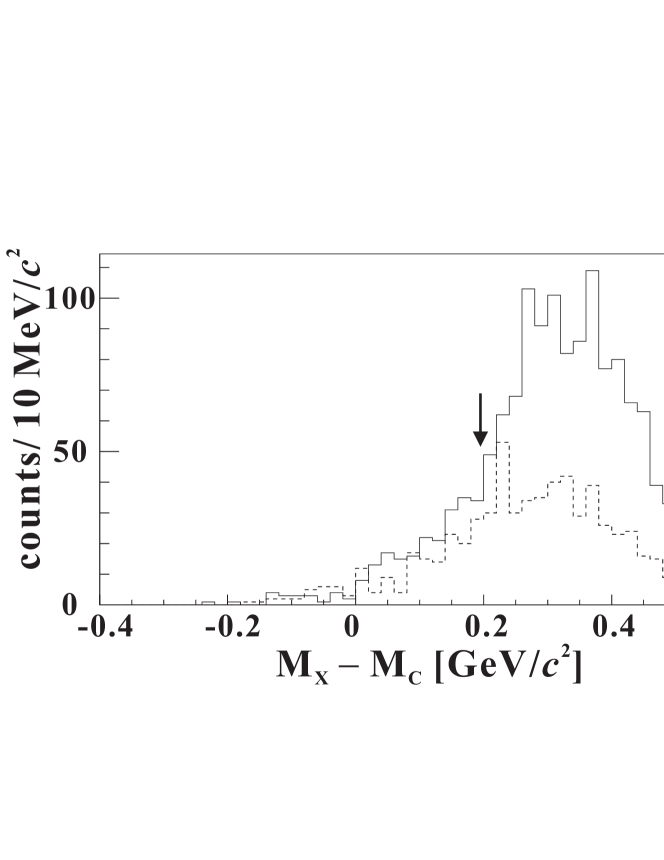
In addition to the vertex position cut, the kinematical consistency between the vertex position and the two-body momentum direction was required in order to further reject the mis-reconstructed events. Missing mass spectrum after applying all selection is shown in fig. 3. It shows measured s are produced in the quasi-free kinematical region.
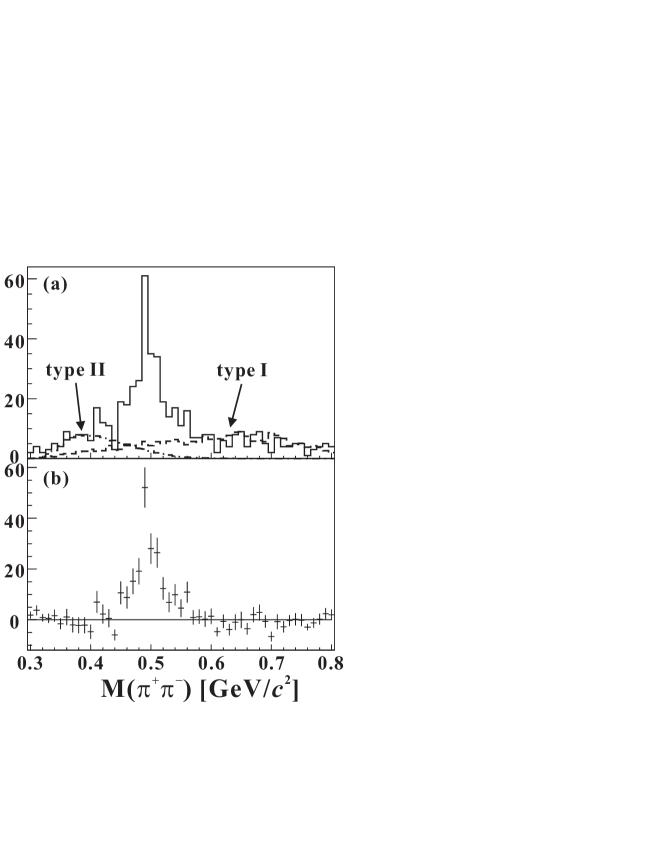
Momentum spectra of neutral kaons were obtained by subtracting background events assuming they have the following two origins; (I) reaction processes other than production such as production, of which vertex should be reconstructed in the TG region but was reconstructed in the DV region due to the limited vertex resolution. (II) combinational background of , such as from decay and from decay. The shapes of the background in the invariant mass and momentum distribution were calculated from the experimental data for (I) and from a Monte Calro simulation using Geant4 [12] for (II), respectively. The ratio of the background to the was obtained by fitting the invariant mass spectra at each photon-energy. In fig. 4(a), the background shapes in the invariant mass spectrum are shown by dashed line for (I) and dot-dashed line for (II). Background subtracted invariant mass spectrum is shown in fig. 4(b). The momentum spectra before and after the background subtraction are also shown in fig. 5(a) and (b).
The spectrometer acceptance was estimated by a Geant4 simulation. Analysis efficiencies were also estimated based on the simulation except for the tracking efficiency. The tracking efficiency which depends on the intrinsic chamber efficiencies and the track-finding algorithm was estimated to be 67% using pion events for left and right arms independently. The numbers of tagged photons for each tagger segment were counted with scalers. The cluster hits and the analysis cuts were corrected using the tagger trigger data taken in the same beam condition. Total normalization error is estimated to be %. A large systematic error comes from strong position dependence of the tracking efficiency due to high singles rate at forward angles.
4 Results and discussion
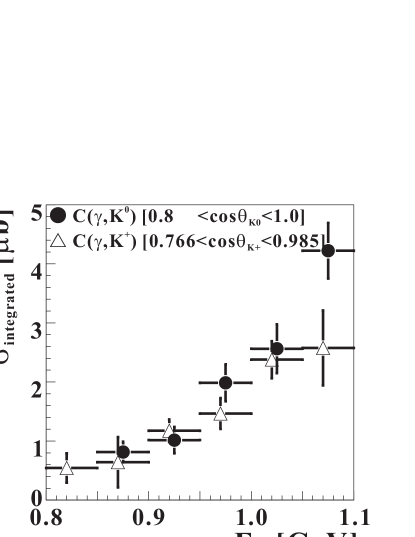
The momentum- and angle-integrated cross sections as a function of photon energy for are plotted in Fig. 6, in which those for [13] are overlaid. The integrated momentum range was chosen so as to cover the kinematically allowed region for the quasi-free process, namely, from 0.15 to 0.70 GeV/ for 0.9 1.0 GeV and from 0.15 to 0.80 GeV/ for 1.0 1.1 GeV, where 0.15 GeV/ is the detection threshold. Angular ranges are practically the same to each other. It can be concluded that the cross sections for and photo-production on 12C (T=0) are similar in magnitude, suggesting that the elementary cross sections for and are of the same order.
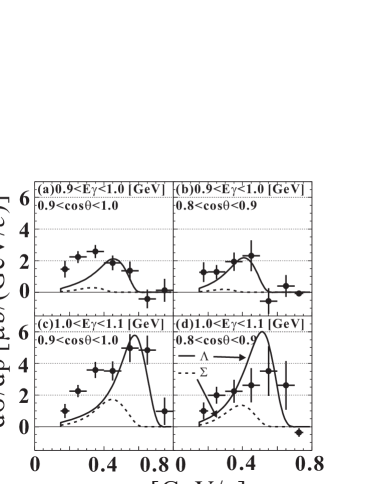
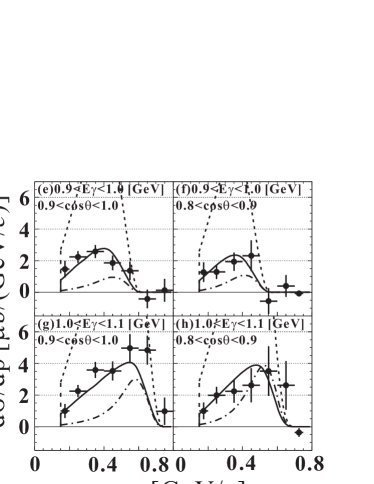
In Fig. 7, the obtained four momentum spectra of are shown for the two photon energy regions, 0.9 1.0 GeV and 1.0 1.1 GeV, and two angular ranges, and . The quoted errors include statistical ones and the uncertainty of the acceptance. In the high momentum region at the forward angle, the errors becomes larger due to the smaller acceptance.
The obtained experimental results were compared with the theoretical calculations using a Spectator model. In this model the cross section of the quasi-free was calculated as an incoherent sum of the elementary invariant amplitudes () for the production on individual bound nucleons (). In the laboratory frame the cross section reads
| (1) | |||||
where , , and p are the 4-momentum vector, 3-momentum vector, and its magnitude, respectively. denotes the energy of the bound nucleon, which is fixed by the -function, and the corresponding mass. W is the c.m. energy of the incoming photon and the bound nucleon. The variables denoted by * are those in the center-of-mass frame of the photon and nucleon. The momentum distribution of the bound nucleons, , is normalized to an effective proton () or neutron () numbers of the target nucleus . These phenomenological parameters mimic attenuation effects of the initial photons, and final kaons and (the final state interaction). The value of 4.2 was assumed for both and , which was deduced in the 12C() experiment in the same energy region [13]. The momentum distribution of the nucleons was modeled by the Fermi gas model with GeV/ for simplicity.
In Eq.(1) the conservation of energy and momentum was required both in the complete (many-body) system and the elementary (2-body) one
| (2) | |||||
| (3) |
Under these conditions the energy and momentum of the bound nucleon are
| (4) | |||||
| (5) |
where and are masses of the target and residual nuclei, respectively. Since the residual nucleus propagates on its mass-shell the bound nucleon is off-shell and its energy therefore does not correspond to the on-mass-shell value. For production on 12C, the mass of the bound nucleon decreases by 2% at =0 GeV/ and 5% at =0.22 GeV/.
This mass reduction makes the two-body c.m. energy lower. The kinematical area for integration is therefore smaller which results in smaller cross sections than that from the on-mass-shell approximation, . Additional off-shell effects are given by the in-medium modification of the elementary amplitude. In our approach the modification was done assuming the explicit dependence of the amplitude on the nucleon mass, , rather than adopting the completely relativistic description discussed in [14]. This can be justified due to the small variations of in the kinematical region assumed here.
The elementary amplitude was evaluated using the Kaon-MAID (kMAID) [2] and Saclay-Lyon A (SLA) [15] models. Besides the Born terms these isobar models include the and diagrams which were shown to be important for a proper description of the data in the intermediate energy region [16]. In the SLA model four hyperon and one nucleon resonances are assumed in addition whereas only four nucleon resonances are included in kMAID. The structure in the hadronic vertices is modeled by the hadronic form factors in kMAID but point like hadrons are assumed in SLA.
In the isobar models, the ratios of the electromagnetic transition coupling constants between the charged and neutral particles have to be adjusted before the model is applied to the channel. The ratios are known for the processes involving a nucleon or but unknown for those with . In kMAID the ratio, , was determined by simultaneously fitting the data of , , and channels. The kMAID model provides, therefore, predictions for both and channels. In SLA, however, the ratio is free and has to be adjusted for production.
The results of calculations using the kMAID amplitudes are shown in Fig.7(a-d), where the solid and dashed lines display contribution from the process and sum of and processes, respectively. The calculations reproduce the present spectra reasonably well both in the magnitude and shape. Although it is model dependent the results for the and channels (dashed line) suggest that contribution of these channels are relatively small at photon energy below 1 GeV. At energies above 1 GeV, these processes become more important.
In Fig. 7(e-h), the same data in Fig. 7(a-d) are compared with the SLA amplitude. Results for three values of the ratio , , , and , are shown to demonstrate the sensitivity of the cross sections to this parameter. The cross sections are greater with larger values as shown in the figure. The best result was achieved with the value = , whereas the value = used in the kMAID model overestimates the present results. The value = , which gives very similar predictions for the elementary cross sections as kMAID, underestimates the presented experimental data. The SLA can also better describe the spectral shapes in the low momentum region with lower photon energy.
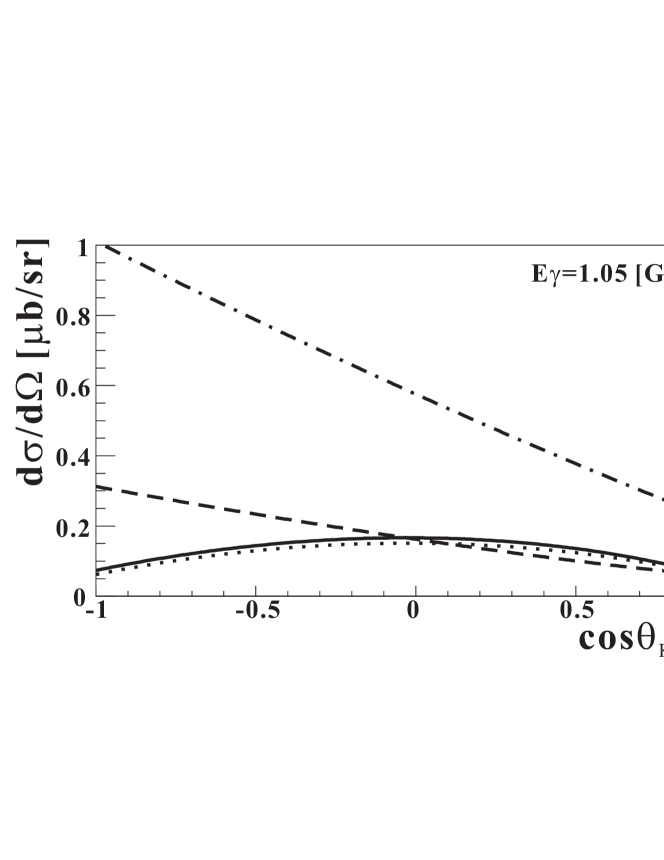
Although angular distributions cannot be directly deduced from the present data due to limited kinematical acceptance, we evaluated them by comparing the measured momentum spectra with those calculated by the models. As shown in fig.8, kMAID and SLA with different values give different angular distribution of the elementary process in the center-of-mass frame. Converting the center-of-mass frame to those in the laboratory system, the momentum spectra show quite different shapes, backward in the center-of-mass frame contributing more to those in the low momentum region in the laboratory system and forward to the higher momentum region because of the Lorentz boost. Since the SLA prediction with , which represents gentle backward angular distribution, gives reasonable agreement with the present data, it can be said without going into the detail of the models that the present data possibly suggest slightly backward angular distribution for the elementary process, though some part of the low momentum excess is possibly due to the production.
5 Summary
We have, for the first time, measured integrated and differential cross sections of the 12C reaction at the photon energy below 1.1 GeV, identifying neutral kaons by reconstructing the decay. It was found that the integrated cross section is almost the same in magnitude as that of 12C. Quasi-free spectra of the reaction were calculated using the elementary amplitudes given by the Kaon-MAID (kMAID) and Saclay-Lyon A (SLA) models and were compared with the present experimental data. Both models explain the spectra in the threshold region reasonably well, though the SLA model can better account for the excess of the measured cross section in the low momentum region compared with the kMAID calculation. It possibly suggests that reaction is more backward peaked in the center-of-mass frame. The present data provide the first information on the unique strangeness photo-production in the neutral channel and demonstrate the importance of the reaction for the investigation of the strangeness photo-production. Further measurements with a deuterium target is underway.
Acknowledgment
The authors thank the scientific and technical staffs of LNS for the operation of the accelerator and experimental supports. They are grateful to Prof. K. Maruyama and Prof. H. Okuno for their help to move over the TAGX spectrometer from INS to Tohoku University. They also thank Dr. T. Mart for the useful discussion and offering the program code. This work is supported by Grant-In-Aid for Scientific Research from The Ministry of Education of Japan, Nos. 09304028, 12002001 and 16GS0201. T.T. acknowledges the support from Grant-In-Aid for Scientific Research from The Ministry of Education of Japan, No. 14740150. P.B. and M.S. acknowledge support from Grant Agency of the Czech Republic, Grant No. 202/05/2142.
References
- [1] M. Q. Tran et al., Phys. Lett. B 445 (1998) 20.
- [2] T. Mart, C. Bennhold, Phys. Rev. C 61 (1999) 012201(R).
- [3] S. Janssen, J. Ryckebusch, D. Debruyne, and T. V. Cauteren, Phys. Rev. C 65 (2001) 015201.
- [4] J. W. C. McNabb et al., Phys. Rev. C69 (2004) 042201(R).
- [5] R. Bradford et al., Phys. Rev. C73 (2006) 035202.
- [6] K. H. Glander et al., Eur. Phys. J. A19 (2004) 251.
- [7] P. Bydžovský, and M. Sotona, Nucl. Phys. A754 (2005) 243c; A.V. Sarantsev et al., Eur. Phys. J. A25 (2005) 441; V. Shklyar et al., Phys. Rev. C72 (2005) 015210; T. Corthals et al., Phys. Rev. C73 (2006) 045207.
- [8] R. G. Zegers et al., Phys. Rev. Lett. 91 (2003) 092001; M. Sumihama et al., Phys. Rev. C 73 (2006) 035214; H. Kohri, Phys. Rev. Lett. 97 (2006) 082003.
- [9] X. Li, L.E. Wright and C. Bennhold, Phys. Rev. C45 (1992) 2011.
- [10] H. Yamazaki et al., Nucl. Instr. and Meth. A536 (2005) 70.
- [11] K. Maruyama et al., Nucl. Instr. and Meth. A376 (1996) 335.
- [12] S. Agostinelli et al., Nucl. Instr. and Meth. A506 (2003) 250.
- [13] H. Yamazaki et al., Phys. Rev. C 51 (1995) R1074.
- [14] R. A. Adelseck and L. E.Wright, Phys. Rev. C39 (1989) 580.
- [15] T. Mizutani et al., Phys. Rev. C58 (1998) 75.
- [16] R. A. Williams, Chueng-Ryong Ji, and S. R. Contanch, Phys. Rev. C46 (1992) 1617.
- [17] P. Bydžovský, M. Sotona, Nucl, O. Hashimoto, and T. Takahashi, nucl-th/0412035.
- [18] C. Bennhold, Nucl. Phys. A547 (1992) 79c.