Vertex reconstruction algorithms in the PHOBOS experiment at RHIC
Abstract
The PHOBOS experiment at the Relativistic Heavy Ion Collider (RHIC) at Brookhaven National Laboratory is studying interactions of heavy nuclei at the largest energies available in the laboratory. The high multiplicity of particles created in heavy ion collisions makes precise vertex reconstruction possible using information from a spectrometer and a specialized vertex detector with relatively small acceptances. For lower multiplicity events, a large acceptance, single layer multiplicity detector is used and special algorithms are developed to reconstruct the vertex, resulting in high efficiency at the expense of poorer resolution. The algorithms used in the PHOBOS experiment and their performance are presented.
keywords:
vertex reconstructionPACS:
07.05.Kf , 25.75.-q1 Argonne National Laboratory, Argonne, IL, USA
2 Brookhaven National Laboratory, Upton, NY, USA
3 Institute of Nuclear Physics PAN, Kraków, Poland
4 Massachusetts Inst. of Technology, Cambridge, MA, USA
5 National Central University, Chung-Li, Taiwan
6 University of Illinois at Chicago, Chicago, IL, USA
7 University of Maryland, College Park, MD, USA
8 University of Rochester, Rochester, NY, USA

1 Introduction
The PHOBOS experiment is studying Au+Au, Cu+Cu, d+Au and p+p collisions at the nucleon-nucleon center of mass energies from GeV to GeV (and GeV for protons). For an overview of results see [1], for the description of the detector see [2, 3]. General properties of these collisions are measured using a large acceptance multiplicity detector covering almost the full solid angle. About 50% of the produced particles are registered in the central, octagonal part of multiplicity detector (Fig. 1), whereas those emitted at smaller angles with respect to the beam line are detected in the multiplicity ring detectors placed a few meters from the nominal interaction point (not shown in Fig. 1). Detailed information on about 1% of the particles is obtained from a two-arm magnetic spectrometer. The position of the primary interaction is precisely reconstructed using a specialized vertex detector, which registers about 5% of the primary particles. At RHIC, the beams of ions collide at zero degree, thus the primary vertices are distributed in a wide range along the beam line (up to 2 m from the nominal interaction point) and only about 0.1 cm in the perpendicular direction. The relatively small acceptance of the vertex detector is sufficient for vertex reconstruction for events with large multiplicities, but does not allow to extend the analysis to more peripheral Au+Au collisions or to the interactions of lighter systems, especially p+p. Therefore, in order to improve the vertex determination efficiency and accuracy, several algorithms, presented in this paper, are needed using complementary information from different detector subsystems.
2 Vertex reconstruction algorithms
The scintillator counters of the trigger system (not shown in Fig. 1) deliver the first information on the position of the primary vertex. Two larger detectors, paddle counters, are placed symmetrically at = 3.2 m from the nominal interaction point, two smaller T0 counters are mounted around the beam pipe at = 5.3 m for most measurements (in p+p collisions they are moved closer, to = -1.3 m and = +2.5 m). The coincidence of the signals from these detector pairs on different -sides is used for triggering, but as the arrival times of produced particles are measured, the vertex position can be derived from the registered time difference. The error in the vertex position determination (about 5 cm) is small enough for an on-line vertex range selection, but it is not sufficient for data analyzes.
The vertex position in 3 dimensions () can only be obtained from tracks reconstructed in the PHOBOS spectrometer. It consists of 16 layers of silicon pad and strip sensors places inside the conventional 2 Tesla magnet. The design of the magnet ensures that the first 8 layers of spectrometer silicon sensors are in an area where the field is very weak. This allows easier reconstruction of the first segment of the particle trajectory as a straight line, which is then normally joined with a curved part of the track found in the remaining layers. The acceptance for the straight line segments is larger than that for the fully reconstructed tracks and the information on the curved part does not improve track extrapolation to the vertex, thus the straight lines are used in two algorithms of vertex reconstruction.
In the spectrometer 3D method, the vertex position is defined as the point for which the sum of distances from the extrapolated tracks is minimal. In an iterative procedure, tracks too distant from the calculated vertex (eg. secondary particles) are removed and the vertex is recalculated. The spectrometer 2D+1D algorithm enters the points of closest approach of all track pairs into 2-dimensional () and 1-dimensional () histograms. The coordinates of the maxima in both histograms define the approximate vertex position. The final vertex position is determined by the mean in , and of only those points compatible with the beam orbit and close enough to the approximate vertex. The sizes of the pads in the silicon sensors used for vertex reconstruction are relatively large (11 mm2 and 0.4276 mm2). This, together with small acceptance of the spectrometer, is responsible for the limited precision of the spectrometer methods.
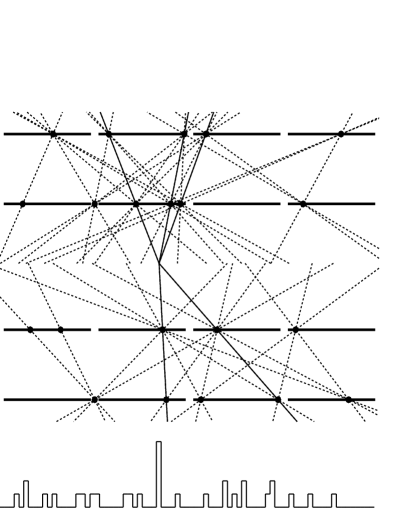
The PHOBOS vertex detector consists of two parts placed above and below the beam pipe, 25 cm long in , each with 2 layers of silicon sensors at about 5.7 cm and 11.8 cm from the beam. The sensors have strips 473 m wide and 1.2 or 2.4 cm long, perpendicular to the beam direction. The strips in the more distant outer layers are two times longer to cover the same azimuthal angle range. The design of the vertex detector limits the vertex reconstruction to and positions. In the vertex search all combinations of hits in the two layers are treated as track candidates and their extrapolated position at a fixed is histogrammed (Fig. 2). is defined by the position of the maximum of such a histogram. This procedure is repeated for several values of fixed . The value of for which the maximum of the histogram is the highest is used as final . To accept the maximum at least three track candidates contributing to it are required, since without this cut coincidences of two false track candidates are selected in low multiplicity events more frequently than the true vertex.
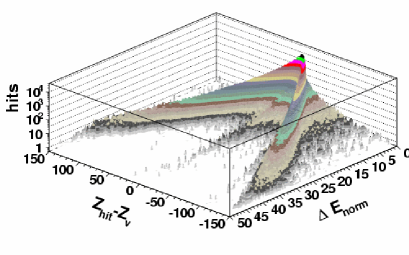
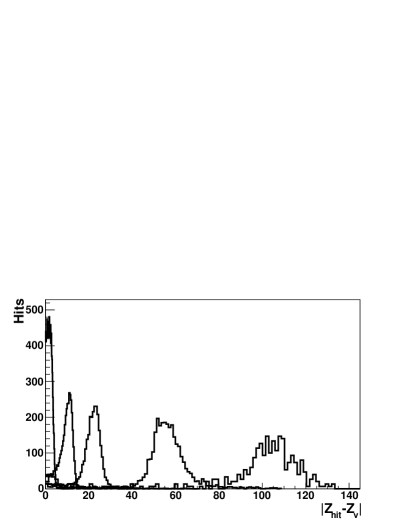
In PHOBOS, the largest fraction of primary particles is registered in the octagonal multiplicity detector consisting of 92 silicon sensors with 0.270.86 cm2 pads. Their thickness varies from 0.305 mm to 0.338 mm. The sensors are placed around the beam pipe at radii of about 4.5 cm and cover the range from -55 cm to +55 cm. In this detector primary particles traverse only one silicon sensor and do not leave a track directly pointing to the vertex. However, the length of their trajectory inside the silicon (and thus the deposited ionization energy, ) depends on the angle at which they enter the sensor; for primary particles approximately the emission angle. In this way the measured energy loss is correlated with the distance of the hit from the vertex (Fig. 3). Most of the hits belong to one of the two ridges, symmetric with respect to = 0. The hits left by particles with very low momenta, which deposit much larger energy than the minimum ionizing particles, are visible at close to zero as a tail of large values. Because of the positive/negative ambiguity, the value of from a single hit can be used only to estimate the distance to the vertex or two alternative vertex positions. To determine the vertex position slices with fixed values are calculated from the 2-dimensional histogram shown in Fig. 3. Several examples of these histograms are shown in Fig. 4. Using such histograms the probability density function, , for a particle that loses the energy at the position to originate from the vertex at is calculated. This function is non-zero in two ranges, symmetric with respect to . For most registered primary particles the width of a single range is 3-6 cm, and useful information is provided by the hits at the distance up to 100 cm. For a single hit there is no way to select the correct range, and one needs an overlap of several ranges from more hits to find the correct vertex position. The position of the vertex is determined by maximizing the product of the probabilities of all hits in the octagonal multiplicity detector.
3 Vertex reconstruction quality
In the analysis of the vertex reconstruction quality we will focus first on Au+Au collisions at the highest RHIC energy, = 200 GeV, using Monte Carlo simulations of the PHOBOS detector response based on GEANT 3.21 package [4].
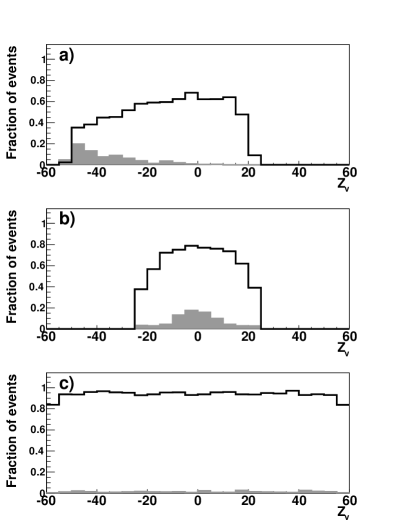
The PHOBOS vertex detector is optimized for measurements of collisions occurring close to the nominal interaction point (=0), but the acceptance of some of the reconstruction methods extends over much larger range (Fig. 5). The octagon method is the most efficient (about 95% for the inclusive sample of Au+Au collisions) and for all events, in which the vertex can also be reconstructed using other, less efficient methods, it returns the correct position. All methods are optimized to reconstruct the vertex even for events with small multiplicities, thus for a fraction of events they fail to find the correct vertex position. In the case of the spectrometer 2D+1D method that results in a larger than typical error, while the vertex detector method quite frequently finds a vertex close to =0 in the events, where the true is outside the acceptance of this detector. Fortunately, for the later case the octagon method gives a different vertex position and, thus, such events can be eliminated from the analysis.
| 15% most central | 30% most peripheral | ||||||
|---|---|---|---|---|---|---|---|
| Method | events | events | |||||
| eff. | |||||||
| Spec. 3D | 0.015 | 0.022 | 0.020 | 0.350 | 0.100 | 0.300 | 4% |
| Spec. 2D+1D | 0.025 | 0.022 | 0.030 | 0.150 | 0.150 | 0.250 | 7% |
| Vertex det. | - | 0.015 | 0.006 | - | 0.030 | 0.023 | 28% |
| Octagon | - | - | 0.500 | - | - | 1.100 | 85% |
The reconstruction error depends strongly on the multiplicity of the events, which becomes evident if from the sample of Au+Au collisions the most central and the most peripheral events are selected and separately analyzed (Table 1). In the first subsample all methods are 100% efficient and the vertex detector method is the most accurate in determining and . For peripheral events only the octagon method has a large efficiency (85%), whereas both spectrometer methods are inefficient (4-7%). The error of the vertex position increases for all methods, about a factor of 2 for the octagon and more than a factor of 10 for the spectrometer 3D method. The vertex detector method is able to reconstruct many more events than the spectrometer methods and still gives the most accurate vertex position.
In order to compare reconstruction results from Monte Carlo simulations and real data, we also calculate the values of for spectrometer 3D, spectrometer 2D+1D and octagon methods using events, in which all methods have found the vertex (about 50% of all Au+Au events). In the case of the spectrometer methods the errors agree very well. The error for the octagon method is about 20% smaller in the real data than in the simulations. This can be explained by an inaccurate description of the energy loss distribution or by a difference in the contribution of background particles in the GEANT simulations. Especially the slightly longer tails of the energy loss distributions in the simulations can lead to the observed larger error in the calculations of the octagon vertex position.
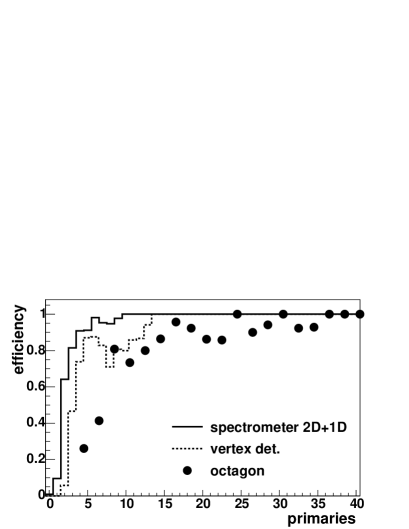
The efficiencies of the vertex reconstruction methods used in the PHOBOS experiment reflect the acceptance of the subdetectors used by the reconstruction algorithm, mentioned in the Introduction. To compare the “reconstruction power” of the methods using one, two or several layers of silicon we calculate their efficiencies as the function of the number of primary particles which point to the vertex and are registered in the appropriate subdetector (Fig. 6). The high quality of the information from reconstructed tracks causes that spectrometer 2D+1D method can find the vertex in more than 60% of events, in which only two primary particles traverse the spectrometer, and from 4 such tracks it is over 90% efficient. Interestingly, sometimes the vertex is also found in the events with only one primary particle, but then at least one non-primary particle, for example from a decay very close to the vertex, helped in the reconstruction. For the vertex detector method, as enforced by the reconstruction requirements, the minimal number of primary particles is 3 and 100% efficiency is reached for 15 such tracks. The octagon method needs at least 5 primary particles and is more than 80% efficient if 10 primary particles are registered in the octagonal multiplicity detector.
| Colliding | Efficiency | ||||
|---|---|---|---|---|---|
| System | [GeV] | spec. 2D+1D | vertex | octagon | |
| Au+Au | 200 | 947 | 64.2% | 76.8% | 94.4% |
| Au+Au | 19 | 322 | 57.5% | 72.7% | 89.3% |
| Cu+Cu | 200 | 296 | 49.0% | 64.9% | 88.9% |
| d+Au | 200 | 66 | 12.4% | 39.9% | 86.4% |
| p+p | 200 | 16 | 1.4% | 6.4% | 53.4% |
Finally, it is worth to mention the overall efficiency of the vertex reconstruction methods for different types of interactions measured by the PHOBOS experiment (Table 2). For collisions of heavier nuclei (Au+Au or Cu+Cu) the efficiencies of the precise spectrometer and vertex detector methods are close to 50% or higher. In the case that deuteron is one of the projectiles, the efficiency drops faster for the spectrometer method, and becomes very small for both methods in the case of p+p collisions. The octagon method has an efficiency of more than 86% for nucleus+nucleus and more than 50% for p+p interactions.
4 Summary
The PHOBOS experiment utilizes several vertex reconstruction algorithms, which use complementary information from different subdetectors. According to the design goals, a very precise vertex resolution is achieved in high multiplicity heavy ion collisions, but the limited acceptance of the spectrometer and vertex detector leads to low efficiency in peripheral Au+Au collisions, d+Au and p+p interactions. To overcome this problem a new, very efficient method of vertex reconstruction using hits from a single layer octagonal multiplicity detector is introduced. Even for low multiplicity events it efficiently finds the vertex with an error of about 1 cm. This method can either be used to verify doubtful results of the other algorithms or directly in studies, for which such precision is sufficient. Such procedure for testing the vertices from different methods is implemented in the PHOBOS experiment software. It rejects wrong reconstruction results and calculates the most accurate vertex position.
Acknowledgments
This work was partially supported by U.S. DOE grants
DE-AC02-98CH10886,
DE-FG02-93ER40802,
DE-FC02-94ER40818, DE-FG02-94ER40865,
DE-FG02-99ER41099, and
W-31-109-ENG-38, by U.S.
NSF grants 9603486, 0072204, and 0245011, by Polish KBN grant 1-P03B-062-27(2004-2007),
by NSC of Taiwan Contract NSC 89-2112-M-008-024, and
by Hungarian OTKA grant (F 049823).
References
- [1] B.B.Back et al., Nucl. Phys. A757, 28 (2005)., nlcl-ex/0410022.
- [2] B.B.Back et al., Nucl. Instr. Meth. A499, 603 (2003).
- [3] R.Nouicer et al., Nucl. Instr. Meth. A461, 143 (2001).
- [4] R. Brun et al., GEANT 3.21, Detector Description and Simulation Tool, CERN Program Library Long Write-up W5013, 1994.