Present address: ]University of North Carolina at Wilmington, Wilmington, North Carolina 28403 Present address: ]University of Virginia, Charlottesville, Virginia 22903 Present address: ]Brookhaven National Laboratory, Upton, New York 11973 Present address: ]Seoul National University, Seoul, 151-747 Korea Present address: ]University of Canterbury, Christchurch, New Zealand Present address: ]Thomas Jefferson National Accelerator Facility, Newport News, Virgina 23606 Present address: ]Indiana University Cyclotron Facility, Bloomington, Indiana 47408 Present address: ]Duke University, Durham, North Carolina 27708 Present address: ]Duke University, Durham, North Carolina 27708 Present address: ]Thomas Jefferson National Accelerator Facility, Newport News, Virgina 23606 Present address: ]The Enrico Fermi Institute, University of Chicago, Chicago, Illinois 60637 Present address: ]IN2P3/CNRS, Université Bordeaux, F-33175 Gradignan Cedex, France Present address: ]Bookham Inc., San Jose, California 95134 Present address: ]Siimpel Corp., Arcadia, California 91006 Present address: ]Thomas Jefferson National Accelerator Facility, Newport News, Virgina 23606 Present address: ]Kyushu Institute of Technology, Kitakyushu 804-8550, Japan Present address: ]Duke University, Durham, North Carolina 27708 Present address: ]Istituto Nazionale di Fisica Nucleare, Sezione di Pisa, I-56100 Pisa, Italy Present address: ]University of Pennsylvania, Philadelphia, Pennsylvania 19104 Present address: ]University of Virginia, Charlottesville, Virginia 22903 Present address: ]University of Winnipeg, Winnipeg, Manitoba R3B 2E9, Canada Present address: ]Pacific Northwest Laboratory, Richland, Washington 99352 Present address: ]United States Naval Academy, Annapolis, Maryland 21402 Present address: ]Renaissance Technologies Inc., Stony Brook, New York 11790 Present address: ]Center for Astrophysics, Harvard University, Cambridge, Massachusetts 02138 Present address: ]Harmonic Inc., Sunnyvale, California 94089 Present address: ]Thomas Jefferson National Accelerator Facility, Newport News, Virgina 23606 Present address: ]Hampton University, Hampton, Virginia 23668 Present address: ]University of Virginia, Charlottesville, Virginia 22903 Present address: ]The George Washington University, Washington, District of Columbia 20052 Present address: ]Virginia Polytechnic Institute, Blacksburg, Virginia 24061 Present address: ]RightAnswers LLC, Clark, New Jersey 07066 Present address: ]MIT-Lincoln Laboratory, Lexington, Massachusetts 02420 Present address: ]University of Richmond, Richmond, Virginia 23173 Present address: ]Renaissance Technologies Inc., Stony Brook, New York 11790 Present address: ]Duke University, Durham, North Carolina 27708 Present address: ]Indiana University Cyclotron Facility, Bloomington, Indiana 47408 Jefferson Lab E95-001 Collaboration
Extraction of the Neutron Magnetic Form Factor from Quasi-elastic at (GeV/c)2
Abstract
We have measured the transverse asymmetry in the quasi-elastic process with high precision at -values from 0.1 to 0.6 (GeV/c)2. The neutron magnetic form factor was extracted at -values of 0.1 and 0.2 (GeV/c)2 using a non-relativistic Faddeev calculation which includes both final-state interactions (FSI) and meson-exchange currents (MEC). Theoretical uncertainties due to the FSI and MEC effects were constrained with a precision measurement of the spin-dependent asymmetry in the threshold region of . We also extracted the neutron magnetic form factor at -values of 0.3 to 0.6 (GeV/c)2 based on Plane Wave Impulse Approximation calculations.
pacs:
13.40.Gp, 24.70.+s, 25.10.+s, 25.30.FjI introduction
The electromagnetic structure of the nucleon has long been a topic of fundamental interest in nuclear and particle physics. First-order nucleon electromagnetic properties are commonly parameterized in terms of elastic form factors gao_review . At low values of four-momentum transfer squared, , these functions have a simple interpretation as the Fourier transforms of the nucleon charge and magnetization densities in the Breit frame. Their precise experimental determination is important both for testing fundamental theories of hadron structure and for the analysis of other experiments in the field, such as parity violation measurements sample ; happex that are designed to probe the strangeness content of the nucleon.
The proton form factors have been determined with good precision at low using Rosenbluth separation of elastic electron-proton cross sections, and more recently at higher using a polarization transfer technique jones ; gayou . The neutron form factors are known less well because of the zero electric charge of the neutron, causing its electric form factor to be small, and experimental complications such as the lack of free neutron targets and difficulties associated with neutron detectors.
Over the past two decades, with the advent of much improved experimental facilities, the precise measurement of both the neutron electric form factor, , and the magnetic form factor, , has become a focus of activity. Until recently, most data on had been deduced from elastic and quasi-elastic electron-deuteron scattering. Inclusive measurements of this type suffer from large theoretical uncertainties due in part to the deuteron model employed and in part to corrections for final-state interactions (FSI) and meson-exchange currents (MEC). The sensitivity to nuclear structure is reduced by measuring the neutron in coincidence, 2H Mark93 , and, further, by taking the ratio of cross sections of 2H to 2H at quasi-elastic kinematics Ankl94 ; Brui95 ; Schoch2000 ; Ankl98 ; Kubon2002 . Uncertainties of less than 2% in have been achieved in the region (GeV/c)2 using the latter technique Ankl98 ; Kubon2002 . Despite this high precision, there is significant disagreement between the results of Mark93 ; Brui95 ; Schoch2000 and those of the more recent experiments Ankl94 ; Ankl98 ; Kubon2002 of up to 10% in the absolute value of . An explanation has been suggested in jourdan , but the issue has remained contentious.
To clarify the situation experimentally, additional data on , preferably obtained using a complementary method, are highly desirable. Inclusive quasi-elastic scattering provides such an alternative approach Blankleider84 . In contrast to deuterium experiments, this technique employs a different target and relies on polarization degrees of freedom. It is thus subject to completely different systematics. On the other hand, due to the more complex physics of the three-body system, the precise extraction of nucleon form factors from polarized 3He measurements requires careful modeling of the nuclear structure and of the reaction mechanism. Recent advances in Faddeev calculations Faddeev61 ; Golak01 ; golak2 have brought theoretical uncertainties of 3He models sufficiently under control to allow such studies in the non-relativistic kinematic regime. A precision comparable to that of the deuterium ratio experiments can be achieved using the polarized 3He technique Xu2000 .
The use of polarized 3He targets was pioneered at MIT-Bates Gao94 ; Jones93 ; Thompson92 ; Hansen95 and Mainz Meyerhoff94 . In Gao94 , was extracted for the first time from quasi-elastic inclusive scattering from polarized 3He, although with a large statistical uncertainty.
In this paper, we report on the first precision measurement of the so-called transverse asymmetry , which is sensitive to , in the inclusive reaction . The results were obtained in Hall A at the Thomas Jefferson National Accelerator Facility (Jefferson Lab). Brief reports of these data have appeared previously Xu2000 ; Xu2003 ; xiong . This paper presents the data analysis and evaluation of model uncertainties in much more detail. In addition, the analysis has been slightly refined. The results presented here are final.
The neutron magnetic form factor was extracted at to (GeV/c)2 in steps of 0.1 (GeV/c)2 Xu2000 ; Xu2003 . In addition, high-precision asymmetry data in the 3He breakup region were obtained at -values of 0.1 and 0.2 (GeV/c)2 xiong . The threshold data provide a stringent test of the above-mentioned Faddeev calculations because they cover a kinematical region where the proper treatment of the reaction mechanism is particularly important.
At the and (GeV/c)2 kinematics, was extracted using a state-of-the-art Faddeev calculation Golak01 . At these low , relativistic effects are small, and the non-relativistic Faddeev results have been shown to be in good agreement with a diverse set of few-body data, including our own 3He breakup threshold data xiong . On the other hand, the extraction of from our 3He asymmetry data at higher values of with the same precision as that achieved at low would require a more advanced theory that includes both an accurate treatment of reaction mechanism effects (FSI and MEC) and proper relativistic corrections (and possibly other refinements, such as -isobar excitations, presumed to be small at our kinematics). Unfortunately, such a comprehensive calculation is not available at the present time, and efforts to extend the theory are only in the beginning stages. For example, full inclusion of FSI has been investigated for the two-body channel in Kievsky04 . The Hannover group has carried out a coupled-channel calculation of that accounts for FSI and -isobars SauerFSI04 , unfortunately also with limited success at higher . Nonetheless, we observe that the size of FSI and MEC corrections to inclusive scattering data near the top of the quasi-elastic peak has been predicted to diminish sharply with increasing momentum transfer JRA ; Pace91 ; Benhar99 ; Arenhovel93 . Hence, it appears likely that the Plane Wave Impulse Approximation (PWIA), in which the knocked-out nucleon is described by a plane wave while the spectator pair is fully interacting, is reasonably accurate at the higher -values of this experiment. A quantitative estimate of the -behavior of deviations from the PWIA, in particular of the size of FSI corrections, could be obtained by performing a -scaling analysis on the present 3He asymmetry data Ciofi91 . Such an analysis may be carried out in a future publication.
Taking the pragmatic point of view that the PWIA is currently the best available theory describing inclusive quasi-elastic scattering from polarized 3He at (GeV/c)2, we have extracted from our higher data Xu2003 using PWIA. While we do not attempt to go beyond the PWIA by computing corrections for the various effects omitted in this approximation, we provide estimates of the uncertainties of the results in considerable detail. Despite the relatively large theoretical uncertainties in this approach, our results are in good agreement with the recent deuterium ratio measurements from Mainz Ankl98 ; Kubon2002 in the same -region.
II Theory
II.1 Spin-dependent Inclusive Electron Scattering
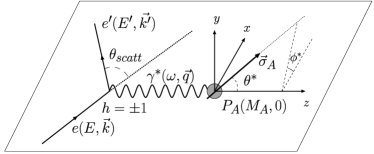
Figure 1 depicts inclusive scattering of longitudinally polarized electrons from a polarized nuclear target. The four-momentum of the electrons before and after the reaction is and , respectively. The four-momentum transfer to the target is , with the usual definition .
The experiment measured the spin-dependent asymmetry , where is the differential cross section for quasi-elastic scattering of electrons with helicity from polarized 3He. It can be expressed in terms of nuclear response functions, , and kinematic factors, , as donnelly1
| (1) |
where and are the polar and azimuthal angles of the target spin direction with respect to the three-momentum transfer vector, , as shown in Figure 1. By choosing = or , one can select the transverse asymmetry, , or the longitudinal-transverse asymmetry, .
The nuclear response functions for inclusive quasi-elastic scattering have been obtained through both PWIA and Faddeev calculations. These calculations will be discussed briefly next.
II.2 Plane Wave Impulse Approximation
In the PWIA, it is assumed that a single nucleon within the target nucleus completely absorbs the momentum of the virtual photon and leaves the interaction region as a plane wave. The remaining two-nucleon subsystem still undergoes interaction. Exchange current effects are ignored. The target nucleus, in our case 3He, however, is described by the solution of the Schrödinger equation with realistic nuclear forces. Relativistic effects are included by using relativistic energy conservation and a relativistic electron-nucleon cross section.
The nuclear current tensor is calculated as the product of the nucleonic current tensor and the nuclear spectral function, which contains the nuclear structure information (see for example Kievsky97 ; Ciofi93 ; Ciofi95 ; schulze1 ). The spin-independent part of the spectral function has the well-known interpretation as the probability of finding a nucleon of certain momentum and isospin in the target nucleus hajduk1 . The PWIA formalism available in the literature is largely but not necessarily fully covariant.
Expressions for the matrix elements of the nucleonic current tensor and the spin-dependent nuclear spectral function have been derived in schulze1 . The spectral function can be computed numerically from the nuclear wave function, which in turn can be obtained from a model of the nucleon-nucleon (NN) potential. With the nucleonic current tensor and the nuclear spectral function at hand, expressions for the functions , required in (1), can be derived and evaluated numerically schulze1 .
II.3 Non-relativistic Faddeev Calculation

In the Faddeev approach Faddeev61 , the coordinate-space Schrödinger equation for three nucleons with two-nucleon interactions is decomposed into three separate equations carlson1 . In momentum space, the three Faddeev equations can be written as three integral equations. The kernel in each equation involves only the interaction between one pair of the nucleons. Solutions are obtained numerically. The Faddeev decomposition of the three-body (and four-body) problem has proven to be a very useful computational tool in studies of light nuclei.
With regard to 3He, the Faddeev formalism has been applied to unpolarized and electrodisintegration ishikawa1 ; golak2 with full inclusion of all final-state rescattering processes. This calculation was subsequently extended to electrodisintegration of polarized 3He ishikawa2 . A further extension was made by including proper treatment of meson-exchange currents Golak01 according to the Riska prescription riska1 , which relates NN forces and meson-exchange currents in a model-independent manner through the continuity equation. In Golak01 , only the dominant - and -like meson exchange terms shown in Figure 2 were considered. The effect of currents has also been studied and found to be small (see Section V.2).
The derivation of the nuclear response functions in the Faddeev approach is described further in ishikawa2 . In this work, the resulting expressions were evaluated numerically using the framework of Golak01 for a large number of kinematical points corresponding to the acceptance regions covered by the experiment. The underlying 3He wave function was obtained using the BonnB NN potential bonnb . Again, the Höhler parameterization hoh was used to model the nucleon elastic form factors. The Faddeev calculation does not include relativistic effects.
II.4 Extraction of the Neutron Magnetic Form Factor
Because the 3He nuclear spin is carried mainly by the neutron, the spin-dependent response functions and can be expected to contain a large if not dominant neutron contribution at quasi-elastic kinematics Blankleider84 . Comparison of Equation (1) with the corresponding expression for scattering from a free nucleon leads to the expectation (within PWIA) that
| (2) | |||||
| (3) |
where and are the effective polarizations of the neutron and the protons, respectively, in 3He. Because the proton spins largely cancel, we have . Effective polarizations have been calculated e.g. in Friar90 ; Kievsky97 ; Ciofi93 . Since , the proton contribution to the transverse response is small, and hence is essentially proportional to . Based on these arguments, the asymmetry defined in (1) can be written as a function of the neutron magnetic form factor,
| (4) |
where and at low where the above assumptions hold. By comparing data with predictions for from a calculation, one can extract . The detailed procedure will be discussed in Section VI.
For completeness we mention that, because , the proton contribution to the transverse-longitudinal response, , may be dominant despite the small effective proton polarization. Thus inclusive scattering from polarized 3He is not a promising technique to measure the neutron electric form factor, Hansen95 ; Golak2002 .
III Experiment
III.1 Overview & Kinematics
The experiment, E95-001, was performed in Hall A at Jefferson Lab using a continuous-wave electron beam of 15 A current and 70% longitudinal polarization, incident on a high-pressure polarized 3He gas target. The beam energies were 778 and 1727 MeV.
Electrons scattered from the target were detected by two high-resolution spectrometers (HRS) positioned on the left and right-hand side of the beam line, respectively. Both spectrometers were configured for electron detection and for independent operation (single-arm mode). The “electron spectrometer” on the left side of the beam performed the main physics measurement of inclusive scattering at six different quasi-elastic kinematics. The second HRS, the “hadron spectrometer” to the right of the beam, detected elastic scattering and provided continuous high-precision monitoring of beam and target polarizations. The kinematic settings are listed in Table 1.
Electron arm (quasi-elastic)
| (GeV/c)2 | (GeV) | (GeV) | (deg) |
|---|---|---|---|
| 0.1 | 0.778 | 0.717 | 24.44 |
| 0.193 | 0.778 | 0.667 | 35.50 |
| 0.3 | 1.727 | 1.559 | 19.21 |
| 0.4 | 1.727 | 1.506 | 22.62 |
| 0.5 | 1.727 | 1.453 | 25.80 |
| 0.6 | 1.727 | 1.399 | 28.85 |
Hadron arm (elastic)
| (GeV/c)2 | (GeV) | (GeV) | (deg) |
|---|---|---|---|
| 0.1 | 0.778 | 0.760 | 23.73 |
| 0.2 | 1.727 | 1.691 | 15.04 |
III.2 Polarized Electron Source & Beam Line
The electron beam originated from a laser-driven “strained” GaAs source Alley95 ; Prepost95 . Polarized electrons were produced by illuminating a GaAs crystal in ultra-high vacuum with high-intensity circularly polarized laser light and removing electrons excited within the crystal by a strong external electric field. The polarization of the laser light was controlled electronically with the help of a Pockels cell. In this way, the electron beam helicity could be reversed rapidly (typically at 30 Hz), minimizing systematic errors in the measurement of spin-dependent asymmetries. To reduce systematic errors further, the overall sign of the beam helicity was reversed periodically by inserting a half-wave plate into the injector laser light path.
The standard Hall A beam line instrumentation and beam raster halla_NIM was employed. The beam energy was determined with an accuracy of better than 0.1% for all kinematics.
III.3 Polarized 3He Target
The experiment employed an optically-pumped polarized 3He gas target halla_NIM of the spin-exchange type Bouchiat60 . The target cell of this system contained high-pressure ( 10 atm) 3He gas as well as admixtures of rubidium (to facilitate optical pumping) and nitrogen (to quench radiation trapping). While background from the rubidium was negligible, the nitrogen admixture contributed on the order of to the total target number density, requiring a small dilution correction (see Section IV.3).
The target cell proper was a 40 cm long aluminum-silicate glass cell () with mm thick walls and m thick end windows. A second target cell, the so-called reference cell, was available for calibration measurements. The reference cell had essentially the same dimensions as the target cell, except that it had no thin end windows but rather a uniform glass thickness throughout. Further details can be found in Steffen2000 ; Ioannis2001 .
A typical 3He nuclear polarization of 40% was achieved. The target spin direction was either or in the laboratory. (The difference of the two angles was not exactly 180∘ because of a calibration inaccuracy.) The target spin was reversed regularly throughout the experiment to reduce systematic errors from false asymmetries.
III.4 Spectrometers
The two spectrometers were equipped with their standard detector packages halla_NIM consisting of a pair of Vertical Drift Chambers (VDCs) for tracking, two segmented scintillator planes to generate the trigger and provide time-of-flight information, and a CO2 gas Cherenkov detector for electron/pion separation. The HRSs had a usable momentum acceptance of approximately 9%. For further pion rejection, a preshower and a total-absorption shower counter were employed in the electron-arm HRS, while the hadron-arm HRS was instrumented with two thin lead-glass shower counters. The geometric solid angle of each HRS was limited to 6.0 msr by a rectangular tungsten collimator. The central scattering angle was surveyed to better than 0.1 mrad.
Trajectories of scattered particles were reconstructed using the VDC data and the standard optics model of the HRS halla_NIM . The achieved momentum and scattering angle resolutions () were better than 0.05% and 2 mrad, respectively. The transverse (i.e. along the beam) position resolution at the target was approximately 2 mm.
The pion rejection factor with the Cherenkov detectors alone was of order 100. Combining the Cherenkov and shower counters, a factor of over 1000 was achieved. Pion rejection was only a concern with the left-arm HRS, where pion production was not kinematically suppressed.
IV Analysis
IV.1 Overview
The experimental raw asymmetry was calculated as
| (5) |
where and are the electron yields normalized by charge and electronic live time for positive and negative electron helicities, respectively.
To extract the physics asymmetry, corrections had to be made for dilution, background, radiative effects, and bin centering. Sources of dilution were the finite beam and target polarizations, and scattering from the target walls and from the nitrogen gas in the target. Polarized background arose from the elastic radiative tail, which extended into the quasi-elastic region. Radiative corrections had to be applied to the raw quasi-elastic asymmetry. Bin centering corrections account for finite experimental acceptances.
The normalized yields in (5) can be written as
| (6) |
where , , , and are the contributions of quasi-elastic scattering from 3He (before radiative and bin centering corrections), the elastic radiative tail, target wall (“empty target”) scattering, and scattering from nitrogen in the target cell, respectively. Using (6), one can define dilution factors for each of the three background contributions,
| (7) | |||||
| (8) | |||||
| (9) |
and express the physics asymmetry as
| (10) | |||||
where is the product of beam and target polarizations, is the asymmetry of the elastic radiative tail, is the radiative correction to the quasi-elastic asymmetry, and , the bin centering correction. In Equation (10), it is assumed that both the empty target and the contributions have no asymmetry. During the analysis, the empty target and N2 false asymmetries were verified to be indeed consistent with zero.
Among the various factors in (10), , , and could be determined directly from data, while , , and had to be determined from calculations or simulations. was monitored continuously during the experiment via elastic polarimetry and was determined as the ratio between the measured elastic asymmetry and the simulated elastic asymmetry, as described in Section IV.5.
IV.2 Raw Asymmetries
Raw asymmetries for both spectrometers were calculated according to Equation (5). The quasi-elastic data were analyzed in terms of electron energy loss, , and grouped in bins of 10, 20, or 18.75 MeV width, depending on . The elastic data from the right-arm spectrometer were analyzed in terms of excitation energy, defined as
| (11) |
where is the mass of the 3He nucleus and the measured electron scattering angle. The raw elastic asymmetry was obtained from the region .
The angle between momentum transfer and target spin, in Equation (1), varied between 0.2∘ and 10.0∘ depending on . This resulted in an contribution to the experimental asymmetry of less than 2%, as estimated by a PWIA calculation. The contribution is included in the theoretical calculations that were used to extract . Even though theoretical predictions of are less accurate than those of (because of the uncertainty in ), the uncertainty in our extracted due to is negligible.
Raw asymmetries obtained for the four different combinations of of target spin orientation and overall beam helicity sign were compared to check for false asymmetries. No statistically significant false signal was found. For the main physics analysis, data from the four polarization configurations were combined to minimize the statistical uncertainty.
IV.3 Empty Target and Nitrogen Dilution Factors
Because the target cell was sealed, background from the target cell wall could not be measured directly by emptying the target. In addition, the background rate from the nitrogen buffer gas in the target could not be easily calculated because the nitrogen partial pressure could only be determined approximately when the cell was filled. Therefore, it was necessary to determine both background yields in separate calibration runs with the reference cell.
For each kinematics, quasi-elastic data were taken with the reference cell empty and filled with N2 at several pressure values. The reference cell nitrogen yield as a function of nitrogen pressure was determined by subtracting the empty cell yield from the raw yields of the nitrogen runs. As the reference cell had physical dimensions very similar to those of the target cell, the reference cell nitrogen spectra could be used as a direct measure of the target cell nitrogen yield, , provided that they were scaled to the nitrogen pressure inside the target cell.
The nitrogen partial pressure in the 3He target cell was determined as follows: As shown in Figure 3, the elastic nitrogen peak was clearly resolved in both the reference cell nitrogen spectrum (upper panel) and the spectrum from the 3He target cell (lower panel), as measured with the right-arm spectrometer. As the nitrogen pressure corresponding to the reference cell spectrum was known, the nitrogen pressure in the target cell could be determined by simple scaling. This procedure was only required for one kinematic setting since the nitrogen pressure was essentially constant throughout the experiment. The result was kPa. The variation of the N2 yield as a function of time was found to be within %. We assigned an overall uncertainty of 5% to the measured nitrogen background yields.
Obtaining the empty target yield (i.e. the yield due to scattering from the 3He target cell walls) from the empty reference cell data was complicated by two factors: (1) the background yield from the cell walls was a function of beam position and the beam tune, and thus reference cell runs did not necessarily reflect the exact background conditions present during production data taking; and (2) the reference cell glass wall thickness and density were not equal to those of the target cell.
Regarding (1), the variation of the empty target yields obtained under nominally identical experimental conditions but at different points in time were compared and found to agree within %.
Regarding (2) we note (a) the target and reference cells were made of different types of glass, where the target cell glass density was about 9% larger than that of the reference cell; (b) the thickness of the reference cell side walls was found to be, on average, 2.5% thinner than that of the target cell, as determined by laser interferometry xu_thesis ; and (c) the target cell had very thin (135 m) end windows, while the corresponding reference cell end windows were about as thick (1.2 mm) as its side walls. End window contributions were minimized by using software cuts. The residual contribution of the thick end windows tends to compensate the effect of the thinner and less dense glass walls of the reference cell, although this is difficult to quantify. Hence, we assumed that the empty cell background yield of the 3He target was identical to that of the empty reference cell (without the need for an explicit correction for the different cell properties) and assumed an overall systematic uncertainty of 25% in the empty yield, taking into consideration the statistical uncertainty, the time variation of the yield due to beam tune variations, and the differences in the cell properties.
The empty target cell and the N2 dilution factors ( and ) were determined by combining all empty target and nitrogen runs, respectively, at the same kinematics. The nominator in Equations (7) and (8) was calculated according to (6) as . The time variation of the yields was included in the systematic uncertainty of each contribution. The uncertainties are given in Table 3.

3He

An ad-hoc upward correction of all the empty target dilution factors by a factor of 2, which was used in our prior publications xu_thesis ; Xu2000 ; Xu2003 , was dropped in this analysis as it had been motivated by an unphysical tail of apparently poorly reconstructed events seen in the right-arm spectrometer. Instead, a more conservative uncertainty was assigned to the empty target background subtraction at and (GeV/c)2, where the empty target background is largest.
IV.4 Monte Carlo Simulation
A full Monte Carlo simulation was developed for this experiment xiong , which allowed averaging theoretical results over the experimental acceptances and accounted for multiple scattering, ionization energy loss, external bremsstrahlung, and internal radiative corrections.
To calculate the spin-dependent elastic and quasi-elastic radiative tails, internal radiation effects were modeled using the covariant formalism developed in aku1 , generalized to the case of low- quasi-elastic scattering. This formalism accommodates polarization degrees of freedom. Standard, unpolarized radiative corrections schwinger1 were applied to the elastic peak region.
IV.5 Elastic Polarimetry
| (GeV/c)2 | (GeV/c)2 | / in | / out | / in | / out |
|---|---|---|---|---|---|
| 0.1 | 0.1 | ||||
| 0.193 | 0.1 | ||||
| 0.3 | 0.2 | ||||
| 0.4 | 0.2 | ||||
| 0.5 | 0.2 | ||||
| 0.6 | 0.2 | ||||
The beam and target polarizations, and , were monitored continuously during the experiment using elastic polarimetry. As the 3He elastic form factors, the charge form factor and the magnetic form factor , are known very well experimentally amroun2 , the 3He elastic asymmetry can be calculated as donnelly1
| (12) |
Here, the are kinematic factors, , and . To allow direct comparison with data, the Monte Carlo program described in Section IV.4 was used to average Equation (12) over the experimental acceptance. We then obtained
| (13) |
where and are the measured and simulated elastic asymmetry, respectively, and and are correction factors for the measured nitrogen and empty target cell dilution, respectively, for the elastic data sets.
The data for are listed in Table 2. Separate data are shown for each of the four possible spin and helicity configurations, which are largely consistent within their errors. For the evaluation of (13), the weighted average of the data for the four spin combinations was used. The dilution factors and were obtained using the procedure described in Section IV.3.
No radiative corrections were applied to the elastic data since most radiative effects were included in the simulation. Missing is the spin dependence of the Schwinger correction, which we deemed negligible.
At the two beam energies, and GeV, the overall relative systematic uncertainty in was 1.3% and 1.7%, respectively. In each case, the dominant contribution came from the uncertainty in the form factors and , followed by the contribution from the uncertainty in the target spin direction.
The average so obtained was , where the errors are statistical and systematic, respectively. As a cross check, independent measurements of the polarizations were obtained using Møller beam polarimetry and NMR target polarimetry, yielding an overall average value of Ozkul2000 . The elastic polarimetry results were used for further analysis and averaged for each quasi-elastic kinematic setting separately (cf. Table 2) to account for possible slow changes of the polarizations with time. The observed stability of the polarization data suggests that this procedure was adequate.
V Asymmetry Results
V.1 Quasi-elastic Transverse Asymmetry A
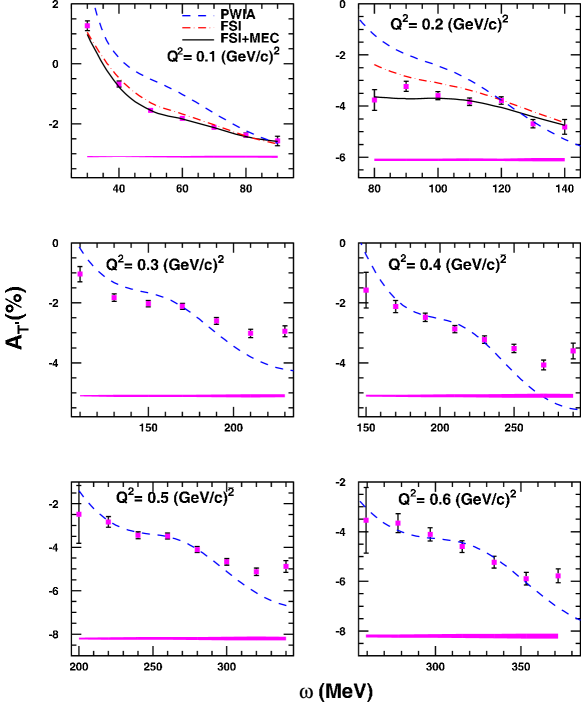
Results for the quasi-elastic transverse asymmetry at the six measured -points are shown in Figure 4. Numerical values can be found in xu_thesis . The errors on the data are statistical only, while the systematic uncertainty is shown as an error band at the bottom of each panel. A detailed breakdown of the systematic uncertainties is presented in Table 3. The experimental data were corrected for radiative effects, background, and dilution, as described in detail in the previous section.
Also shown in Figure 4 are the results of several calculations. Dashed lines represent the PWIA calculation Kievsky97 . The dash-dotted and solid curves at the two kinematics with lowest represent, respectively, Faddeev results with inclusion FSI only golak2 and with inclusion of both FSI and MEC corrections Golak01 . Calculation Golak01 will be referred to as the “full Faddeev calculation” in the following. All theory results were averaged over the spectrometer acceptances using the Monte Carlo simulation described in Section IV.4. Further details on the calculations are given in Section II.
One observes excellent agreement of the data with the full Faddeev calculation over the entire -range at and (GeV/c)2, while PWIA describes the data well at the higher , in particular in the region around the quasi-elastic peak (near the center of the -range in each panel).
V.2 Asymmetry in the Threshold Region
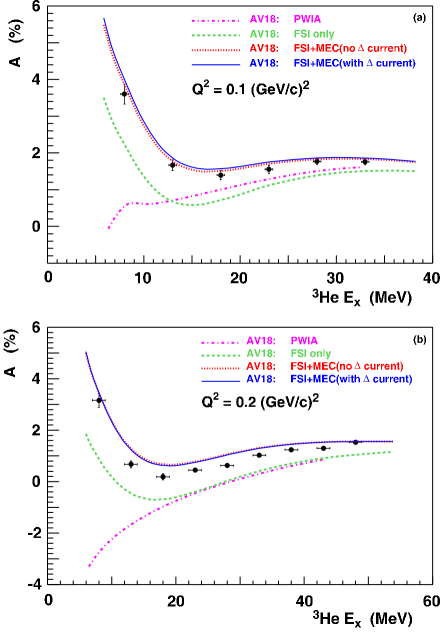
The asymmetries measured in the region around the two- and three-body breakup thresholds (5.5 and 7.7 MeV, respectively) are shown in Figure 5. These results provide a sensitive test of the quality of the Faddeev calculations.
The threshold asymmetry data were taken with the hadron-arm spectrometer as a by-product of the elastic polarimetry and were analyzed in the same manner as the quasi-elastic asymmetries. The kinematics are given in the lower panel of Table 1. The -values of 0.1 and 0.2 (GeV/c)2 in Figure 5 correspond to the momentum transfer at the elastic peak. The data are plotted as a function of the excitation energy, , defined in Equation (11). Horizontal errors represent the uncertainty in determining , which was dominated by the uncertainty in the beam energy. The vertical errors are the statistical and systematic errors added in quadrature. Tables of the data and uncertainties can be found in Feng2002 .
Figure 5 also shows various theoretical results. Dot-dashed lines depict those of the PWIA calculations Kievsky97 , while those of Faddeev calculations with FSI only golak2 appear as dashed lines. The “full Faddeev calculation”, which includes both FSI and MEC, but not the -isobar current, Golak01 is represented by dotted lines. The solid lines were obtained with the full calculation after including -isobar currents. These calculations employed the AV18 NN interaction potential. Results obtained with the BonnB potential were found to be only slightly different from the AV18 results and in even better agreement with the data xiong .
As can be seen, the agreement between PWIA calculations and the data is poor at both kinematics, which confirms the expectation that FSI and MEC corrections are essential in this region. Indeed, the inclusion of FSI improves the agreement significantly, and good agreement is achieved once MEC are added. It has been shown that substantial MEC are needed to describe the measured elastic electromagnetic form factors of three-nucleon systems amroun1 . The corresponding physics should extend into the low- region of inelastic scattering as well.
The good agreement between the full calculation and the data at = 0.1 (GeV/c)2 suggests that FSI and MEC are properly treated in the full calculation. The insensitivity of the results to the addition of -isobar currents implies a weak model dependence of the MEC corrections. The small, systematic discrepancy at = 0.2 (GeV/c)2 may indicate that some -dependent effects, such as relativistic and three-nucleon force effects, become important already at this momentum transfer.
VI Extraction of the Neutron Magnetic Form Factor
The neutron magnetic form factor, , can be extracted from the measured 3He quasi-elastic transverse asymmetry if a calculation is available that predicts as a function of . If we assume, following Equation (4), that the asymmetry is a function of , we can expand around a reference value, ,
| (14) | |||||
For ease of notation, we normalize all values to a convenient reference scale (the Höhler parameterization hoh in this case) so that . Equation (14) can be solved for , assuming the second-order term is small:
| (15) |
Here, is the measured asymmetry. The predicted asymmetry, , and the sensitivity factor, , are the output of the model calculation. The latter two parameters were determined using the full Faddeev calculation Golak01 for the lowest two points of this experiment, and the PWIA calculation Kievsky97 for the remaining four . Results were averaged over the experimental acceptance using the Monte Carlo program described in Section IV.4. At each kinematical point, asymmetries were generated for several -bins around the quasi-elastic peak. Within each bin, was varied around the reference value by adding a constant to the functional form given by the Höhler model.
was extracted for each -bin via (15). A different functional form, a general second-order expansion of , was also tried. The differences between the form factors extracted via these two methods was found to be negligible (%) for all kinematics xu_thesis
The final results were obtained by taking the weighted average of the values from the -bins closest to the quasi-elastic peak. The -region used for the extraction of covered a width of 30 MeV at and 0.2, 60 MeV at , 40 MeV at and 0.5, and 56.25 MeV at (GeV/c)2.
The extraction procedure gives rise to a systematic error due to the uncertainty in the experimental determination of the energy transfer ( MeV). The uncertainty in results in an uncertainty as to the -region over which to integrate the theoretical calculation used for the extraction of . A shift of bin boundaries generally translates into a different average value of for the bin and hence a different extracted value.
Furthermore, as can be seen in Figure 4, the theoretical calculations, especially PWIA, match the data best in the immediate vicinity of the quasi-elastic peak where corrections to the plane-wave picture are smallest, whereas deviations may occur off the peak. This can introduce an artificial -dependence into the extracted which goes beyond the effect of the kinematical variation of with . For this effect to be minimized, the bins used for the extraction should be centered around the quasi-elastic peak, assuming that deviations are distributed roughly symmetrically. The experimental uncertainty in may cause improper centering, resulting in a bias in extracting . The calculated uncertainties in resulting from the uncertainty in can be found in Table 5.
| Source | ||
|---|---|---|
| 1.3 | 1.7 | |
| Empty target subtraction | 1.0 | 0.25 |
| N2 background subtraction | 0.3 | |
| QE radiative correction | 0.3 | |
| Elastic radiative tail | 0.3 | |
| Spectrometer acceptance | 0.5 | |
| HC scintillator efficiency | 0.1 | |
| HC wire chamber efficiency | 0.1 | |
| HC computer deadtime | 0.1 | |
| HC beam current shift | 0.1 | |
| HC beam motion | 0.1 | |
| Pion contamination | 0.1 | |
| Total | 1.8 | 1.9 |
VII Estimate of Theoretical Uncertainties
VII.1 Nucleon-Nucleon Potential and Nucleon Form Factors
The effect of different NN potential models on the predicted asymmetry was studied by carrying out the full Faddeev calculation with the Argonne AV18 and the Bonn B NN potentials at several representative kinematics. In a similar manner, to estimate the uncertainty due to the elastic nucleon form factors other than , Faddeev calculations were performed in which these quantities were varied individually by their published experimental uncertainties. The resulting uncertainty in from these sources, when combined in quadrature, is less than 1% for all kinematics (cf. Table 5).
VII.2 Relativistic Effects
Since the full Faddeev calculation is non-relativistic, it was particularly important to estimate quantitatively the size of relativistic corrections. An approximate estimate can be obtained within PWIA, which is theoretically well understood. Standard PWIA calculations take most relativistic effects into account (cf. Section II.2). It is straightforward to modify the relativistic parts of the PWIA formalism to reflect the non-relativistic approximations made in the Faddeev formalism. The differences between the results of such a modified, non-relativistic PWIA calculation and the standard relativistic PWIA results provide an estimate of the error in the Faddeev results due to relativistic effects.
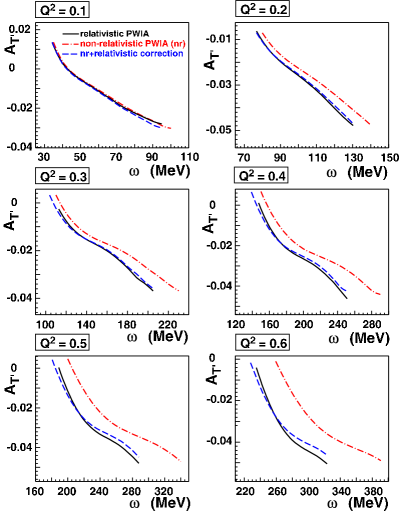
To this end, we modified three parts of the standard PWIA formalism: approximations were made to the relativistic kinematics, the phase space and the integral ranges of the Fermi momentum and the missing mass of the many-fold integration of the cross-section were changed according to the non-relativistic kinematics, and the relativistic hadronic current was translated into an approximate, non-relativistic form Jeschonnek98 ; Ritz97 . Among the three modifications, the change of the kinematics was found to dominate Donnelly .
With the PWIA results at hand, we developed a heuristic “recipe” Donnelly to allow an approximate correction of the Faddeev results for relativistic effects. The “recipe” could be readily applied to existing Faddeev results without the need for recomputation.
Results of these studies are shown in Figure 6. The three curves represent the original relativistic PWIA results (solid line), non-relativistic PWIA results obtained using the modifications described above (dot-dashed line), and non-relativistic PWIA results corrected for relativistic effects though the “recipe” (dashed line). As can be seen, the heuristic correction works well up to about (GeV/c)2.
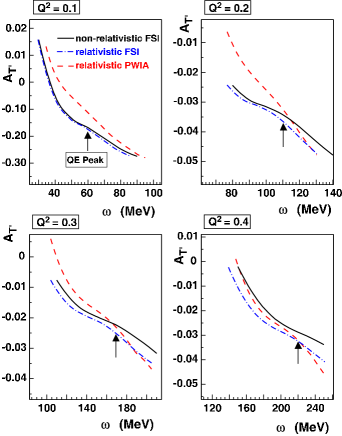
The acceptance-averaged difference between the relativistic and non-relativistic PWIA results at and 0.2 (GeV/c)2 was taken as the model uncertainty of the Faddeev results due to relativity.
VII.3 FSI & MEC
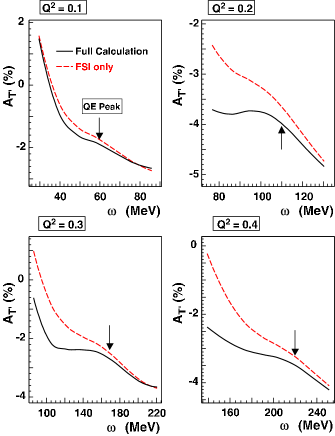
To estimate FSI contributions to , we carried out the Faddeev calculation up to (GeV/c)2 with the inclusion of FSI effects only. (Already at (GeV/c)2, the 3N center-of-mass energy is above the pion production threshold, and therefore the non-relativistic framework is no longer valid.) Next, we applied relativistic corrections to the Faddeev results using the ad-hoc prescription developed in Section VII.2. The “relativistic FSI” results so obtained were compared to the results of the standard (relativistic) PWIA calculation, as illustrated in Figure 7. The difference between the two calculations in the region around the quasi-elastic peak is a measure of the FSI effects at each point. For the two highest values, we extrapolated the FSI data using a purely empirical fit to the lower values, as shown in Figure 9(a). As expected JRA ; Pace91 ; Benhar99 , FSI effects decrease significantly as increases.
In a similar manner, we can estimate the size of MEC effects by comparing the Faddeev results with inclusion of FSI only, obtained in the FSI study above, to those of the full Faddeev calculation. Results are shown in Figure 8, and differences between the two calculations are plotted as solid triangles in Figure 9(b). As with FSI, we observe a sharp decrease of MEC corrections with increasing .
It is interesting to compare our results for the size of MEC corrections with those obtained from theoretical studies of quasi-elastic inclusive scattering from polarized deuterium, Arenhovel93 . The deuterium results are shown in Figure 9(b) as solid squares. As can be seen, the data are similar to those calculated for the corresponding reaction. Assuming a similar underlying physical mechanism, we use the MEC data from deuterium to estimate the size of MEC corrections to the data at the highest two values of our data set.
These studies provide rough estimates of the expected magnitudes of the respective effects. They are not reliable enough to be used to correct the PWIA results for FSI and MEC contributions. Consequently, we use the numbers obtained above as estimates of the model uncertainties inherent in the PWIA. We take the numbers as the 1 values of the uncertainties, which we assume to be symmetric. The resulting model uncertainties in are detailed in Table 5 and are propagated into the final errors given in Table 4.


| stat. | syst. | model | total | ||
| (GeV/c)2 | (%) | (%) | (%) | (%) | |
| 0.1 | 0.9481 | 1.36 | 1.08 | 2.2 | 2.8 |
| 0.193 | 0.9511 | 1.35 | 1.26 | 2.1 | 2.8 |
| 0.3 | 0.9577 | 1.35 | 1.86 | 5.3 | 5.8 |
| 0.4 | 0.9694 | 1.45 | 1.28 | 2.5 | 3.2 |
| 0.5 | 0.9689 | 1.35 | 1.25 | 2.1 | 2.8 |
| 0.6 | 0.9939 | 1.55 | 1.38 | 2.0 | 2.9 |
VII.4 Off-Shell Effects
Off-shell corrections to the single nucleon current, including the part of the current that describes polarization degrees of freedom Caballero93 , are purely relativistic in nature. While the PWIA calculation used here includes off-shell effects, they are ignored in the Faddeev calculation.
We estimated the magnitude of required off-shell corrections to the Faddeev results by comparing results of a modified version of the PWIA formalism that treats nucleons as on-shell Donnelly to those of the standard PWIA.
In addition, theoretical uncertainties due to different possible off-shell prescriptions were estimated using the difference of PWIA results obtained with the deForest CC1 and CC2 forms deForest83 . (The standard PWIA calculation employs CC1.) While this number represents a minimum uncertainty, as various other off-shell prescriptions are equally permissible Caballero93 , PWIA calculations using the CC1 form have been found to agree better with experimental data of unpolarized scattering than those using other prescriptions Kievsky97 . This suggests the use of the CC1 prescription as a reference in the polarized case as well.
Results are given in Table 5. Interestingly, off-shell effects dominate the model uncertainty in at the lowest two -values.
| systematic (%) | model (%) | |||||||||||||
| (GeV/c)2 | Total | NN | off-shell | FSI | MEC | 3BF | Coulomb | Relativity | Total | |||||
| 0.1 | 0.90 | 0.3 | 0.44 | 0.21 | 0.14 | 1.08 | 0.45 | 1.6 | 0.5 | 1.0 | 0.6 | 1.0 | 0.5 | 2.2 |
| 0.193 | 0.90 | 0.6 | 0.53 | 0.35 | 0.13 | 1.26 | 0.40 | 1.2 | 0.5 | 1.0 | 1.0 | 1.0 | 0.7 | 2.1 |
| 0.3 | 0.95 | 1.4 | 0.56 | 0.52 | 0.17 | 1.86 | 0.50 | 0.5 | 4.5 | 1.8 | 1.2 | 1.0 | 0.5 | 5.3 |
| 0.4 | 0.95 | 0.45 | 0.46 | 0.56 | 0.08 | 1.28 | 0.45 | 0.5 | 1.8 | 1.2 | 1.2 | 1.0 | 0.5 | 2.5 |
| 0.5 | 0.95 | 0.15 | 0.38 | 0.60 | 0.38 | 1.25 | 0.40 | 0.5 | 0.7 | 0.5 | 1.4 | 1.0 | 0.5 | 2.1 |
| 0.6 | 0.95 | 0.10 | 0.32 | 0.64 | 0.69 | 1.38 | 0.40 | 0.5 | 0.5 | 0.5 | 1.4 | 1.0 | 0.5 | 2.0 |
VIII Form Factor Results and Discussion
Numerical values for extracted in this work are given in Table 4 (in units of the empirical dipole parameterization, ) and shown in Figure 10 along with the existing world data set published since 1990 Mark93 ; Ankl94 ; Gao94 ; Brui95 ; Schoch2000 ; Ankl98 ; Kubon2002 . The error bars represent the total uncertainties reported by the respective experiments, including model uncertainties.
The results appear to be largely consistent, with the exception of the early 2H data from Bates Mark93 and the first 2HH ratio measurement from Bonn Brui95 ; Schoch2000 . The discrepancy of the data of these two experiments with the rest of the world data has been attributed to incomplete corrections for neutrons that miss the neutron detector jourdan . The data of the Bonn experiment Brui95 were re-analyzed subsequently Schoch2000 , resulting in a downward correction of the data. Figure 10 shows the re-analyzed data. We note the satisfactory agreement between the more recent, high-precision deuterium ratio measurements Ankl94 ; Ankl98 ; Kubon2002 and the data from this work. The agreement is well within the total uncertainties of the experiments, except at and (GeV/c)2, where the 3He results are low by about 5%.
Also shown in Figure 10 are several theoretical results: a recent dispersion-theoretical fit by Hammer and Meißner Hammer_Dispersion (solid curve), a chiral soliton model by Holzwarth Holzwarth (dotted curve), a relativistic baryon chiral perturbation theory calculation by Kubis and Meißner Kubis2001 (long-dashed curve), a vector meson dominance (VMD) fit by Lomon Lomon2002 (dashed-dotted curve), and a recent light-front quark model by de Melo et al. Salme2006 (short-dashed curve). It should be noted that all of these models contain one or more free parameters that have been fitted to existing data.
As can be seen, the dispersion-theoretical fit Hammer_Dispersion and the VMD fit Lomon2002 agree best with the data at (GeV/c)2, while the chiral perturbation theory (ChPT) results Kubis2001 and the chiral soliton model Holzwarth match the data better at lower . The ChPT model is expected to be good only up to (GeV/c)2, but clearly works very well in its region of validity. The light-front model of de Melo et al. Salme2006 arguably shows the best overall agreement. The models by Holzwarth Holzwarth , Lomon Lomon2002 , and de Melo et al. Salme2006 also describe the proton form factor ratio and other elastic nucleon form factors well in this -region.
IX Conclusions
In conclusion, we have determined the neutron magnetic form factor from quasi-elastic data. At of 0.1 and 0.2 (GeV/c)2, we used a state-of-the-art Faddeev calculation that includes FSI and MEC, and PWIA at four additional points between and 0.6 (GeV/c)2. The results agree within the total uncertainties with those obtained by several recent measurements on deuterium, except at and (GeV/c)2 where the 3He results are slightly low. A consistent picture of the behavior of in this -region is beginning to emerge, although further precision measurements as well as improved model calculations, such as the extension of the Faddeev formalism to higher in the case of polarized , remain highly desirable.
In addition, we have measured in the two- and three-body breakup threshold region at of 0.1 and 0.2 (GeV/c)2 where the sensitivity to FSI and MEC effects is particularly high. The results agree well with the predictions of the Faddeev model, especially at (GeV/c)2, confirming the validity of the treatment of FSI and MEC effects in this formalism.
Acknowledgements.
We thank the Hall A technical staff and the Jefferson Lab Accelerator Division for their outstanding support during this experiment. We also thank T. W. Donnelly for many helpful discussions. This work was supported in part by the US Department of Energy, DOE/EPSCoR, the US National Science Foundation, the Science and Technology Cooperation Germany-Poland and the Polish Committee for Scientific Research under grant no. 2P03B00825, the Ministero dell’Università e della Ricerca Scientifica e Tecnologica (Murst), the French Commissariat à l’Énergie Atomique, Centre National de la Recherche Scientifique (CNRS), Conseil Régional d’Auvergne, the Italian Istituto Nazionale di Fisica Nucleare (INFN), a grant of the European Foundation Project INTAS-99-0125, and by DOE contract DE-AC05-84ER40150, Modification No. M175, under which the Southeastern Universities Research Association (SURA) operates the Thomas Jefferson National Accelerator Facility. The numerical calculations were performed on the PVP machines at the US National Energy Research Scientific Computer Center (NERSC) and the CRAY SV1 of the NIC in Jülich.References
- (1) H. Gao, Int. J. Mod. Phys. E 12, no. 1, 1-40 (review) 2003.
- (2) D. H. Beck and R. D. McKeown, Ann. Rev. Nucl. Sci. 51, 189 (2001).
- (3) K. S. Kumar and P. A. Souder, Prog. Part. Nucl. Phys. 45, S333 (2000).
- (4) M. Jones et al., Phys. Rev. Lett. 84, 1398 (2000).
- (5) O. Gayou et al., Phys. Rev. Lett. 88, 092301 (2002).
- (6) P. Markowitz et al., Phys. Rev. C 48, R5 (1993); final results in P. Markowitz, Ph.D. thesis, College of William and Mary, November 1992.
- (7) E. E. W. Bruins et al., Phys. Rev. Lett. 75, 21 (1995).
- (8) B. Schoch (private communication).
- (9) H. Anklin et al., Phys. Lett. B336, 313 (1994).
- (10) H. Anklin et al., Phys. Lett. B428, 248 (1998).
- (11) G. Kubon et al., Phys. Lett. B524, 26 (2002).
- (12) J. Jourdan, I. Sick, and J. Zhao, Phys. Rev. Lett. 79, 5186 (1997); E. E. W. Bruins et al., Phys. Rev. Lett. 79, 5187 (1997).
- (13) B. Blankleider and R. M. Woloshyn. Phys. Rev. C 29, 538 (1984).
- (14) L. D. Faddeev, Sov. Phys. JETP, 12, 1014 (1961).
- (15) J. Golak, H. Kamada, H. Witała, W. Glöckle, and S. Ishikawa, Phys. Rev. C 51, 1638 (1995); V.V. Kotlyer, H. Kamada, W. Glöckle, and J. Golak, Few-Body Syst. 28, 35 (2000).
- (16) J. Golak, G. Ziemer, H. Kamada, H. Witała, and W. Glöckle, Phys. Rev. C 63, 034006 (2001).
- (17) W. Xu et al., Phys. Rev. Lett. 85, 2900 (2000).
- (18) C. E. Jones et al., Phys. Rev. C 47, 110 (1993).
- (19) A. K. Thompson et al., Phys. Rev. Lett. 68, 2901 (1992).
- (20) H. Gao et al., Phys. Rev. C 50, R546 (1994); H. Gao, Nucl. Phys. A631, 170c (1998).
- (21) J.-O. Hansen et al., Phys. Rev. Lett. 74, 654 (1995).
- (22) M. Meyerhoff et al., Phys. Lett. B327, 201 (1994).
- (23) W. Xu et al., Phys. Rev. C 67, 012201(R) (2003).
- (24) F. Xiong et al., Phys. Rev. Lett. 87, 242501 (2001).
- (25) A. Kievsky, E. Pace, and G. Salmè, Eur. Phys. J. A 19, Suppl. 1, 87 (2004).
- (26) A. Deltuva, L. P. Yuan, J. Adam, Jr., and P. U. Sauer, Phys. Rev. C 70, 034004 (2004).
- (27) J. Arrington et al., Phys. Rev. Lett. 82, 2056 (1999); and references cited therein.
- (28) E. Pace, G. Salmè, and G. B. West, Phys. Lett. B273, 205 (1991).
- (29) O. Benhar, Phys. Rev. Lett. 83, 3130 (1999); and references cited therein.
- (30) H. Arenhövel et al., Few-Body Syst. 15, 109 (1993).
- (31) C. Ciofi degli Atti, E. Pace, and G. Salmè, Phys. Rev. C 43, 1155 (1991).
- (32) T. W. Donnelly and A. S. Raskin, Ann. Phys. (N.Y.) 169, 247 (1986).
- (33) A. Kievsky, E. Pace, G. Salmè, and M. Viviani, Phys. Rev. C 56, 64 (1997).
- (34) C. Ciofi degli Atti, S. Scopetta, E. Pace, and G. Salmè, Phys. Rev. C 48, R968 (1993).
- (35) C. Ciofi degli Atti, E. Pace and G. Salmè, Phys.Rev. C51, 1108 (1995).
- (36) R.-W. Schulze and P. U. Sauer, Phys. Rev. C 48, 38 (1993).
- (37) H. Hajduk-Meier et al., Nucl. Phys. A395, 332 (1983).
- (38) R. B. Wiringa, V. G. J. Stoks, and R. Schiavilla, Phys. Rev. C 51, 38 (1995).
- (39) G. Höhler et al., Nucl. Phys. B114, 505 (1976).
- (40) J. Carlson and R. Schiavilla, Rev. Mod. Phys. 70, 743 (1998).
- (41) S. Ishikawa et al., Nuovo Cimento A 107, 305 (1994).
- (42) S. Ishikawa et al., Phys. Rev. C 57, 39 (1998).
- (43) D. O. Riska, Phys. Scr. 31, 107 (1985); ibid. 31, 471 (1985).
- (44) R. Machleidt, Adv. Nucl. Phys. 19, 189 (1989).
- (45) J. L. Friar, B. F. Gibson, G. L. Payne, A. M. Bernstein, and T. E. Chupp, Phys. Rev. C 42, 2310 (1990).
- (46) J. Golak et al., Phys. Rev. C 65, 044002 (2002).
- (47) R. Alley et al., Nucl. Instr. Meth. A365, 1 (1995).
- (48) R. Prepost and T. Maruyama, Ann. Rev. Nucl. Part. Sci. 45, 41 (1995).
- (49) J. Alcorn et al., Nucl. Instr. Meth. A522, 294 (2004).
- (50) M. A. Bouchiat, T. R. Carver, and C. M. Varnum, Phys. Rev. Lett. 5, 373 (1960).
- (51) J. S. Jensen, Ph.D. thesis, California Institute of Technology, 2000.
- (52) I. Kominis, Ph.D. thesis, Princeton University, 2001.
- (53) T. J. Killian, Phys. Rev. 27, 578 (1926).
- (54) A. B. Baranga et al., Phys. Rev. Lett. 80, 2801 (1998).
- (55) A. Abramgam, Principles of Nuclear Magnetism, Oxford University Press, 1961.
- (56) K. G. Fissum et al., Nucl. Instr. Meth. A474, 108 (2001).
- (57) W. Xu, Ph.D. thesis, Massachusetts Institute of Technology, 2002.
- (58) I.V. Akushevich and N. M. Shumeiko, J. Phys. G20, 513 (1994).
- (59) J. Schwinger, Phys. Rev. 75, 898 (1949).
- (60) A. Amroun et al., Nucl. Phys. A579, 596 (1994); C. R. Otterman et al., ibid. A435, 688 (1985); P. C. Dunn et al., Phys. Rev. C 27, 71 (1983).
- (61) O. N. Ozkul, Senior thesis, Massachusetts Institute of Technology, 2000.
- (62) F. Xiong, Ph.D. thesis, Massachusetts Institute of Technology, 2002.
- (63) A. Amroun et al., Phys. Rev. Lett. 69, 253 (1992).
- (64) F. Ritz, H. Göller, T. Wilbois, and H. Arenhövel, Phys. Rev. C 55, 2214 (1997).
- (65) S. Jeschonnek and T. W. Donnelly, Phys. Rev. C 57, 2438 (1998).
- (66) T. W. Donnelly (private communication).
- (67) J. A. Caballero, T. W. Donnelly, and G. I. Poulis, Nucl. Phys. A555, 709 (1993).
- (68) T. de Forest et al., Nucl. Phys. A392, 232 (1983).
- (69) H.-W. Hammer and Ulf-G. Meißner, Eur. Phys. J. A 20, 469 (2004).
- (70) G. Holzwarth, talk at the Workshop on Nucleon Form Factors, Frascati, October 12-14, 2005; see also Z. Phys. A356, 339 (1996) and eprint hep-ph/0201138.
- (71) B. Kubis and U.-G. Meissner, Nucl. Phys. A679, 698 (2001).
- (72) E. L. Lomon, Phys. Rev. C 66, 045501 (2002).
- (73) J. P. B. C. de Melo, T. Frederico, E. Pace, S. Pisano, and G. Salmè, eprint hep-ph/0607342, to appear in Nucl. Phys. A.