On the muon neutrino mass
Abstract
During the runs of the PS 179 experiment at LEAR of CERN, we photographed an event of antiproton- absorption, with a complete e+ chain. From the vertex of the reaction a very slow energy was emitted. The decays into a and subsequently the decays into a positron. At the first decay vertex a muon neutrino was emitted and at the second decay vertex an electron neutrino and a muon antineutrino. Measuring the pion and muon tracks and applying the momentum and energy conservation and using a classical statistical interval estimator, we obtained an experimental upper limit for the muon neutrino mass: 2.2 MeV at a 90 confidence level. A statistical analysis has been performed of the factors contributing to the square value of the neutrino mass limit.
PACS. 13.20 Cz, 14.60 Pq, 13.25 Cq
N. Angelov2, F. Balestra1, Yu. Batusov2, A. Bianconi3, M.P. Bussa1, L. Busso1, L. Ferrero1, R. Garfagnini1, I. Gnesi1,5, E. Lodi Rizzini3, A. Maggiora1, D. Panzieri4, G. Piragino1,5, G. Pontecorvo2,5, F. Tosello1, and L. Venturelli3
; , ,
, ,
,
; , ,
,
,
;
,
, ,
1 Introduction
Determination of the absolute values of neutrino masses represents a most difficult problem from an experimental point of view. Evidence in favour of non-zero neutrino masses and oscillations obtained in most of the relevant neutrino experiments has made the physics of massive neutrinos a frontier field of research in particle physics and astrophysics. All the existing terrestrial and astrophysical data indicate that the neutrino masses are by many orders of magnitude smaller than those of other experimentally measured lepton and hadron masses. Such a low value is the most relevant reason for it being extremely difficult to extract the values of neutrino masses from experimental measurements, either directly or indirectly. This is the main reason why most experimental papers only report a confidence limit interval for such values. In this paper we report an upper limit for the muon neutrino mass obtained by measuring the radii of curvature of the pion and muon tracks of an event, in which a pion decays into a muon and a muon neutrino, recorded during the runs of the PS 179 experiment at the beam of antiprotons of LEAR at CERN.
2 Experimental apparatus
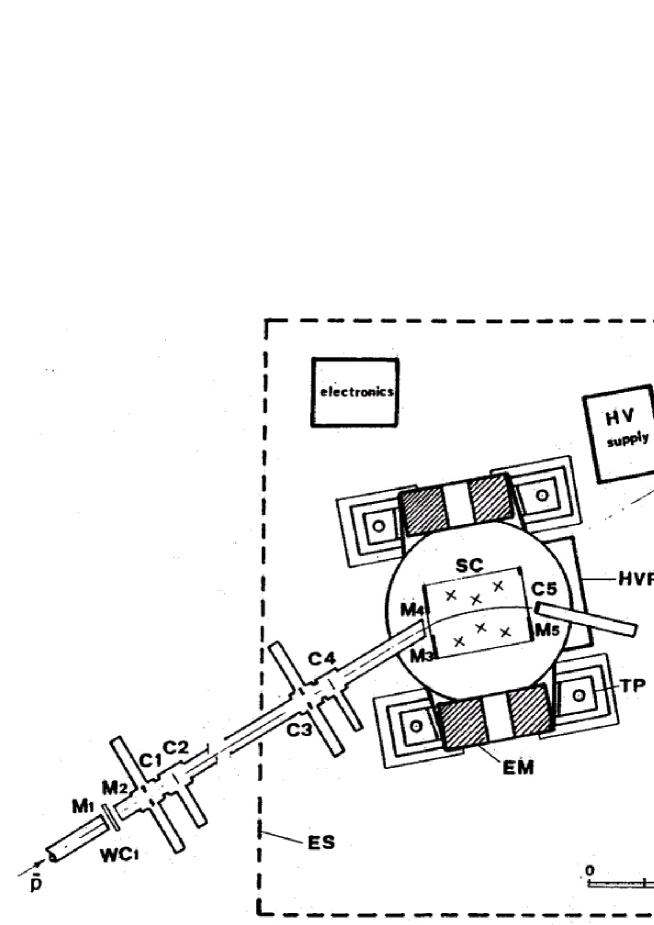
The PS 179 experimental apparatus was designed and built for the study of antiproton interactions with light and medium-light nuclei at the LEAR facility of CERN. The aim of the research was an experimental study of the interaction of antiprotons with nuclei at low energies. The results obtained provided information on the fundamental nucleon-antinucleon forces, on the interaction of antiprotons with clusters of bound nucleons, on the distribution of nuclear matter, and on properties of highly excited nuclear matter, as well as a restriction on the possible amount of antimatter present in the early Universe [1]. In order to make the most of the information available on all the secondary charged particles produced in the reactions, in designing the experiment a choice was made of the visualization detection technique, and a self-shunted streamer chamber placed in a magnetic field was used. Such a detector had many advantages. It was a low density gas target, and, at the same time, it was triggerable, offering a 4 acceptance in which highly luminous localized particle tracks could be obtained [2]. The low density of the target medium, i.e. of the streamer chamber filling gas at 1 atm pressure, allowed to reveal long charged particle ranges and nuclear fragments. The experimental apparatus used is sketched in Figure 1. The detector provided stereo pictures of the sensitive chamber volume. The details of the experimental apparatus have been given in ref. [3] where a more complete description of the characteristics and the performances of all the components of the setup can be found.
3 Analysis of the measurements
The runs of the PS 179 experiment were carried out with the streamer chamber filled at 1 atm with different gaseous targets: , , . The stereo pictures of events, recorded on films during the runs, were reprojected onto measuring tables for visual scanning. The events were measured with a digitized coordinatometer directly on the scanning tables.
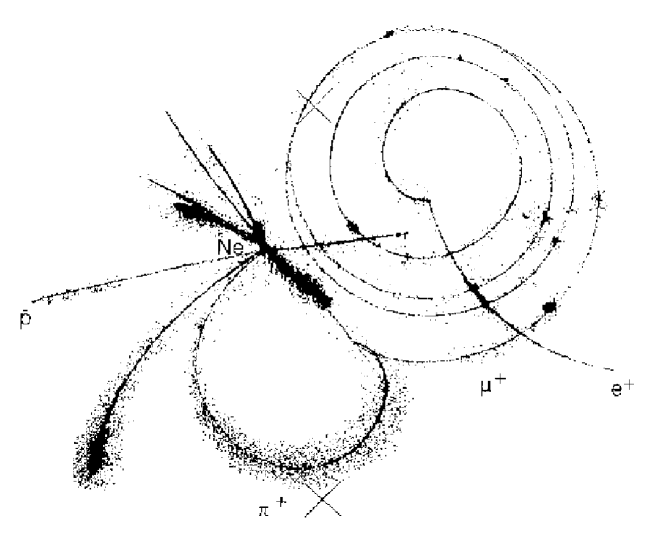
In one of the photographs of the run, the beautiful event, reproduced in Figure 2, was observed. It represents a multi-nucleon annihilation [4] of an antiproton with a nucleus (see, also, Figure 11 of ref. [3]). From the vertex of the interaction there “evaporated” a (1.980.02) MeV positive pion. From the two vertices of the pion and muon decays, three neutrinos were emitted: from the first a muon neutrino and from the second an electron neutrino and a muon antineutrino. The peculiarity of the event consists in the noticeable length of the and tracks and in their coplanarity.
The temperature of the streamer chamber filling gas was 289 K, the pressure atmospheric, and the target density (0.800.01) mg/cm3. The magnetic field was 0.8 T (B/B = 10-5).
The tracks have been measured at JINR with a microscope-digitizer. The recent acquisition of such a microscope made it possible to newly measure the e event, reconstructing and digitizing tracks with a very high accuracy. The pion track has been digitized at 347 points, the muon track at 2037 points and the positron track at 180 points. All the measured points are approximately equidistant. Each point has been measured with a precision of about mm. The coordinates of all track points have been used to deduce the radii of curvature and the ranges. Each particle transfers energy by ionization to the surrounding medium and slows down along its path. A Fortran code has been written to estimate the radii of curvature varying along the tracks and the total track lengths. For each track the best-fit circles were calculated taking into account a fixed number N of points. Starting from the first measured point and taking the subsequent N-1 points, the first radius was calculated. If n is the total number of points measured along a track, shifting the N points by one along the track, the subsequent n-(N-1) radii have been calculated. We have chosen N = 25 (a value statistically significant in order to ensure fit stability) for each track. Program CIRCLE of the CERN library [5] has been included into the code to calculate the best-fit radii of curvature along the tracks.
The initial pion momentum was estimated from all measured points along the first 10 cm of its track, since the range-energy relations (and tables) for neon at NTP reveal the energy loss of a 2.00 MeV pion to be negligible for path lengths not exceeding 10 cm. The average radius of curvature of the first 10 cm of the pion track, obtained best-fitting the track with a circle, is r = (9.790.09) cm corresponding to a momentum (p = 300Br) of (23.500.15) MeV/c. The agreement between the value of the initial pion momentum and its measured path range of (471.50.8) mm, shows that the pion decay occurred with a momentum of (0.050.10) MeV/c. The same parameters have been measured for the muon track. The initial muon momentum was estimated from all measured points along the first 12 cm of its track, since, also in this case, the range-energy relations (and tables) for neon at NTP reveal the energy loss of a 5.00 MeV muon to be negligible for path lengths not exceeding 12 cm. The value of the average radius of curvature of the first 12 cm of the muon track, obtained with a best-fit circle, is r = (12.500.08) cm, corresponding to a momentum of (29.900.15) MeV/c. In this case, also, the agreement between the initial muon momentum and its measured path range of (2616.00.8) mm shows that the muon decayed with a momentum of (0.60.6) MeV/c. The positron was emitted with a momentum of (46.800.08) MeV/c. The angle between the tangent lines of the pion and muon trajectories at the decay vertex was (163.01.0) deg, and the angle between the muon and positron tracks was (107.01.0) deg. It should be pointed out that the e event of Figure 2 is the only existing of this kind whose parameters could be all measured with high precision.
3.1 Kinematic and dynamic constraints
For kinematic and dynamic analysis of the reaction, the relations of conservation of momentum and energy have been used. The pion decay occurs in a plane. At the decay vertex, the muon and the neutrino have flight directions at angles and to the pion flight direction, respectively. For momentum conservation
| (1) |
| (2) |
For energy conservation
| (3) |
Combining algebraically the three relations one obtains
| (4) |
and
| (5) |
from which one can obtain the square of the neutrino mass
| (6) | |||||
where only the factor can approach zero and where and always positive. It is clear that from relation (6), given the masses of the pion and muon, the momenta of the pion and muon, and the angle , one can calculate the square of the neutrino mass as a function of the above-mentioned parameters.
3.2 On the upper limit of
A point or an interval estimator of an unknown parameter is any statistic whose value is a meaningful guess for the value of the unknown parameter which is assumed to have some fixed value [6]. Sometimes experimental measurement may yield non-physical values, when the parameter value is near zero [7]. In these cases a statistical procedure can be used for estimation of the upper limit value of the parameter. In the present analysis the neutrino mass is the parameter to be estimated. The upper limit of the mass of the muon neutrino [8] has a value near zero, and is about seven orders of magnitude smaller than the values of the measured experimental quantities of the decay. In determining such a mass in an unbiased approach one would necessarily expect a non-physical result for to occur half of the time. This happens because of the uncertainties of the experimental values of the physical quantities. One should then make statistical inferences from observation of the squared mass m2 when is negative or near the non-physical region. m2 is the standard deviation. It is possible to choose a “classical” confidence level p for the squared mass such that the corresponding classical confidence limit is in the physical region. When the variable has a Gaussian distribution the upper limit is
| (7) |
at a p confidence level, where = 1.036, = 1.282, = 1.645 and = 1.960 (see ref. [9]). The classical confidence limit satisfies the probability statement
| (8) |
This statement says that has the probability p of being larger than the true value (), whatever really is. It means that, if one repeats the experiment many times, and each time one recalculates the value of , then in of the cases will be greater than the true value .
3.3 Monte Carlo events
To obtain an interval estimate for the muon neutrino mass from our measurement of the scattering angle and of the momenta of the two charged particles of the decay, a statistical procedure has been applied. It takes into account the measured pion and muon momenta and the angle between them. These are distributed with Gaussian p.d.f.’s with means equal to the measured values and standard deviations equal to the corresponding measured uncertainties. A code has been written. Using the Monte Carlo method a set of decays has been generated. Each element of the set has been obtained extracting at random the momenta of the pion and of the muon, and the angle between the two particles assuming the mass values of = (139.570180.00035) MeV and = (105.6583690.000009) MeV, as given in ref. [8]. The three variables were extracted independently of each other. Other relevant quantities were then calculated. The distributions of , of and of in relation (6) have been obtained.
3.4 Analysis of the results
Figure 3 shows the distributions of (upper part), (central part) and of (lower part).

The distribution is Gaussian, with a negative mean value and relatively large standard deviation that depends on the uncertainties in the experimentally measured quantities. The distribution is Gaussian with a negative mean value and relatively small standard deviation. Both distributions have ratios of the standard deviation to the mean value of the same order of magnitude. The distribution is Gaussian but in the physical region, with a mean value of (59.70.2) MeV, about two orders of magnitude greater than .
The distribution leads to the squared muon neutrino mass
| (9) |
which is compatible with zero. According to the classical method [7], described in Section 3.2, equation (9) corresponds to the muon neutrino mass upper limit
| (10) |
at the 90 confidence level. This is the lowest estimate of the upper limit value of the muon neutrino mass obtained with a visualizing detector, using all the directly measured kinematic and dynamic parameters of the decay, that is , and (see ref. [10] and [11] and references quoted therein). The last measurement of this kind of events has been performed with a helium filled bubble chamber [11]. Because of the density of liquid helium, the muon tracks were only 1 cm long, and composed by about (152) bubbles. The authors assumed that all the stopped pions decayed at rest. For this reason they did not use in the analysis the values of the angle and of the momentum of each pion. It is quite likely that most of the low energy pions decayed in flight.
Since then many experiments have been devoted to measuring the muon momentum with higher accuracy. Recently, Assamagan et al. [12], using a magnetic spectrometer equipped with a silicon microstrip detector, studied the decay of pions stopped in a graphite target. The authors measured for the muons an average momentum of (29.792000.00011) MeV/c. For the pions immediately before their decay, the estimated average kinetic energy was Tπ = (0.4250.016) eV, so most of the pions actually decayed in flight. Setting the energy of the pions and the angle to zero, the authors deduced a squared muon neutrino mass of (0.0160.023) MeV2 and, according to the Bayesian approach, deduced the corresponding neutrino mass upper limit of mν 0.17 MeV (C.L. = 0.9).
Applying the procedure described in paragraph 3.2, we have estimated the upper limit of the muon neutrino mass from the data of ref. [12], taking into account the measured average energy value of the decayed pions and assuming a non-zero angular uncertainty of 0.2 deg (differently from ref. [12]). In this case the distribution of is totally in the physical region. The value obtained for the muon neutrino mass is = (80080) keV.
If we set the momentum of the decayed pion equal to zero, as in ref. [12], if we assume the uncertainty of this value to be of the same order of magnitude as that measured for the muon, and take = 0.2 deg, the distribution of extends in the non-physical region. The calculated upper limit of the muon neutrino mass is mν 110 keV (C.L. = 0.9) using the classical approach [7].
These exercises reveal the necessity, for an accurate estimation of the squared muon neutrino mass, of precise and direct measurements of all kinematic parameters of individual decay events, like those performed for the event reproduced in Figure 2.
Analysing the distributions shown in Figure 3, we studied the characteristics of the statistical variables , and . Although both and have the same Gaussian distribution (being composed of the same physical quantities), the distribution is shifted toward large positive values. The distribution is close to zero and the values may be negative (this is true, also, for the distribution).
Using the formulae of paragraph 3.1 we calculated the kinematic parameters of the decay , assuming the mass values of and as given in paragraph 3.3, and a value for the muon neutrino mass of 0.300 keV. The choice of this value for the neutrino mass is related to the actual precision of the pion and muon masses [8]. The mean value of the pion momentum was set to 0.05 MeV/c and of the angle to 163.0 deg in order to allow a direct comparison with our measurements. Applying the procedure described in paragraph 3.3 and running the Monte Carlo code with different values of the uncertainties in the input variables (within 10-1010 MeV/c for the momenta and , and 10-51 deg for the angle ), sets of 105 decays have been generated. Each decay has been obtained extracting at random, independently, the three Gaussian variables , and . The procedure gives in output all the relevant kinematic and dynamic quantities of the decay, in particular, , and .
In Table 1 we present the results for different sets of Monte Carlo events, all obtained with an uncertainty of 1o in the measurement of the angle. The choice of this value was again dictated by the uncertainty of our measurement.
| (deg) | (MeV/c) | (MeV) | (MeV) | (MeV2) | |||
| mean | standard | mean | standard | mean | standard | ||
| value | deviation | value | deviation | value | deviation | ||
| 1.0 | 10 | -4.310-1 | 15.0 | 59.9 | 11.0 | -190.5 | 9610 |
| 1.0 | 1 | -2.710-3 | 1.6 | 59.6 | 1.2 | -1.9 | 93.0 |
| 1.0 | 10-1 | -1.010-4 | 1610-2 | 59.6 | 1.210-1 | -2.410-2 | 9.3 |
| 1.0 | 10-2 | -1.910-5 | 1.610-2 | 59.6 | 1.210-2 | -1.310-3 | 0.93 |
| 1.0 | 10-3 | -1.310-5 | 1.610-3 | 59.6 | 1.210-3 | -7.610-4 | 9.510-2 |
| 1.0 | 10-4 | -1.210-5 | 3.010-4 | 59.6 | 2.810-4 | -7.210-4 | 1.810-2 |
| 1.0 | 10-5 | -1.210-5 | 2.510-4 | 59.6 | 2.510-4 | -7.210-4 | 1.510-2 |
| 1.0 | 10-6 | -1.210-5 | 2.510-4 | 59.6 | 2.510-4 | -7.210-4 | 1.510-2 |
In the first two columns the uncertainties of the input variables are reported. The third, the fourth and the fifth columns show the mean values and the standard deviations of the , and distributions. Both and distributions have negative mean values. The mean values are always positive. So, for all the experimental uncertainties reported in Table 1, the distributions of and extend into the non-physical region. Using the same classical method applied to deduce the muon neutrino upper limit mass from the distribution [7], we calculated an upper limit from the distribution. Figure 4 shows the

muon neutrino mass upper limits calculated from the distributions as a function of the uncertainties of the momenta of the and for different values of the angle, and for = 0.300 keV. In the same Figure 4, the and (C.L. = 0.9) upper limits are also reported. The values calculated from formula (7) follow straight lines. The lines (a) and (b) have been drawn to guide the eye, the line (c) represents a constant upper limit value of 60 MeV. When the momentum uncertainties are larger than about 10 MeV/c, the lines (a) and (b) intersect at the upper limit of 60 MeV. For momentum uncertainties less than 10-9 MeV/c and for angular uncertainties less than 10-5 deg, the upper limit values of reach the assumed value of 0.300 keV, confirming the validity of the classical approach [7] we used. Moreover, one can see that the limit values of attainable with present modern techniques correspond to measurement uncertainties in momenta higher than 10-4 MeV/c.
To analyse the case of pions decaying in flight with higher momenta, we calculated the kinematic parameters of the decay for a pion momentum of 200 MeV/c and neutrino mass of 0.300 keV. This value of the pion momentum has been choosen because, at the JINR Phasotron, the DUBTO experiment [13] studying pion interactions with nuclei at 200 MeV/c, collected several events. In this case the allowed values of the angle are less than 11 deg. Setting the value of the angle equal to 5 deg, we applied the procedure described in paragraph 3.2. The uncertainties of the momenta were varied in the range 1010-9 MeV/c and of the angle in the range 110-5 deg. Figure 5 shows the

same , and upper limits as in Figure 4, calculated using the , and distributions as functions of the momentum uncertainties in the range 1010-9 MeV/c, and with an error for the angle of 10-4 deg. As one can see, at 200 MeV/c the upper limit values follow the line (a) of Figure 4, which was drawn for pions decaying at lower energies. The behaviours of the and upper limits appear to be nearly parallel to those of Figure 4.
Considering the experimental uncertainties actually attainable in laboratories and taking into account the present values of pion and muon masses and their uncertainties, it appears impossible to perform experiments, based on the measurement of all the kinematic parameters of the decay, from which an upper limit of the muon neutrino mass less than about 1 keV can be deduced.
In the frame of the results of the present analysis, using the distributions of Figure 3 relative to the measurement of the event displayed in Figure 2 and with the uncertainties of the present experiment, we obtained the upper limits of and , at given confidence levels, reported in Table 2 using the classical statistical approach. The values have been deduced with formulae (7); in particular, = (0.186+1.282*0.211) MeV = 0.0845 MeV, at 90 confidence level. It must be noted that, with the upper limit of = 59.96 MeV, one obtains
| (11) |
The above values of , and upper limits are reported in Figure 4.
| (MeV) | (keV) | p() |
|---|---|---|
| 1.4 | 33 | 80 |
| 2.2 | 85 | 90 |
| 3.1 | 161 | 95 |
4 Conclusions
This paper describes the determination of a confidence upper limit for the muon neutrino mass by measuring the momenta of the decaying pion and of the produced muon in a unique (e) nuclear event recorded in the PS 179 experiment at LEAR of CERN. A sizeable improvement of previous results obtained using low density visualizing detectors has been achieved.
5 Acknowledgement
We are grateful to S. Bilenky, S. Bottino, L. Cifarelli, A. Kotzinian, A. Olchevski, N. Russakovich for stimulating discussions and useful comments, and to Miss V. Rumiantseva for the very accurate measurements with the microscope.
The Italian Ministry of Foreign Affairs is acknowledged for its essential financial support to the research.
References
- [1] Yu.A. Batusov, I.V. Falomkin, G.B. Pontecorvo, M.G. Sapozhnikov, C. Guaraldo, A. Maggiora, M. Vascon, G. Zanella, G. Bendiscioli, V. Filippini, E. Lodi Rizzini, A. Rotondi, A. Zenoni, F. Balestra, M.P. Bussa, L. Busso, L. Ferrero, G. Gervino, D. Panzieri, G. Piragino, F. Tosello, Nuovo Cim.Lett. 41(1984)223.
- [2] F. Balestra, L. Busso, R. Garfagnini, G. Perno, G. Piragino, R. Barbini, C. Guaraldo, R. Scrimaglio, I.V. Falomkin, M.M. Kulyukin, G.B. Pontecorvo and Yu.A. Shcherbakov, NIM 125(1975)157 and NIM 131(1975)421.
- [3] F. Balestra, M.P. Bussa, L. Busso, L. Ferrero, G. Gervino, A. Grasso, D. Panzieri, G. Piragino, F. Tosello, G. Bendiscioli, V. Filippini, G. Fumagalli, E. Lodi Rizzini, C. Marciano, A. Rotondi, A. Venaglioni, A. Zenoni, C. Guaraldo, A. Maggiora, A. Cavestro, M. Vascon, G. Zanella, Yu.K. Akimov, Yu.A. Batusov, I.V. Falomkin and G.B. Pontecorvo, NIM A234(1985)30.
- [4] F. Balestra, S. Bossolasco, M.P. Bussa, L. Busso, L. Ferrero, D. Panzieri,G. Piragino, F. Tosello, R. Barbieri, G. Bendiscioli, A. Rotondi, P. Salvini, A. Zenoni, Yu.A. Batusov, I.V. Falomkin, G.B. Pontecorvo, M.G. Sapozhnikov, V.I. Tretyak, C. Guaraldo, A. Maggiora, E. Lodi Rizzini, A. Haatuft, A. Halsteinslid, K. Myklebost, J.M. Olsen, F.O. Breivik, T. Jacobsen and S.O. Srensen, Nucl.Phys. A491(1989)541.
- [5] CERNLIB-CERN Program Library (1992).
- [6] W.T. Eadie, D. Drijard, F.E. James, M. Roos and B. Sadoulet, , North-Holland Publ. Co. (1977) page 115.
- [7] F. James and M. Roos, Phys.Rev. D44(1991)299.
- [8] Particle Data Group, , Phys.Lett. B592(2004)279.
- [9] E.L. Crow, F.A. Davis and M.W. Maxfield, , Dover Publ. Inc. New York (1960) page 231.
- [10] R.G.H. Robertson and D.A. Knapp, Ann.Rev.Nucl.Part.Sci. 38(1988)185.
- [11] L.G. Hyman, J. Loken, E.G. Pewitt, M. Derrick, T. Fields, J. McKenzie, I.T. Wang, J. Fetkovich and G. Keyes, Phys.Lett. 25B(1967)376.
- [12] K. Assamagan, Ch. Broennimann, M. Daum, H. Forrer, R. Frosch, P. Gheno, R. Horisberger, M. Janousch, P.R. Kettle, Th. Spirig and C. Wigger, Phys.Rev. D53(1996)6065.
- [13] E.M. Andreev, N.S. Angelov, S.A. Baginyan, Yu.A.Batusov, I.A. Belolaptikov, T.D. Blokhintseva, A.Yu. Nonyushkina, V.A. Butenko, A.A. Dem’yanov, V.A. Drozdov, I.V. Falomkin, V.N. Frolov, V.M. Grebenyuk, V.V. Ivanov, A.S. Kirilov, V.E. Kovalenko, V.I. Lyashenko, A.S. Moiseenko, V.A. Panyushkin, G.B. Pontecorvo, A.M. Rozhdestvensky, N.A. Russakovich, O.V. Savchenko, F. Balestra, L. Busso, M.P. Bussa, M.L Colantoni, L. Fava, A. Ferrero, L. Ferrero, R. Garfagnini, A. Grasso, A. Maggiora, M. Maggiora, A. Manara, G. Piragino, F. Tosello, G.F Zosi, L.A. Kondratyuk and M.G. Schepkin, NIM A489(2002)99.