Decay modes of 250No
Abstract
The Fragment Mass Analyzer at the ATLAS facility has been used to unambiguously identify the mass number associated with different decay modes of the nobelium isotopes produced via reactions. Isotopically pure (%) 204Pb targets were used to reduce background from more favored reactions on heavier lead isotopes. Two spontaneous fission half-lives ( s and s) were deduced from a total of 158 fission events. Both decays originate from rather than from neighboring isotopes as previously suggested. The longer activity most likely corresponds to a -isomer in this nucleus. No conclusive evidence for an branch was observed, resulting in upper limits of 2.1% for the shorter lifetime and 3.4% for the longer activity.
I Introduction
The search for and study of the heaviest elements has yielded many surprises and expanded our knowledge and understanding of nuclear structure. Even with the discovery of new superheavy elements with , the amount of structure information for , though growing, remains somewhat scarce. It has recently been discovered that the 254No nucleus is surprisingly robust to rotation, sustaining angular momenta up to 22 Ghiorso et al. (1973); Reiter et al. (1999); Herzberg et al. (2002a). Further studies Herzberg et al. (2002b); Heßberger et al. (2004) have recently revealed the presence of isomeric states in other No isotopes.
The reported success of using the doubly-magic nucleus 48Ca to form superheavy elements Oganessian et al. (1999, 2000, 2004) suggests the need to examine other reactions with this projectile. Reactions of 48Ca with heavier Pb isotopes have been studied in detail. Until recently, however, there were no data available for 48Ca induced reactions on the lightest stable Pb isotope, 204Pb. This situation was rectified in 2001 with the systematic study by Oganessian et al.Oganessian et al. (2001) utilizing the Dubna Gas-Filled Recoil Separator (DGFRS), and further improved in 2003 by Belozerov et al.Belozerov et al. (2003) using the VASSILISSA electrostatic separator. The DGFRS study Oganessian et al. (2001) only observed spontaneous fission (SF) decays (no particles were seen). A half-life of s was determined from fission events in the reaction. Events from the similar reaction, , yielded a half-life of s resulting in an average half-life of s from 21 total decays. The maximum observed cross section for the channel was found to be nb at an excitation energy of 23.2 MeV in the compound nucleus. The VASSILISSA experiment Belozerov et al. (2003) also observed only spontaneous fission decay. The latter measurement was also the first to use highly-enriched 204Pb (99.6%) material. Forty-two events were detected with a half-life of s, and were assigned to . The data also included 22 events with a half-life of s, which were attributed to while noting that the possibility of these coming from an isomeric state of could not be ruled out. Neither experiment found evidence of the 250 s SF lifetime originally assigned to by the authors of Ref. Ter-Akopyan et al. (1975).
The present experiment had two primary goals. The first was to verify the presence of multiple SF decay lifetimes in light nobelium isotopes using the mass separation capability of the Fragment Mass Analyzer (FMA) to unambiguously associate a specific mass with each measured decay lifetime. The second goal was to produce a sufficient number of residues to search for the previously unobserved branch in in order to test current mass models.
II Experimental details
II.1 Setup and preparation
The cross section for at a laboratory energy of 220 MeV is of the order of 10 nb Oganessian et al. (2001); Belozerov et al. (2003). However, the cross sections for the reactions on 206,207,208Pb at 220 MeV are 30–100 times larger Oganessian et al. (2001) so that even small isotopic impurities in the target can contribute a sizable background yield to a measurement. Therefore, highly-enriched (%) targets of 204Pb (0.165% 206Pb, 0.064% 207Pb,0.064% 208Pb) were used. Even with such enrichment, residue production from these impurities could account for up to 15% of the total residue rate. The target consisted of four 90∘ Pb segments, of average thickness 540 sandwiched between C entrance and exit foils of 40 and 10, respectively, assembled into a wheel of 2.2 cm radius. This target wheel was rotated at 1800 rpm to prevent deterioration of the targets due to overheating from the high-intensity beam.
The 48Ca beam was accelerated by the ATLAS superconducting linear accelerator at Argonne National Laboratory (ANL). The beam intensity on target, monitored via upstream Faraday Cups, an inductive pick-off immediately in front of the chamber, and a Si monitor detector at 60∘, ranged from 40 to 90 pnA, with a time-averaged intensity of 56 pnA for the entire experiment of 3.5 days. To further reduce the heat load on the targets, the beam spot was slightly defocused by reducing the fields in the last quadrupole before the target chamber. This increased the beam spot size from 0.5 mm diameter to 1 mm in diameter. The beam was also deflected up to 2.5 mm in the vertical direction using a magnetic steerer coupled to a triangle-wave generator. The vertical deflection does not affect the mass resolution since the FMA dispersion is in the horizontal plane. (The modest defocusing does affect the final resolution, however.) Finally, to avoid unnecessary background due to beam scattering from the four target wheel spokes, the beam was chopped in synchronization with the wheel position.
Since the charge state distributions of evaporation residues (EVRs) produced in heavy ion reactions are quite broad, the FMA was set to a fractional charge state to allow the simultaneous collection of two neighboring charge states (either =19-20 or =20-21). The mass-to-charge ratio of the EVRs was measured at the focal plane of the FMA with a parallel grid avalanche counter (PGAC) filled with isobutane. The transmitted ions then implanted into a 4 cm square, 40x40 double-sided silicon strip detector (DSSD) positioned 40 cm downstream of the PGAC. The data acquisition readout was triggered on any DSSD signal above threshold, typically 150–200 mV (300 keV).
Each DSSD signal was routed to three separate amplifiers. One signal was passed through a delay-line amplifier to eliminate the energy “pile-up” characteristic of fast decays (implant to decay time of a few s). These amplifiers saturated (full-scale range) at 20 MeV -equivalent energy. A second branch was sent through a shaping amplifier, also with a full-scale range of 20 MeV. These two signals are useful for residues implanted into the Si detector and for -like decay energies. The final branch was sent to another shaping amplifier with a full scale of 250 MeV which recorded fission-like energies. The minimum observable correlation time, which is related to the response of the delay-line amplifiers, was found to be 2 s for -like decays. Fission-like energies saturated the delay-line amplifiers and only implant-fission correlations longer than 5 s could be observed. All events were tagged with the readout from a 100 ns clock to provide the time differences necessary for reconstructing correlations.
Although the DSSD had 40 strips on each side, three strips on each side were malfunctioning. In addition, a fourth strip on the front side was missing from the implant ADCs because of a faulty module. This reduced the number of pixels available for the detection of implant-decay correlations from 1600 to 1332.
II.2 Calibration
The high-gain channels (0–20 MeV) of the DSSD strips were calibrated with a 240Pu-244Cm source. For these particles, the energy resolution was typically 15 keV FWHM, and no worse than 40 keV. The low-gain channels (0-250 MeV) were calibrated relative to the high-gain ones by use of a precision pulser to generate signals over a range equivalent to 5–500 MeV.
To calibrate the FMA and ensure that the electronics were functioning as planned, a test reaction of Ca, was used to produce 219,220Th residues. 219Th has a 1 s half-life, making it a suitable benchmark for fast decay events. 220Th has a 10 s half-life. Data from this setup reaction were collected for an approximate beam dose of particles over nine hours.
III Results
III.1 The Ca+Yb setup reaction
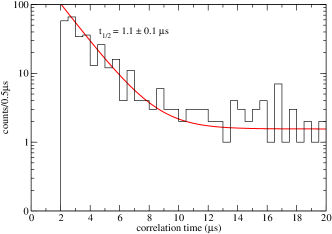
The setup reaction of 220 MeV 48Ca + 176Yb mainly yields Th isotopes of mass 219 and 220. With the FMA set for and , several EVRs were collected and their subsequent decay was observed. The decay curve measured for 219Th is presented in Figure 1. Half-lives of and s with respective uncertainties of about 10% and 36% were measured. These are in good agreement with the known Audi et al. (2003) values of 1.050.03 and 9.70.6 s, respectively, for the two isotopes. These results confirm the proper functioning of the FMA setup. The decay curve of Fig. 1 also illustrates the effective minimum correlation time for reliable recoil-alpha identification of 2 s.
III.2 The Ca+Pb reaction
III.2.1 Experimental details
A total beam dose of 48Ca particles was delivered to the targets over the course of the experiment. Data were collected with two different charge state settings for the FMA, 19.5 and 20.5, to collect EVRs with charge states 19–21. The bulk of the data (98%) were taken at the setting since the focal plane yield/pnA was highest for this setting. The average rate (scattered beam and residues) incident on the entire DSSD was 5 events per second per pnA of incident beam.
Two different time windows were utilized to search for implant-decay correlations: a 500 s window sensitive to the expected short decay time of the primary nobelium residues, and a longer 10 s window that emphasized both the heavier No residues produced from target impurities as well as their fermium daughters, which also have longer lifetimes. The analysis of observed decays from these impurities and random correlations are discussed in the following sections. An implant was defined as a signal in the DSSD associated with a time-of-flight (TOF) signal between the focal-plane PGAC and the DSSD, and located within a two-dimensional gate for residues in a plot of vs. TOF. DSSD signals in which the high-gain shaping amplifiers or delay-line amplifiers were saturated and the calibrated energy in the low-gain amplifiers was greater than 50 MeV were interpreted as originating from fission. An energy threshold for fission was necessary since, for the very short decay times, residue implants and their decays occur in the same event and some implanting residues saturated the high-gain amplifiers. These could be discriminated from fission, though, as the residues only registered a signal of 20–40 MeV, whereas fission events were typically above 50 MeV. Signals from the front of the DSSD with an energy between 6.5 and 11.5 MeV were taken to be associated with particles. Table 1 lists the observed rates for each of these types of signals for various periods of the experiment. The difference in rates before and after run 16 is mainly due to the presence of the 14.6 hr 211Rn, a decay product of the 219Th produced in the setup reaction. Runs 6–16 immediately followed the setup reaction and a higher-than-desired background was observed as a result. After a 48 hour period of down time, which allowed this activity to decay away, the experiment resumed with runs numbered 18 and above. The implant rate is directly proportional to the average beam current on target, which steadily improved over the course of the experiment. In total, 158 recoil-fission correlations were observed.
| Run | Implant | Fission | (SA) | (DA) | Expected Randoms | |
|---|---|---|---|---|---|---|
| Set | ||||||
| 06-11 | 22.2 | 3.3 | 51.1 | 50.5 | ||
| 12-16 | 15.4 | 4.3 | 35.8 | 34.6 | ||
| 18-21 | 39.8 | 10.3 | 5.8 | 5.6 | ||
| 22-37 | 97.2 | 12.2 | 2.0 | 1.9 | ||
| 38-43 | 162.4 | 20.8 | 1.1 | 1.1 | ||
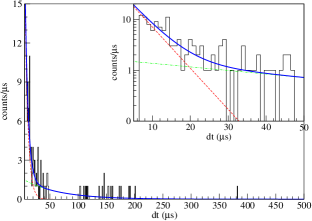
The observed decay spectrum, given in Fig. 2, illustrates several important features. Bins of 1 s were chosen for display and analysis. The full range of 500 s matches the correlation window used in the analysis. The spectrum is remarkably clean and two decay components are clearly visible. The absence of data between 45 and 95 s is due to the deadtime during acquisition readout. The inset expands the first 50 s to more clearly show the components. The dashed, dot-dashed, and full lines represent the results of a two-component fit described in the following section.
III.2.2 Fission decay details
The key issue is whether the two fission decay components are from different isotopes or different levels of the same No residue. In the first step of the analysis, a crude cut between the two components was made. Decays s are dominated by the short component, while decays occurring after 95 s are solely due to the long component.
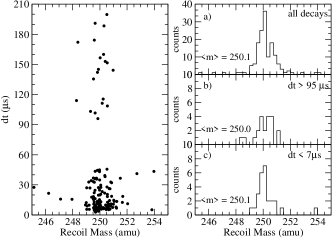
The masses are obtained from the focal plane (PGAC) position using the known dispersion of the FMA. The derived masses are presented in Fig. 3. The left panel plots the implant-decay correlation time versus the mass number of the implanting residue. The right panels contain the projections on the mass axis for all decays (a), decays longer than 95 s (b), and decays shorter than 7 s (c). It should be noted that even though there is a small contribution from the long component in the s projection, the latter is primarily dominated by the short component, as can be seen clearly in the inset of Fig. 2. From the distributions in Fig. 3 it is clear that, regardless of decay window, the distributions are similar in shape and centroid. The mean centroid values, listed in Table 2, indicate that all decays originate from the same mass number.
| Decay type | counts | centroid (amu) |
|---|---|---|
| All | 158 | 250.1 |
| s | 20 | 250.0 |
| s | 31 | 250.1 |
Admittedly, Fig. 3 only reveals that all decays originate from mass number 250 and does not provide a identification. However, at low excitation energy, the channel leading to 250Md is much smaller in cross section than the channel leading to . Furthermore, the decay of 250Md is well-knownTuli (2005) and does not contain a SF component. Thus, it is concluded that the two decay modes reported here belong to 250No and not to the deexcitation of two different isotopes, as originally suggested by the authors of Ref. Belozerov et al. (2003), although the possibility of these decays originating from different states of the same nucleus was not completely ruled out in that work. The nature of these decays will be explored further in section IV.
Extracting the lifetimes of the two decay modes is complicated by the deadtime gap between 45 and 95 s and by understanding the “background” that the long component provides to the short one. Therefore, the long component was examined first following the procedure outlined in Ref. Schmidt et al. (1984). Any decays occurring after the deadtime window are due solely to the long decay component. For a single decay component governed by Poisson statistics, with a solid deadtime window beginning at time-zero of width , the mean lifetime, , is the mean of the observed decay times, , minus the deadtime: . For the 20 decays longer than 95 s, this results in a mean lifetime of s. To estimate the contribution of the long decay mode in the region where the short component dominates, the amplitude, is found from the relation
Simply subtracting this contribution from the decay spectrum before fitting over the first 40 s yields a mean lifetime of s for the short component. However, the 20% uncertainty in the long component decay constant results in a factor of 2 uncertainty in the amplitude of the short component and it complicates the determination of the correct value for its decay constant. To better understand the uncertainties, a least-squares fit to the data was performed with four parameters corresponding to the amplitude and decay constant of the two components. Asymmetric errors were then computed using the Minos routine as implemented in the code MINUIT James and Roos (1975). The fitted mean lifetimes of s and s (corresponding to half-lives of s and s) are reasonably close to those obtained from the simple estimates. The long lifetime is the same, as should be expected since the region examined only contains this component. The short lifetime changes somewhat, as may be expected from the uncertainty associated with the underlying “background” from the long component. The resulting errors are slightly larger than those obtained from the simple estimates, but they are more robust as they properly account for the correlations among the parameters. The reduced of the fit is 1.4. It should be noted that the procedure of Ref. Schmidt et al. (1984), which plots the decays on a logarithmic time axis, fails for this compound spectrum due to the unfortunate position of the deadtime window which blocks out the peak of the long component in that formalism. The final results are summarized in Table 3 and the associated fit appears as the solid line in Fig. 2, with the dashed and dot-dashed lines representing the individual components.
| Parameter | Short | Long |
|---|---|---|
| (decays/s) | ||
| s | ||
| s) |
Relative cross sections between the two states are obtained by integrating the decay functions from to in order to account for residues lost in flight and in the acquisition deadtime window. Interpolating the 206Pb(48Ca,2n)252No cross section from Ref. Oganessian et al. (2001) to the present beam energy, and normalizing to the observed 252No decays from reactions with 206Pb target impurities results in production cross sections of nb for the short component and nb for the long component. These cross sections are in reasonable agreement with the production of observed in the prior recent studiesOganessian et al. (2001); Belozerov et al. (2003). However, the isomeric production reported here is nearly a factor of two larger than that observed in Ref. Belozerov et al. (2003).
III.2.3 Limits on the branch
Having unambiguously identified all decays as originating from 250No, a search for the previously unobserved alpha decay branch was performed. From the mass tables of Refs. Myers and Swiatecki (1996); Liran et al. (2000); Muntian et al. (2003) a -value of MeV should be expected for -decay of the nucleus. The 1.1 s 246Fm daughter is known to -decay with MeV. An energy window of 6.5–11.5 MeV, which encompasses the energy range of all alpha decays of interest in the present measurement, was implemented for the particles. No decays with the expected energy were detected within a recoil-decay correlation window of 500 s. This is not surprising, since the Geiger-Nuttal rule would imply an partial half-life of the order of 50 ms for the expected energy. Competition with a fission branch decaying within 50 s would imply the need for a data set containing thousands of decays, or about ten times the present data.
However, during runs 22–37, one decay was observed 19.4 s after implant in pixel 19-18. Although this decay has a reasonable time correlation, the energy is much lower than expected. The energy read from the front strip (19) was 7519 keV while the back strip (18) registered 6622 keV. This seemingly large difference could be due to the decay occurring near an edge of the back strip, resulting in incomplete charge collection from that side. There are no known nobelium isotopes with an -decay energy this low. This decay energy is nearly 1.5 MeV less than expected from the mass models, and the Geiger-Nuttal rule for a 19.4 s -decay would require a value of about 10.5 MeV—nearly 3 MeV higher than observed. However, this event cannot be easily dismissed since, as shown in Table 1, the probability of this correlation being random is negligible. The deficit in energy may be due to partial energy loss attributable to an escaping alpha, incomplete charge collection if the decay occurred near an edge of the strip, or, less likely, an unexpected large deviation in the mass surface for .
As a check of the detection sensitivity in the present experiment, as well as to ensure that the transport efficiency through the FMA is understood, a search for longer-lived alpha decays produced from reactions with the heavier lead isotopes in the target was undertaken. Assuming equal transport efficiency through the FMA for all nobelium residues, 100% efficiency for detecting fission events, 50% efficiency for particle detection with full-energy, and cross sections interpolated from Ref. Oganessian et al. (2001), an estimate of 5 or 6 total full-energy alpha decays from 251,252No should be expected (these are the only isotopes with lifetimes less than the 10 s time window). Also, within a 10 s correlation window, the measured event rates should result in 0.5 random correlations (0 or 1) summed over all pixels in the detector for the entire experiment. All such observed recoil- correlations are listed in Table 4. The anomalous event described above is labeled as decay #0. From the remaining decays one is assigned as being random (decay # 1) since, although the correlation time is 252No-like, the measured energy is very close to that of 212Rn, one of the long-lived backgrounds resulting from the set-up reaction described in section III.1. However, this event could also correspond to a 252No decay in which some of the energy was lost due to an escape of the particle. The other six decays match expected correlations for 251,251m,252No. Opening the time correlation windows further (200 s for implant-decay, 5000 s for decay-decay), one double- correlation chain consistent with the 248FmCfCm sequence was observed, assuming that the first from a 252No implant was missed. Three decays characteristic of 254No and one fission event from 252No were also recorded, in agreement with expectations. The number of other correlations in these longer time windows is consistent with expected random rates and the decay energies/times do not match known decays, confirming their random character.
Of the six real decay events with a correlation time between 1 ms and 10 s, one was correlated to a second (daughter) decay: this is decay 7a & 7b in Table 4. The mass calculated from the focal plane position of the implant is 250.6. An implant-decay correlation time of 900 ms for the parent also favors mass 251 as the progenitor. The authors of Ref. Heßberger et al. (2004) showed that 251No has a low-lying isomer which decays to an isomeric state in 247Fm. The values for the parent and daughter decays through the isomers are 8805 keV and 8305 keV, respectively, with lifetimes of 930 ms and 4.3 s. These values match the observed ones (using the energy from the back strip, which is the largest signal) quite well.
| Energy (keV) | |||||||||
|---|---|---|---|---|---|---|---|---|---|
| Decay | Run | Event | Strip # | Sh. Amp | Del. Amp | Correlation | Interpretation | ||
| # | group | number | F-B | F | B | F | B | dt | |
| 0 | 22-37 | 5766611 | 19-18 | 515 | – | 7519 | 6622 | 19.4 s | unknown |
| 1 | 22-37 | 4494828 | 23-24 | 6937 | 6932 | 6940 | 6945 | 2.38 s | random |
| 2 | 38-43 | 373050 | 16-18 | 8637 | 8513 | 8629 | 8653 | 114.07 ms | 251No |
| 3 | 38-43 | 713689 | 25-36 | 8700 | 8661 | 8678 | 8638 | 1.04 s | (251,252)No |
| 4 | 38-43 | 803545 | 16-10 | 8654 | 8591 | 8645 | 8759 | 28.26 ms | (251,252)No |
| 5 | 38-43 | 1124662 | 18-37 | 8786 | 8681 | 8263 | 8637 | 4.46 s | 252No |
| 6 | 38-43 | 2235165 | 35-26 | 8629 | 8659 | 8620 | 8676 | 2.94 s | 252No |
| 7a | 38-43 | 3806836 | 31-05 | 8183 | 8521 | 8502 | 9002 | 904.91 ms | 251mNo |
| 7b | 38-43 | 3807197 | 31-05 | – | 8100 | 6637 | 8489 | 9.60 s | 247mFm |
IV Discussion
The ramifications of the present measurement on the structure of are now discussed. At first, a simple barrier-penetration model can be used, assuming a barrier with the shape of an inverted harmonic oscillator and a transmission coefficient (penetrability) given by the Hill-Wheeler formula
In addition, the barriers of 252No and are assumed to have the same curvature, but different heights. Within such a framework, the drop in SF lifetime of 6 orders of magnitude from 252No to would imply a lowering of the barrier height of 1 MeV. This is remarkable since many calculations of fission barriers in this region Möller and Nix (1974); Smolańczuk et al. (1995); Mamdouh et al. (2001); Koura (2002) predict a change of at most 0.6 MeV, usually less. However, there is no a priori reason to expect the barriers of 252No and to have the same shape. The dramatic drop in lifetime could be due to an explicit narrowing of the inner barrier or to a manifestation of the disappearance of a second minimum in the potential (effectively making the barrier narrower). Regardless of the cause, if this trend would continue to the next even-even nobelium isotope, 248No, the SF lifetime would approach the picosecond range and thus be technically very difficult to measure.
New information regarding the nuclear structure of can be obtained from the present data. Since this nucleus is even in both proton and neutron number, the ground state will correspond to a = configuration. Assuming similar structure to 252No and 254No, will have a sizable prolate deformation. Consequently, the lowest excited states will most likely correspond to a collective, rotational band whereas intrinsic excitations will arise from pair-breaking to form 2-quasiparticle configurations. The observed cross sections reveal a ratio of . That is, 29% of the cross section feeds a state associated with the long decay component. Ghiorso Ghiorso et al. (1973) found not only that the 0.28 s isomer in 254No was populated by 20–30% of the cross section, but also that 30% of the 250Fm production fed an isomeric level in that nucleus as well. The largest reported ratio of isomer to ground state production in an even-even nucleus occurs in 270Ds Hofmann et al. (2001), where the cross section is evenly divided between the ground and isomeric states. Thus, it is suggested that the more intense short component ( s) corresponds to the ground state, while the weaker component associated with the long decay lifetime ( s) is an isomeric state fed with a smaller cross section.
The factor of ten difference in lifetime between the two states should be noted, and its implications for the nature of the isomeric state considered. The longer SF activity associated with the isomer reported here can result from direct fission from the excited level, fission from the ground state that is -delayed by a -forbidden transition from the isomer to the ground state rotational band, or a mixture of these modes. If the longer-lived excited state does indeed feed the ground state there should, in principle, be a growth and decay aspect to the overall decay spectrum. Unfortunately, the sensitivity of the present experiment is insufficient to definitively discern between independent activities and a feeding scenario. In either case, the SF partial half-life of the isomer must be s. Both isomer decay possibilities (direct fission or -forbidden -decay) are discussed below. The isotone, 244Cm, has a isomer at 1040 keV Akovali (2003) with a half-life of ms. This nucleus can be used for guidance in understanding the structure of .
The systematic review of spontaneous fission by Björnholm and Lynn Bjørnholm and Lynn (1980) notes that the presence of an unpaired particle in the Pu to Fm region hinders ground state fission by as much as , and isomeric fission by . Furthermore, they note that odd-odd nuclei are hindered by factors close to that of the product of the two odd- neighbors. This hindrance is attributed to either an effective increase in barrier height due to reduced pairing, the possible necessity to conserve the quantum numbers of all unpaired particles during the decay process, or a combination thereof. Trends in the rutherfordium isotopes can provide guidance for estimating these effects in the nobelium isotopes. The odd Rf nuclei have SF hindrances of the order of relative to their even neighbors. Considering that the low-lying intrinsic excited states in are most likely two-quasiparticle excitations, a SF hindrance of at least can be expected. A more qualitative statement regarding the 2-quasiparticle SF hindrance factor, , can be obtained from the observed lifetime ratios. The mean lifetime, , is inversely proportional to the penetrability, , given above. The ratio of the lifetimes can then be written as
where is the ratio of penetrabilities due to excitation and is the hindrance factor from other quantum-mechanical considerations. For s, the value of from the present data indicates that the hindrance nearly balances the effect of increased penetrability. Vandenbosch and Huizenga Vandenbosch and Huizenga (1973) noted that for estimating the contribution of fission to competing decay modes from excited states, the fission lifetime is typically expected to decrease by a factor of approximately per MeV of excitation. Recalling the 1 MeV excitation known in 244Cm, a rough estimate of can be made for , implying a SF hindrance of . However, using only 700 keV as thermal excitation, , one finds a more conservative value of . Given the uncertainties in such an extrapolation, these values are consistent with that obtained from the naive quasiparticle estimate. It should be noted that for thinner barriers, the relative increase in penetrability is less than which would also lead to a somewhat smaller value for . In any event, a large SF hindrance factor has been observed for this configuration. A strong fission branch from a -isomer would be unique. The authors of Ref. Hall et al. (1989) determined a very small spontaneous fission branch () from the isomer in 256Fm from two observed SF decays. That work reported a value of , which is vastly different from that found in the present experiment. This large difference could be reconciled if there are unexpected effects in the systematics of fission barriers and barrier shapes in the superheavy region.
High- isomers have been reported in 254NoGhiorso et al. (1973); Tandel et al. ; Herzberg et al. , 252NoRobinson et al. , and 251NoHeßberger et al. (2004). The present data provide evidence to suggest that another isomer in the No isotopes has been discovered. To further explore this possibility, the deformed shell model in the nobelium region has been used to determine what isomers may be expected. As mentioned earlier, one other even-even isomer in the isotones is known: a 34 ms level in 244Cm is assigned to a state at 1040 keV Akovali (2003). Table 5 compares the half-lives and, where available, production ratios of ground and isomeric states for all reported isomers in the even-even transuranic nuclei.
| Isotope | Ref. | |||||
|---|---|---|---|---|---|---|
| 244Cm148 | 34ms | 18.1 y | Akovali (2003) | |||
| 250Fm150 | 1.8s | 30min | 0.3 | (,) | Ghiorso et al. (1973) | |
| 256Fm156111A small SF branch was also reported for this isomer decay with a partial half-life of 0.8 ms. | 70ns | 172min | Hall et al. (1989) | |||
| 250No148 | 43s | 3.7s | 11.6 | 0.4 | () | this data |
| 254No152 | 0.28 s | 51 s | 0.2–0.4 | Ghiorso et al. (1973); Tandel et al. ; Herzberg et al. | ||
| 270Ds160 | 6.0ms | 1.0ms | 6.0 | 1.0 | , | Hofmann et al. (2001) |
Predictions of the excitation energy, spin and parity assignments for states in 250No have been obtained using multi-quasiparticle blocking calculations. Specifically, the set of single-particle orbitals originating from three oscillator shells (N=4, 5 and 6 for protons and N=5, 6 and 7 for neutrons) were taken from the deformed Woods-Saxon model with the universal parameters of Ref. Čwiok et al. (1987), and deformation parameters , and Möller et al. (1995). The pairing correlations were treated using the Lipkin-Nogami prescription Nazarewicz et al. (1990) with fixed strengths of Gπ=24/A MeV and Gν=17.8/A MeV that, on average, reproduce the pairing gaps in the region, as reported in Ref. Möller et al. (1995). The calculations predict a particularly favored 2-quasineutron state at 1050 keV (note that the energy does not include a correction for the additional effect of the spin-spin residual interaction that is of the order of 100 keV) with a configuration (5/2+[622],7/2+[624]). This is the same configuration as the 244mCm isotone and is a candidate for the isomer in 250No reported here.
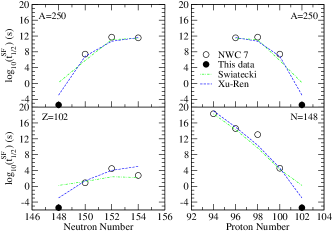
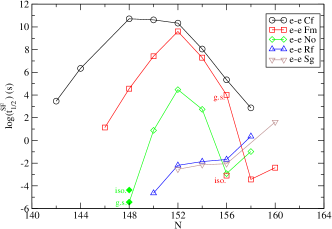
Finally, the SF systematics of even-even nuclei in the region can be compared with various semi-empirical treatments. The top panels in Fig. 4 are for the isobaric chain. The bottom panels show the isotopic and isotonic trends. Open circles are the values obtained from Ref. Audi et al. (2003), excluding systematic extrapolations. The filled symbols represent the 3.7 s half-life from the present data. The dot-dashed lines show the predictions of the six-parameter semi-empirical model of Swiatecki Swiatecki (1955), which assumes a smooth trend of the half-lives as a function of . The parameters were obtained from a fit to a limited number of nuclei available at the time of publication. The dashed lines follow the modern parameterization of Xu and Ren Xu and Ren (2005), which is based on the formula of Ref. Swiatecki (1955), but contains only four parameters which are fitted to more data, including 33 even-even isotopes from Th to Cf. The ground state half-life measured in the present experiment is shorter than any of the predictions, but clearly favors the newer parameterization of Ref. Xu and Ren (2005). Figure 5 illustrates the measured partial SF half-lives for the even-even isotopes in the region from Cf to Sg ( = 98–106). The No nuclei have the sharpest drop on either side of , which appears to indicate that nobelium gains the most stability from this deformed shell closure.
V Summary and Conclusion
The 204Pb(48Ca,2n) reaction has been measured with an isotopically enriched target. Two spontaneous fission activities were observed and unambiguously linked to the 250No compound nucleus. The shorter decay ( s) is assigned to the ground state of . The longer decay ( s) is attributed to a isomeric state of based on: 1) a smaller production cross section and 2) the prediction of a 2-quasineutron state around 1050 keV based on multi-quasiparticle blocking calculations. These results require an update to the latest compilations Tuli (2005), which assign the longer lifetime to rather than to 250mNo. Including the measurements of Ref. Belozerov et al. (2003) with the present data yields global average half-lives of and s for these two states in . There is no evidence for the 250 s SF lifetime originally reported in 1975 Ter-Akopyan et al. (1975). The present data cannot distinguish whether the isomer decays via spontaneuous fission directly or proceeds through a -forbidden -decay to the ground state, which proceeds to fission. In either case, a very large SF hindrance factor has been observed for this two-quasiparticle configuration. The presence of an isomeric level that is longer-lived than the ground state is also notable.
The search for an -decay branch was inconclusive. A single observed -like decay, with a correlation time of 19.4 s, places an upper limit on the branch of 1.8% for the ground state and 4.4% for the isomeric state. This would imply partial lifetimes, , of 205 s and 975 s for the ground and isomeric states respectively. (Inclusion of the observations of Ref. Belozerov et al. (2003) sets limits of 1.2% and 2.9% for the two decays.) The anomolously low energy observed for the single -like decay bears further investigation.
The dramatic decrease in half-life from 252No to 250No suggests that the No fission barriers decrease rapidly with neutron number to the extent that in the next even-even nobelium isotope, 248No, the fission barrier may disappear or be negligible. However, since no odd- nobelium nucleus has been observed to decay via fission, the hindrance factors must be very large and it may be possible to produce and observe the decay of 249No in a future experiment. Observation of the decay of 249No would also provide further input into the trends in the mass surface in this region. If were to also have an isomeric level that could be observed via - or - correlations, the possibility may exist to infer the single-particle configuration of the isomer with greater certainty.
VI Acknowledgments
The authors would like to thank K.-H. Schmidt for helpful discussions regarding lifetime extraction, J. P. Greene for making the targets, and the ATLAS operations staff for providing stable beams and equipment during the experiment. This work was funded by the U.S. Department of Energy, Office of Nuclear Physics, under contract nos. W31-109-ENG-38 (ANL), DE-FG02-91ER-40609 (Yale), and DE-FG02-94ER40848 (U. of Mass., Lowell).
References
- Ghiorso et al. (1973) A. Ghiorso, K. Eskola, and M. Nurmia, Phys. Rev. C 7, 2032 (1973).
- Reiter et al. (1999) P. Reiter, T. L. Khoo, C. J. Lister, D. Seweryniak, I. Ahmad, M. Alcorta, M. P. Carpenter, J. A. Cizewski, C. N. Davids, G. Gervais, et al., Phys. Rev. Lett. 82, 509 (1999).
- Herzberg et al. (2002a) R.-D. Herzberg, N. Amzal, F. Becker, P. A. Butler, A. J. Chewter, J. F. C. Cocks, O. Dorvaux, K. Eskola, J. Gerl, P. T. Greenlees, et al., Phys. Rev. C 65, 014303 (2002a).
- Herzberg et al. (2002b) R.-D. Herzberg, N. Amzal, J. E. Bastin, F. Becker, P. M. T. Brew, P. A. Butler, A. J. Chewter, J. F. C. Cocks, O. Dorvaux, K. Eskola, et al., Eur. Phys. J. A 15, 205 (2002b).
- Heßberger et al. (2004) F. P. Heßberger, S. Hofmann, D. Ackermann, P. Cagarda, R.-D. Herzberg, I. Kojouharov, P. Kuusiniemi, M. Leino, and R. Mann, Eur. Phys. J. A 22, 417 (2004).
- Oganessian et al. (1999) Y. T. Oganessian, V. K. Utyonkov, Y. V. Lobanov, F. S. Abdullin, A. N. Polyakov, I. V. Shirokovsky, Y. S. Tsyganov, G. G. Gulbekian, S. L. Bogomolov, B. N. Gikal, et al., Phys. Rev. Lett. 83, 3154 (1999).
- Oganessian et al. (2000) Y. T. Oganessian, V. K. Utyonkov, Y. V. Lobanov, F. S. Abdullin, A. N. Polyakov, I. V. Shirokovsky, Y. S. Tsyganov, G. G. Gulbekian, S. L. Bogomolov, B. N. Gikal, et al., Phys. Rev. C 63, 011301(R) (2000).
- Oganessian et al. (2004) Y. T. Oganessian, V. K. Utyonkov, Y. V. Lobanov, F. S. Abdullin, A. N. Polyakov, I. V. Shirokovsky, Y. S. Tsyganov, G. G. Gulbekian, S. L. Bogomolov, A. N. Mezentsev, et al., Phys. Rev. C 69, 021601(R) (2004).
- Oganessian et al. (2001) Y. T. Oganessian, V. K. Utyonkov, Y. V. Lobanov, F. S. Abdullin, A. N. Polyakov, I. V. Shirokovsky, Y. S. Tsyganov, A. N. Mezentsev, S. Iliev, V. G. Subbotin, et al., Phys. Rev. C 64, 054606 (2001).
- Belozerov et al. (2003) A. V. Belozerov, M. L. Chelnokov, V. I. Chepigin, T. P. Drobina, V. A. Gorshkov, A. P. Kabachenko, O. N. Malyshev, I. M. Merkin, Y. T. Oganessian, A. G. Popeko, et al., Eur. Phys. J. A 16, 447 (2003).
- Ter-Akopyan et al. (1975) G. M. Ter-Akopyan, A. S. Iljinov, Y. T. Oganessian, O. A. Orlova, G. S. Popeko, S. P. Tretyakova, V. Chepigin, B. V. Shilov, and G. N. Flerov, Nucl. Phys. A 255, 509 (1975).
- Audi et al. (2003) G. Audi, A. H. Wapstra, and C. Thibault, Nucl. Phys. A 729, 337 (2003).
- Tuli (2005) J. K. Tuli, Nuclear Wallet Cards (National Nuclear Data Center, Brookhaven National Laboratory, P.O. Box 5000, Upton, NY, 11973-5000, 2005), 7th ed., URL http://www.nndc.bnl/gov/wallet/.
- Schmidt et al. (1984) K. H. Schmidt, C. C. Sahm, K. Pielenz, and H. G. Clerc, Z. Phys. A 316, 19 (1984).
- James and Roos (1975) F. James and M. Roos, Comput. Phys. Commun. 10, 343 (1975).
- Myers and Swiatecki (1996) W. D. Myers and W. J. Swiatecki, Nucl. Phys. A 601, 141 (1996), URL http://ie.lbl.gov/txt/ms.txt.
- Liran et al. (2000) S. Liran, A. Marinov, and N. Zeldes, Phys. Rev. C 62, 047301 (2000), URL http://link.aps.org/abstract/PRC/v62/e047301.
- Muntian et al. (2003) I. Muntian, S. Hofmann, Z. Patyk, and A. Sobiczewski, Act. Phys. Pol. B 34, 2073 (2003).
- Möller and Nix (1974) P. Möller and J. R. Nix, Nucl. Phys. A 229, 269 (1974).
- Smolańczuk et al. (1995) R. Smolańczuk, J. Skalski, and A. Sobiczewski, Phys. Rev. C 52, 1871 (1995).
- Mamdouh et al. (2001) A. Mamdouh, J. M. Pearson, M. Rayet, and F. Tondeur, Nucl. Phys. A 679, 337 (2001).
- Koura (2002) H. Koura, J. Nucl. Rad. Sci. 3, 201 (2002).
- Hofmann et al. (2001) S. Hofmann, F. P. Heßberger, D. Ackermann, S. Antalic, P. Cagarda, S. Čwiok, B. Kindler, J. Kojouharova, B. Lommel, R. Mann, et al., Eur. Phys. J. A 10, 5 (2001).
- Akovali (2003) Y. A. Akovali, Nucl. Data Sheets 99, 197 (2003).
- Bjørnholm and Lynn (1980) S. Bjørnholm and J. E. Lynn, Rev. Mod. Phys. 52, 725 (1980).
- Vandenbosch and Huizenga (1973) R. Vandenbosch and J. R. Huizenga, Nuclear Fission (Academic Press, 111 Fifth Avenue, New York, NY 10003, 1973), ISBN 0-12-710850-5.
- Hall et al. (1989) H. L. Hall, K. E. Gregorich, R. A. Henderson, D. M. Lee, D. C. Hoffman, M. E. Bunker, M. M. Fowler, P. Lysaght, J. W. Starner, and J. B. Wilhelmy, Phys. Rev. C 39, 1866 (1989).
- (28) S. K. Tandel et al., to be published.
- (29) R.-D. Herzberg et al., to be published.
- (30) A. Robinson et al., to be published.
- Čwiok et al. (1987) S. Čwiok, J. Dudek, W. Nazarewicz, J. Skalski, and T. Werner, Comp. Phys. Comm. 46, 379 (1987).
- Möller et al. (1995) P. Möller, J. R. Nix, and W. J. Swiatecki, At. Data Nucl. Data Tables 59, 185 (1995), URL http://isotopes.lbl.gov/toimass.html.
- Nazarewicz et al. (1990) W. Nazarewicz, M. A. Riley, and J. D. Garrett, Nucl. Phys. A 512, 61 (1990).
- Swiatecki (1955) W. Swiatecki, Phys. Rev. 100, 937 (1955).
- Xu and Ren (2005) C. Xu and Z. Ren, Phys. Rev. C 71, 014309 (2005).