THE ANALYZING POWER FOR THE REACTION AT Q=10 MeV
Abstract
The analyzing power Ay for the reaction has been determined at the beam momentum MeV/c, corresponding to the excess energy Q = 10 MeV. In the paper the method of the data analysis is briefly presented.
pacs:
14.40.-n, 13.60.Le, 14.40.Aq110
aInstitute of Physics, Jagellonian University, 30-059 Cracow, Poland
bIKP, Forschungszentrum Jülich, 52425 Jülich, Germany
cIKP, Westfälische Wilhelms-Universität, 48149 Münster, Germany
dInstitute of Nuclear Physics, 31-342 Cracow, Poland
eInstitut für Strahlen- und Kernphysik, Rheinische Friedrich-Wilhelms-Universität, 53115 Bonn, Germany
fInstitute of Physics, University of Silesia, 40-007 Katowice, Poland
gZEL, Forschungszentrum Jülich, 52425 Jülich, Germany
†present address: Paul Scherrer Institute, 5232 Villigen, Switzerland
November 28, 2005
1 Introduction
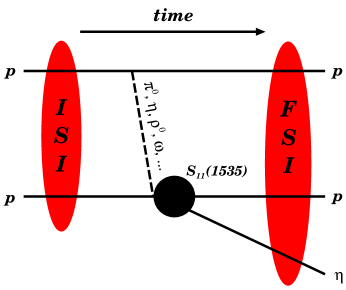
The close-to-threshold measurements of the total cross section for the reaction [1, 2, 3, 4, 5, 6], the measurements of the differential cross sections [7, 8, 9], the high statistic investigations of the pp final state dynamics [10, 11] as well as the results of the first ever analyzing power experiment for the reaction [12] are in agreement with the hypothesis that the main contribution to the production of the meson in the proton-proton collisions comes from the mesonic excitation of the S11(1535) resonance and it’s further decay into the p pair [13, 14], as depicted in Fig. 2. However, it is still not settled what are the relative contributions to the production mechanism originating from each meson exchange denoted in Fig. 2. A possible way for elucidation of this problem is a precise measurement of the polarization observables, as they are very sensitive to the model assumptions on the type of the meson being exchanged in order to excite the S11 resonance. For example, from Fig. 2, where the predictions of the analyzing power for the reaction at the excess energy Q = 10 MeV are shown, it can be noticed that the analyzing power function strongly depends on whether we deal with pseudoscalar [15] (full line) or vector meson exchange model [13] (dotted line).

Therefore, in order to verify the validity of these two models, an experiment devoted to a determination of the analyzing power for the reaction has been performed at the storage ring COSY in the Research Center Jülich in Germany. In this article we present preliminary results obtained at excess energy Q = 10 MeV, where the predictions of the models differ at most.
2 Experimental method
In the measurements a polarized proton beam [16, 17] with the momentum of pbeam = 2010 MeV/c has been used. This beam momentum value corresponds to the excess energy MeV. The beam of protons has been scattered on the clusters, which were produced by the hydrogen cluster target [18]. The COSY-11 detection setup [19, 20] has been used for the detection of the reaction products.
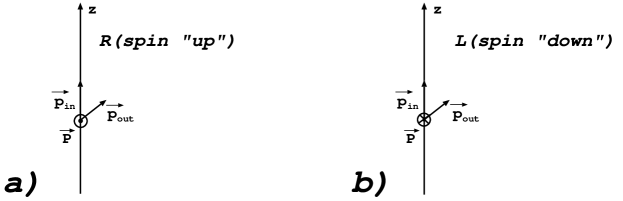
As the COSY-11 system is a one-arm detection setup, in order to register both types of events: scattered to the right and to the left side (with respect to the polarization plane) there is a need to perform the experiment with the separate cycles, in which the spin of the proton beam has to be flipped, as schematically shown in Fig. 3. In this figure we also define what is meant by the terms: ”scattering to the right” and ”to the left”. This definition strictly follows the Madison convention [21].
In the following we define the polarization plane as a plane spanned by the beam momentum vector and a polarization vector . If the incident beam consists of spin particles with a transverse polarization, which was the case in our experiment, the formula for the differential cross section for a scattering into the solid angle around and angles reads:
| (1) |
where denotes the differential cross section for a scattering of an unpolarized beam, Ay() is an analyzing power of the reaction, and is a unit vector along . is an angle between and , i.e. and denotes the angle between and . In the experiment we were restricted to the plane corresponding to in case of spin ”down” (or for spin ”up”), where the detection efficiency of the COSY-11 setup is the highest and it decreases drastically when going outside this particular scattering plane (see Fig. 4). Therefore, in what follows we will consider the scattering in this plane solely.

The total production rate to the right NR and to the left side NL can be expressed as follows:
| (2) |
| (3) |
where the E E is the function of the efficiency of the COSY-11 detection system, LR/L stands for the luminosity for spin up/down, and tR/L denotes the time of the measurement with spin up/down, respectively. The polarization degrees PR for spin up and PL for spin down are equal within the 5% of accuracy, as has been shown in the previous measurements by means of the EDDA polarimeter [22]. Therefore for the further considerations we will assume that PL=P P. Dividing equation 3 by 2, and introducing a relative luminosity:
| (4) |
results in the following formula for the analyzing power:
| (5) |
Therefore, the values of the relative luminosity Lrel, the spin-averaged polarization degree P, together with the production rates to the right NR, and to the left side NL are the physical observables to be found in order to determine the analyzing power function Ay. In the following subsections the methods used to obtain these quantities will be presented.
2.1 Calculations of the relative luminosity and polarization
The experiment has been performed with the 300 s long cycles, for which the spin of the incident proton beam has been flipped from cycle to cycle. This method was intended to reduce the systematical uncertainties caused by the change of the beam parameters due to the variation of the target densities. The duration of the cycle has been set up in such a manner, that it was significantly shorter than the time scale (10 hours) for the substantial changes of the density of the target.
For the determination of the relative luminosity a detection system consisting of two pairs of the scintillators placed in the polarization plane have been used [23]. Due to the parity invariance, a cross section for any scattering into this plane does not depend on the polarization degree. Thus, the number of the coincidences between scintillators has been used as a measure of the absolute luminosity. Following the definition given in eq. 4, we can express the relative luminosity as a ratio of the number of coincidences in the polarization plane during the cycles with spin ”up” () and ”down” ():
| (6) |
The relative luminosity determined using eq. 6 was found to be Lrel=0.96468 0.00065.
The detailed method of determination of the averaged polarization value has been described in [23]. For the calculations the assymetry of the elastically scattered events in the plane perpendicular to the polarization plane has been found for different scattering angles in the center-of-mass system (CM). In order to determine the values of the analyzing powers for the beam momentum of pbeam = 2010 MeV, the linear interpolations between available experimental results for the proton-proton elastic scattering at and 2025 MeV/c have been used. Two data sets of the analyzing powers for the reaction for the mentioned above beam momenta, as measured by the EDDA collaboration [22] at different CM scattering angles, are presented in Fig. 6.
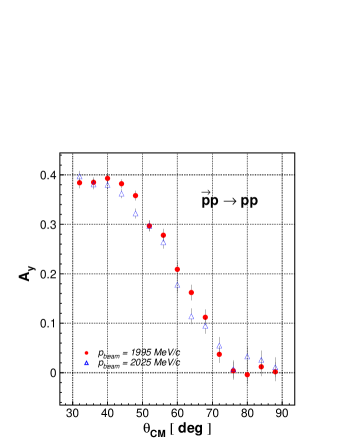
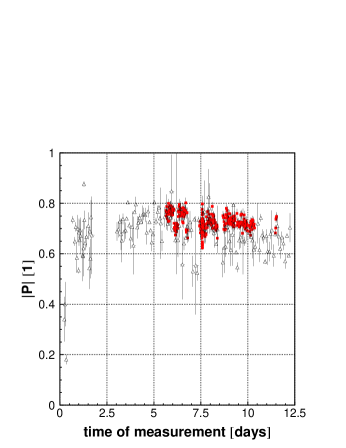
Fig. 6 depicts the variation of the beam polarization during the time of the measurement. Data sets obtained using the COSY polarimeter [24](open circles) are confronted with the results of the measurements with the COSY-11 polarimeter [25, 26, 23](full circles). An agreement between both sets of data is visible in Fig. 6. The average value of the beam polarization for the whole period of the measurement was found to be P=0.680 0.010.
2.2 Determination of the background free production rates for the reaction
A typical missing mass spectrum for the reaction as measured using the COSY-11 detection setup is presented in Fig. 7. Figure shows the spin-averaged missing mass spectrum, gathered during the whole time of the experiment. Over the wide multi-pionic background a clear peak originating from the meson production is visible.

Optimizing the statistics and the expected shape of the analyzing power function, the range of the center-of-mass polar angles of the meson emission has been divided into four bins. To separate the actual production rates from the background, the reactions with multi-pionic production as well as the events with production have been simulated, using a program based on the GEANT3 [27] code. Generated events which fulfilled conditions equivalent to the experimental trigger have been analyzed in the same way as the experimental data. In such a way we have obtained the missing mass shapes of the background reactions () as well as the shape of the signal (). In order to perform credible simulations of the missing mass spectra the geometry of the drift chambers (used for the momentum reconstruction) as well as the position and geometrical parameters of the target have to be known precisely. The angle and the relative position of the COSY-11 drift chambers (2 parameters), a target position (3 parameters) and a relative shift between the beam and a target (1 parameter) have been optimized using the elastically scattered events and the method described in [29, 11].
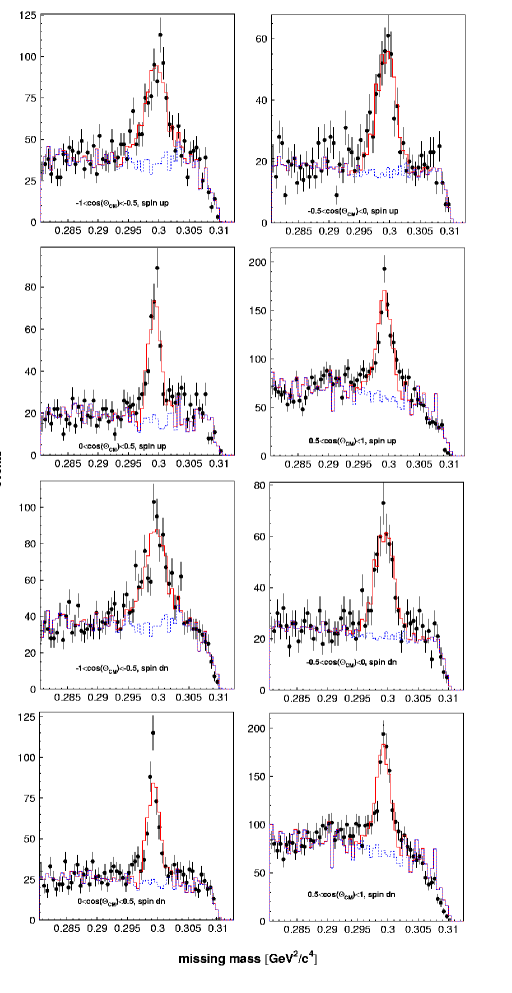
The multi-dimensional fit of the simulated missing mass spectra to the corresponding experimental histograms has been performed using the MINUIT [28] minimization package. The fit has been performed simultaneously to 8 histograms (see Fig. 8), each with 60 points. The of the fit have been minimized as a function of six parameters: scaling factors of the generated background and signal reactions (altogether 4 parameters) and 2 parameters responsible for the spread and the absolute value of the beam momentum. The detailed process of the search for the best values of these parameters will be described elsewhere [30], here we would only like to report that the minimum value of was found to be 1.62, corresponding to the spread of the beam momentum equal to 0.2 MeV/c and the shift from the nominal beam momentum equal to 2.1 MeV/c. These values are in a good agreement with results of previous COSY-11 experiments [29].
In Fig. 8 the missing masses for the individual subranges, separately for spin up (upper panel) and down (lower panel), are shown. Full dots correspond to the experimental data, the dotted line depicts the shape of the background, whereas the solid line represents the best fit of the Monte-Carlo data to the experimental spectra.
3 Results
Preliminary results of the analyzing power function A are presented in Fig. 9 as the full dots. The dotted line shows the predictions determined according to the vector meson exchange model [13], whereas the solid line refers to the pseudoscalar meson exchange model [15]. The errors are of the statistical nature only.

4 Conclusions
The preliminary analyzing power results are bared with rather large statistical uncertainties, therefore a statement on the mechanism of the meson production relying on this set of data is currently unclear. As can be seen from Fig. 9 the data point at tend to prefer the pseudoscalar meson exchange model [15], whereas the data point at is slightly more in line with the predictions of the vector meson exchange model. The results show rather small values of the analyzing power in the close-to-threshold region, which may be the indication of the production to the -wave final state, solely. However, for this statement the exact partial wave analysis remains to be done.
We acknowledge the support of the
European Community-Research Infrastructure Activity
under the FP6 ”Structuring the European Research Area” programme
(HadronPhysics, contract number RII3-CT-2004-506078),
of the FFE grants (41266606 and 41266654) from the Research Centre Jülich,
of the DAAD Exchange Programme (PPP-Polen),
of the Polish State Committe for Scientific Research
(grant No. PB1060/P03/2004/26),
and of the
RII3/CT/2004/506078 - Hadron Physics-Activity -N4:EtaMesonNet.
References
- [1] \referA.M. Bergdolt et al.Phys. Rev.D4819932969
- [2] \referE. Chiavassa et al.Phys. Lett.B3221994270
- [3] \referH. Calén et al.Phys. Lett.B366199639
- [4] \referH. Calén et al.Phys. Rev. Lett.7919972642
- [5] \referF. Hibou et al.Phys. Lett.B438199841
- [6] \referJ. Smyrski et al.Phys. Lett.B4742000182
- [7] \referH. Calén et al.Phys. Lett.B4581999190
- [8] \referB. Tatischeff et al.Phys. Rev.C622000054001
- [9] \referM. Abdel-Bary et al.Eur. Phys. J.A162003127
- [10] \referP. Moskal et al.Phys. Rev.C692004025203
- [11] P. Moskal: Hadronic interaction of and mesons with protons, Habilitation Dissertation No. 364, Jagellonian University Press (2004); e-Print Archive: hep-ph/0408162
- [12] \referP. Winter et al.Phys. Lett.B5442002251; erratum-ibid. B553 (2003) 339
- [13] \referG. Fäldt and C. WilkinPhys. Scripta642001427
- [14] \referC. HanhartPhys. Rept.3972004155
- [15] \referK. Nakayama et al.Phys. Rev.C652002045210
- [16] \referD. Prasuhn et al.Nucl. Instr. & Meth.A4412000167
- [17] H. Stockhorst: Polarized Proton and Deuteron Beams at COSY in the Proceedings of the second symposium on threshold meson production in pp and pd interaction, ed. P. Moskal; Schriften des Forschungszentrum Jülich, Matter and Materials 21 (2004) pp. 106-121; e-Print Archive: physics/0411148
- [18] \referH. Dombrowski et al.Nucl. Instr. & Meth.A3861997228
- [19] \referS. Brauksiepe et al.Nucl. Instr. & Meth.A3761996397
- [20] \referJ. Smyrski et al.Nucl. Instr. & Meth.A5412005574
- [21] Madison Convention, in Polarisation Phenomena in Nuclear Reactions, University of Wisconsin Press, Madison (1971) pp. XXV
- [22] \referM. Altmeier et al.Phys. Rev. Lett.8520001819
- [23] R. Czyżykiewicz: COSY-11 as a polarimeter in the Proceedings of the second symposium on threshold meson production in pp and pd interaction, ed. P. Moskal; Schriften des Forschungszentrum Jülich, Matter and Materials 21 (2004) pp. 122-137.
- [24] \referF. Bauer and K. BüsserNucl. Instr. & Meth.A4311999385
- [25] I.-A. Pellmann: Diploma Thesis (1999), Berichte des FZ-Jülich, Jül-3686.
- [26] P. Kowina et al.: contribution to the Annual Report of IKP (2001) pp. 14, Berichte des FZ-Jülich, Jül-3978.
- [27] GEANT — Detector Description and Simulation Tool, CERN Program Library Long Writeups W5013 (1994)
- [28] MINUIT — Minimization Package, CERN Program Library Long Writeups D506 (1994)
- [29] \referP. Moskal et al.Nucl. Instr. & Meth.A4662001448
- [30] R. Czyżykiewicz: PhD Dissertation at the Jagellonian University, in preparation