Present Address: ]Department of Physics, Faculty of Science and Technology, Tokyo University of Science, 2641 Yamazaki, Noda, Chiba 378-8510, Japan
Present Address: ]ICEPP, University of Tokyo, 7-3-1 Hongo, Tokyo 113-0033, Japan Present Address: ]Physics Department, Graduate School of Science, Tohoku University, Sendai 980-8578, Japan Present Address: ]ICEPP, University of Tokyo, 7-3-1 Hongo, Tokyo 113-0033, Japan
Nuclear mass number dependence of inclusive production of and mesons in 12 GeV + collisions
Abstract
The inclusive production of and mesons is studied in the backward region of the interaction of 12 GeV protons with polyethylene, carbon, and copper targets. The mesons are measured in decay channels. The production cross sections of the mesons are presented as functions of rapidity and transverse momentum . The nuclear mass number dependences ( dependences) are found to be for mesons and for mesons in the region of and GeV/.
pacs:
13.85.Ni, 13.85.Qk, 14.40.CsI Introduction
The modification of the vector meson spectral function in hot and/or dense matter is currently a hot subject in terms of spontaneous chiral symmetry breaking and partial restoration of the symmetry in nuclear matter. Currently, this is the focus of several experiments Agakishiev et al. (1998); Huber et al. (2003); Suzuki et al. (2004); Trnka et al. (2005). The experiment KEK-PS E325 was performed to measure the vector meson spectral functions in dense matter, i.e., nucleus. Thus far, we have reported the signature of the mass modification of vector mesons Ozawa et al. (2001); Naruki et al. (2006); Muto et al. (2005). These observations are fairly remarkable; hence, we also performed analyses to determine the absolute cross sections and nuclear mass number dependences of the production of these mesons in order to understand the underlying production mechanism.
The nuclear mass number dependence of the cross sections for the particle production is usually parameterized as
| (1) |
for a target nucleus with mass number . When the collision energy is sufficiently large, the parameter in the production of light mesons like pions or mesons is about 2/3 Ono et al. (1979); Binkley et al. (1976). This can be interpreted by considering such productions to be dominated by primary collisions at the front surface of a target nucleus. Note that the mean free path of incident protons in a nucleus is as small as 1.4 fm. On the other hand, tends to unity in the case of hard reactions like the production of at high energies, GeV Binkley et al. (1976); Alessandro et al. (2004); Husemann (2005).
The present experiment was performed at GeV. At higher energy, for meson production was reported to be , , and at Aleev et al. (1992), 14.2 Daum et al. (1983), and 15.1 GeV Bailey et al. (1984), respectively. However, there is no reason to believe that these values are applicable at our energy. A few heavy ion induced experiments at from 4.9 to 5.4 GeV Back et al. (2004); Akiba et al. (1996) reported meson production data, to which the present experiment can provide complementary data. Note that there have been no measurements of mesons and mesons with + reactions at around 5 GeV.
A meson is almost a pure state. Therefore, the production of a meson without other accompanying strange particles is suppressed by the Okubo-Zweig-Iizuka rule Okubo (1963). This results in the effective threshold energy being as high as GeV, which corresponds to , since two pairs are effectively needed to realize the production. Our collision energy is fairly close to this effective threshold. In addition, the importance of additional mechanisms for meson production, such as an intrinsic component in nucleons Ellis et al. (2000) and coupling von Rotz et al. (2000); Nakayama et al. (2001), have been suggested by theorists; however, they have thus far been insufficiently studied at our energy from an experimental viewpoint. Thus, to understand the production mechanism at our energy, basic measurements such as production cross sections and parameters are indispensable.
In this article, we present inclusive production cross sections and parameters of and mesons measured via the decay channels in 12 GeV , + C, and + Cu collisions. The results are compared to those from nuclear cascade simulation jam Nara et al. (2000), and the implications to production mechanisms are discussed.
II Experiment
The spectrometer was built in the EP1-B beam line at the 12 GeV proton synchrotron in KEK. The beam line was designed to deliver a 12 GeV primary proton beam with an intensity of up to protons per spill. The beam was extracted for 1.8 s with a repetition rate of 1/4 Hz. The beam intensity was monitored with about 10% accuracy using ionization chambers Sugaya et al. (1996) located downstream of the spectrometer.
Figures 1 and 2 show a top view and a side view of the experimental setup, respectively. The spectrometer was designed to simultaneously measure and pairs. A dipole magnet and tracking devices were commonly used together with electron and kaon identification counters.

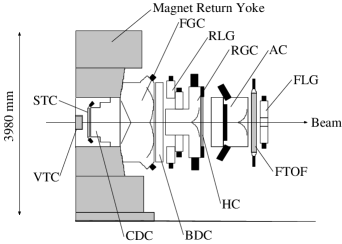
The magnet was operated at 0.71 T at the center of the dipole gap and provided 0.81 T m of field integral for the tracking. The magnetic field map was calculated by the finite-element-analysis software tosca Simkin and Trowbridge (1979). The calculated map agreed well with the measured map, and the difference was negligible when compared to the momentum resolution of this spectrometer. During the data collection periods, the field strength was monitored every 4 s with a nuclear-magnetic-resonance (NMR) probe located at the center of the surface of the lower pole piece. The magnetic field map was scaled run by run according to the NMR data. The fluctuation of the magnetic field was found to be less than within a typical run of two hours long.
The targets were aligned inline along the beam axis at the center of the magnet. The target materials and configurations are shown in Table 1.
| year | target |
|
|
|
|
trigger | |||||||||||
| CH2 | 0. | 111 | 0. | 195 | electron | ||||||||||||
| 1999 | C | 0. | 106 | 0. | 213 | / kaon | |||||||||||
| Cu | 0. | 0391 | 0. | 412 | |||||||||||||
| 2002 | C | 0. | 213 | 0. | 431 | electron | |||||||||||
| Cu | 24, 48 | . | 0539 | . | 565 | ||||||||||||
The beam profile in the horizontal direction was measured by counting the interaction rate by changing the beam position at the target. The beam position was moved by the bending magnet located about 10 m upstream of the target. In this measurement, the center target, whose thickness was 1 mm, was rotated by around the vertical axis, and was used as a 1 mm-wide probe. The typical beam size in the horizontal direction was found to be 2.0 mm in full-width half-maximum. The beam size in the vertical direction was known to be almost the same as in the horizontal direction as seen in a view of a luminescence plate which was temporarily inserted during the beam tuning.
Three tracking devices—the vertex tracking chamber (VTC), cylindrical drift chamber (CDC), and barrel drift chamber (BDC)—were used to determine the trajectories of the charged particles. In the present analysis, the momentum was determined using CDC and BDC. The momentum resolution was (GeV/), where is the momentum of a particle.
For the electron identification, two types of gas Čerenkov counters (FGC and RGC) and three types of lead glass calorimeters (SLG, RLG, and FLG) were employed. The gas Čerenkov counters were horizontally segmented into 6∘. The radiator of the gas Čerenkov counters was isobutane at room temperature and atmospheric pressure. The refractive index is 1.00127 at the standard temperature and pressure, which corresponds to a momentum threshold of 2.26 GeV/ for charged pions. All lead glass detectors were built with SF6W Kawabata et al. (1988) and were typically segmented to 3.5∘ horizontally. The typical energy resolution for 1 GeV electrons is 0.15 GeV. The acceptance for electrons ranged from 12∘ to 90∘ in the horizontal direction and from to 22∘ in the vertical direction.
The counters for the kaon identification were start timing counters (STC), hodoscopes (HC), aerogel Čerenkov counters (AC), and time of flight counters (FTOF). The acceptance for kaons ranged from 12∘ to 54∘ in the horizontal direction, and from to 6∘ in the vertical directions. The three counters (STC, AC, and FTOF) were horizontally segmented to 6∘, and HC was typically segmented horizontally to 3∘. The time of flight (TOF) of charged particles was measured using STC and FTOF with a resolution of 0.36 ns and flight length of about 3.7 m. Kaons and pions were separated in a momentum range from 0.53 to 1.88 GeV/ using an aerogel with a refractive index of 1.034.
The electron trigger signal required a hit in FGC accompanied by a geometrical coincidence with RGC, SLG, or RLG. To select events containing pairs with large opening angles, both the left and the right arms were required to contain at least one or candidate. The typical efficiency of the trigger for the electron pairs in the acceptance was 92.4%.
The kaon trigger signal was obtained from the coincidence of STC, HC, and FTOF. The charged pion contamination was reduced by using AC as a veto trigger. Proton contamination was reduced by setting a TOF window for the kaons by using a rough momentum value calculated by combining the hits in STC, HC, and FTOF in the trigger.
The number of recorded events for electron data were and in 1999 and 2002, respectively. A detailed description of the spectrometer can be found in Ref. Sekimoto et al. (2004).
III Data Analysis
III.1 Analysis of and in + C and + Cu collisions
III.1.1 Event reconstruction
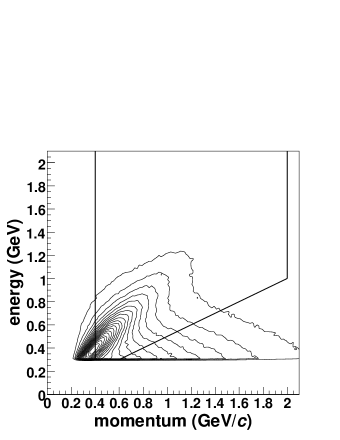
The charged tracks were reconstructed from hit positions in the drift chambers by using the Runge-Kutta fitting method. After the tracks were reconstructed, tracks corresponding to momenta between 0.4 and 2.0 GeV/ were selected for further analyses. The lower limit in the momentum range was set based on the threshold of the trigger, whereas the upper was set in order to avoid pion contamination above the gas Čerenkov threshold.
Pairs of positive and negative tracks were required to satisfy the trigger condition. All the and candidates were reexamined so that an FGC hit association could be obtained with an RGC, SLG, or RLG association, depending on the location of the track. For candidates associated with lead glass calorimeters, the momentum ratio should be larger than 0.5 for energy in the calorimeters to be obtained. We chose the value of 0.5 balancing the purity of and with the statistics of the present data. Figure 3 shows the distribution of the energy and momentum of the present data with FGC associations. In this figure, it is clearly seen that electrons range along the line of . After an pair was detected, we simultaneously refit the and tracks by constraining them to have the same vertex point on the interaction target. Finally, we identified pairs.111 In a further analysis, we used only events in which went into the left arm and went into the right arm because the number of events satisfying the opposite criterion comprised only 6% of the data.
The reconstruction efficiency of the tracks from the targets was evaluated by both an eye-scan and a detector simulation using geant4 Agostinelli et al. (2003).
In the former method, first we used only one of the two arms and determined the target in which an interaction occurred. Then we visually scanned about 200 event displays and found track candidates in the other arm using the drift chamber hit information with help from the interaction point. The tracking efficiency was evaluated by seeing if the tracking program could find those eye-scanned track candidates. The efficiency was found to be 67% on average.
In the detector simulation method, the reconstruction efficiency was evaluated using simulation tracks embedded onto the real data. According to this method, the efficiency was found to be 78%.
In order to combine the results of the two evaluations, we simply assumed the average 73% to be the efficiency in the present analysis and considered half the difference as a systematic error. The reason of this discrepancy is unknown, and this is one of the major sources of the systematic uncertainty in the present data analysis.
The inefficiency of the vertex reconstruction process was evaluated as follows. We took all the combinations of and tracks regardless of the position of the closest point of each pair, and obtained the yield of the meson peak. Then we used the vertex reconstruction program and the required the event vertex belong to any of the target disks. In addition, we fit the and tracks together by constraining them to have the same vertex point on the interaction target, and required that the over the number of degrees of freedom (NDF) should be less than 5. As a result, we lost 6.0% of the meson yield, so that the vertex reconstruction efficiency was 94.0%.
Contaminations due to the misidentification of pions and other particles in the present data were evaluated at the mass region of the meson, i.e., from 0.75 to 0.80 GeV/, by tightening the electron identifications with gas Čerenkov counters and lead glass calorimeters until the misidentification becomes negligibly small. In this mass region, in the + C data, we found that 18% of the events result from misidentification and 18% are from uncorrelated pairs.
III.1.2 Corrections
Besides the tracking efficiency, several detector effects were evaluated and corrected as described below. The efficiencies of the electron identification counters were evaluated as a function of momentum by using pure electron samples from conversions and Dalitz decays. These electron samples were identified as a zero-mass peak in the spectra, and they were not required to participate in the trigger to avoid trigger bias. The obtained efficiencies were typically 85% for FGC, 86% for RGC, and 97% for the lead glass counters.
The energy losses of the tracks through the detectors were estimated by using geant4 simulation. Typically, the reconstructed momentum gave a value lower by 3 MeV/ for a 1 GeV/ electron due to the energy loss. The momentum difference was corrected track by track by using a correction table obtained by the simulation. It should be noted that this correction compensated only mean energy loss. For effects that cause an eventual large energy loss like bremsstrahlung, the corrections were carried out in a different manner, as described later.
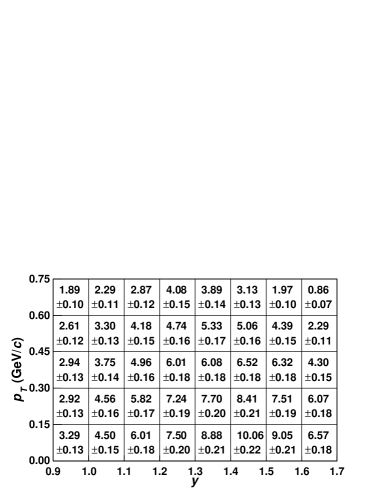
The geometrical acceptances for vector mesons were obtained as functions of the invariant mass, rapidity , and transverse momentum by the simulation. The acceptances were averaged over azimuth , and isotropic decays of were assumed. The effects of the trigger, i.e., requirements of a geometrical correlation between the electron identification counters, were also considered. In order to obtain the yields of vector mesons, mass spectra were corrected for the acceptance in the mass range above 0.55 GeV/. Below 0.55 GeV/, the correction was too large to evaluate reliable values. The obtained acceptances at the and the meson masses are tabulated in Fig. 4.

III.1.3 Spectrum decomposition
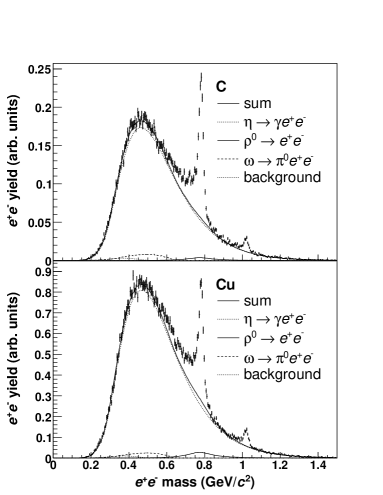
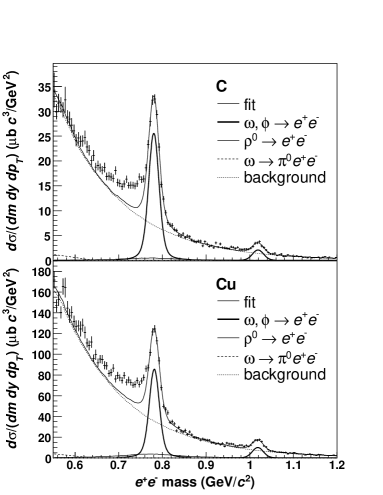
In Fig. 5, the left and the right panels show the spectra of the invariant mass of pairs in the range of and GeV/ without and with the acceptance correction, respectively. The peaks of and are distinctly observed.
The mass spectra were fit and decomposed into the dielectron decays , , and ; the Dalitz decays , , , and ; and the combinatorial background. The origins of the combinatorial background were pairs which were picked up from two independent Dalitz decays or conversions, and pairs like due to the misidentification. The Dalitz decay contribution is negligible in the acceptance of the present data.
For the invariant mass distributions of the and decays, we used in the fit a Breit-Wigner function
| (2) |
convoluted with a Gaussian function for the experimental resolution. If the relativistic Breit-Wigner shape is used instead, the results do not change significantly. Here, is the cross section; , the invariant mass of the pair; , a normalization factor; , the meson mass; and , the natural decay width. For the shape of the decay, we used the relativistic Breit-Wigner shape
| (3) |
instead of the Breit-Wigner function. To obtain the mass distribution in the spectrometer acceptance, we used the geant4 simulation with an input momentum distribution of mesons that was obtained using jam. The invariant mass spectra from the Dalitz decays of , , and mesons were also obtained by the simulation. Their distributions were determined by following the vector meson dominance model given in Ref. Faessler et al. (2000) by using the mother meson distributions obtained by jam. The combinatorial background shape was evaluated using an event mixing method, combining and tracks picked from different events.
The free parameters of the fit were the yields, the peak positions, and the mass resolutions of and mesons; the yields of and mesons; and the number of the background events. As mentioned earlier, the spectra were corrected in a mass range only above 0.55 GeV/. Therefore, below 0.55 GeV/, the uncorrected spectra were used in the fit mainly to accurately obtain the amount of the background. Although the fit region was from 0.20 GeV/ to 1.2 GeV/, the mass regions from 0.600 to 0.765 GeV/ and from 0.955 to 0.985 GeV/ were excluded in order to avoid the effect of the excesses below the and peaks, which in other publications Ozawa et al. (2001); Naruki et al. (2006); Muto et al. (2005) we have claimed as the signal of the mass modification. In the present analysis, however, we did not assume any underlying physics for the excess, and we aimed only to obtain the yields of and mesons correctly, as discussed later.
The fit results are shown by thin solid lines in Fig. 5. The were obtained as 157/152 and 192/152 for the + C and + Cu interactions, respectively.
After obtaining the raw yields of the and mesons by the fit, the correction for hard energy losses such as bremsstrahlung or a radiative tail was applied. The hard energy loss causes a low mass tail in the invariant mass distribution. The loss of the yield due to this tail could not be evaluated using the procedure described above; hence, we performed studies using the geant4 simulation. The yields of the tails with respect to the integrals of the Breit-Wigner peaks were found to be % for the mesons and % for the mesons. These values were simply added to the peak yields. The uncertainty of these corrections includes an ambiguity with respect to the cross sections of such hard energy losses in geant4.
By the fit procedure described above, the peak position and mass resolution of the meson were obtained as MeV/ and MeV/, respectively. The peak position of the meson is consistent with the values of the Particle Data Group Hagiwara et al. (2002), and the mass resolution is consistent with the simulation value of 10.7 MeV/; however, the peak position of the meson was found to be lower by 2.2 MeV/. The width of the omega mesons was also broader than that expected by the simulation.222 If we take internal bremsstrahlung into account, the peak positions of both the mesons and the mesons agree with the expected positions. Here, we adopted a conservative approach in order to obtain the yield of unmodified mesons by estimating the additional systematic error due to this peak shift. The error for the meson yield was evaluated as 0.48% for a + C interaction and 1.8% for a + Cu interaction, which were obtained by forcing the peak position in the fit to the higher value of 2.2 MeV/. The momentum scale and resolution were also verified using the data Muto et al. (2005). The measured peak position of was MeV/, which was consistent with that of the simulation result, 496.9 MeV/. The measured mass resolution of was MeV/, which was expected to be 3.5 MeV/ by the simulation.
III.1.4 Systematic errors
In addition to the uncertainties described previously, the following systematic uncertainties were studied to obtain the cross sections.
The uncertainty in the background shapes could be a source of the systematic error. The background was a result of uncorrelated pairs that were obtained from two independent Dalitz decays, conversions, or other meson decays. The background shape was obtained by an event mixing technique. In the mixing process, it is possible that the correlated pairs from the decays of , , and mesons deform the estimated background shape; this could result in a systematic error. In order to estimate the systematic error, two methods were used in the event mixing. One was to use all electrons except for those belonging to the and meson mass regions, which are 0.765 to 0.800 GeV/ and 0.995 to 1.035 GeV/, respectively. In the other method, we used all the pairs in the event mixing but with weights in order to obtain a self-consistent shape of the background. The weights were obtained as a function of the mass as the ratio of the background shape to the real mass spectrum, and they were self-consistently determined by repeating the fit several times. We adopted the latter method to determine the background shape. The difference between the two methods was assigned as a systematic error. The difference in the yield of mesons was 0.23% and that in mesons was 0.60%.
The normalization and spectral shape of the combinatorial background were affected by all the other correlated components since they were obtained by the fit. The systematic errors in the peak-yield determination due to the ambiguity of the Dalitz decays of , , and mesons were evaluated by doubling or eliminating those yields and refitting the mass spectra. These systematic errors were found to be 0.62% and 0.85% for and mesons, respectively.
It was difficult to consider the uncertainty of the shape, since the mass region from 0.600 to 0.765 GeV/ could not be represented by known sources, and the shape of the mass modification was not well understood. In this analysis, we simply considered the relativistic Breit-Wigner shape for the distribution and performed a fit by excluding the excess region. In order to evaluate the systematic error, we fixed the yield at zero as an extreme case and reperformed the fit. In this fit, the yield increased by 3.19% for the carbon target and 7.65% for the copper target; further, the meson yield increased by 3.45% and 5.48% for each of the above targets, respectively. We considered these values as systematic errors due to the unknown distribution. It should be noted that the mesons can also be modified such that the cross sections obtained in the present analysis are only for that component whose shape is consistent with the un-modified shape.
A possible cause of another error might lie in the efficiency estimations for electron identification. These uncertainties were evaluated by using the error bands of efficiency curves of electron identification counters and were obtained as 2.92% for mesons and 2.60% for mesons.
All the systematic errors are summarized in Table 2. In the evaluation of the absolute cross section, the errors of the beam intensity, target thicknesses, and efficiency of the trigger electronics were also considered. In summary, the systematic errors for the cross sections for mesons were 19.5% for the carbon target, and 20.8% for the copper target, and those of mesons were 19.5% and 20.0%, respectively.
|
|
||||||||||||||||||||
|---|---|---|---|---|---|---|---|---|---|---|---|---|---|---|---|---|---|---|---|---|---|
| acceptance | % | % | |||||||||||||||||||
| hard energy loss | % | % | |||||||||||||||||||
| electron identification | % | % | |||||||||||||||||||
| background shape | % | % | |||||||||||||||||||
| mass scale for + C | % | ||||||||||||||||||||
| mass scale for + Cu | % | ||||||||||||||||||||
| Dalitz yield | % | % | |||||||||||||||||||
| from + C | % | % | |||||||||||||||||||
| from + Cu | % | % | |||||||||||||||||||
| total for + C | % | % | |||||||||||||||||||
| total for + Cu | % | % | |||||||||||||||||||
The systematic errors for the parameters are only due to the items that differ between carbon and copper targets. These are listed in Table 3. In summary, the uncertainties for the parameters of and mesons were 5.2% and 1.9%, respectively.
| acceptance | % | % | |
|---|---|---|---|
| target thickness | % | % | |
| background shape | % | % | |
| mass scale | % | ||
| Dalitz yield | % | % | |
| yield | % | % | |
| total | % | % |
III.2 Extraction of the cross section in interaction
The target subtraction method was employed to obtain the cross section in collisions; this was achieved by using the data taken in 1999. The production cross sections in collisions were calculated by the formula CHC in the region of and GeV/. The analysis was performed in almost the same manner as that for the data in 2002.
To minimize the uncertainty due to experimental differences between the 1999 and 2002 data, we normalized the yield of mesons with carbon targets in the 1999 data to that in 2002 data and extracted the absolute cross sections in collisions. Another uncertainty arose from the difference in the target thicknesses that were measured with an accuracy of 0.8%. We obtained 20.1% and 20.0% as the systematic uncertainty in collisions for the meson production and meson production, respectively.
IV Result and discussion
IV.1 Global feature of the obtained results
From the decay branching fractions listed in Table 4, the differential cross sections of the inclusive meson production are obtained as mb/GeV and mb/GeV in + C and + Cu collisions in the region of and GeV/, respectively; further, those of meson production are mb/GeV and mb/GeV, respectively.333 In this article, neither the effect of internal bremsstrahlung nor the uncertainty of the branching fractions is considered. The parameters of and mesons are obtained as and , respectively. The difference is , and it is statistically significant.
| decay mode | branching fraction | |
|---|---|---|
| % | ||
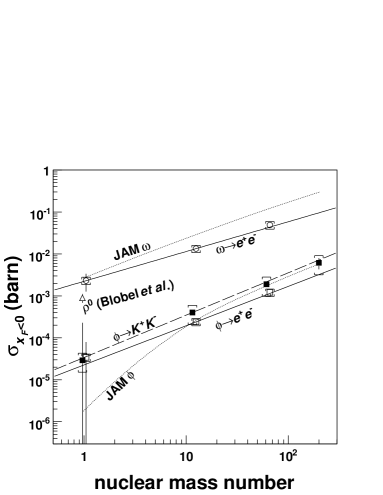
In order to compare the production cross sections in the decay channels with those in the decay channel and the previous measurement of 12 GeV/ by Blobel et al. Blobel et al. (1974), the present data were extrapolated to the backward hemisphere—region of or —where is Feynman’s . The production cross sections in the backward hemisphere are listed in Table 5. The correction factors for this extrapolation from the measured regions— and GeV/—to the backward hemisphere were calculated by using jam, since the shapes of and spectra are consistent with the result of jam calculation, as described later.
| (mb) | () (mb) | () (mb) | |||||||||||||||||||
|---|---|---|---|---|---|---|---|---|---|---|---|---|---|---|---|---|---|---|---|---|---|
| H | 2 | . | 3 | 1 | . | 1 | 0 | . | 5 | 0. | 034 | 0. | 045 | 0. | 007 | 0. | 03 | 0. | 19 | 0. | 01 |
| C | 13 | . | 4 | 0 | . | 3 | 2 | . | 6 | 0. | 240 | 0. | 015 | 0. | 047 | 0. | 39 | 0. | 05 | 0. | 19 |
| Cu | 49 | . | 0 | 1 | . | 3 | 10 | . | 2 | 1. | 21 | 0. | 07 | 0. | 24 | 1. | 84 | 0. | 27 | 0. | 89 |
| Pb | 6. | 0 | 1. | 8 | 2. | 9 | |||||||||||||||
The cross sections of the inclusive meson production in the decay channel are also listed in Table 5. These were obtained from the previous analysis in this experiment Yokkaichi (2000); Ishino (2000). The parameter of the meson production measured in the decay channel is obtained as using the , + C, + Cu, and + Pb data in the spectrometer acceptance; this value is statistically consistent with the present analysis.
Figure 6 shows the cross sections in the backward hemisphere as a function of the nuclear mass number. The dotted lines represent the result of the jam calculation and the solid and dashed lines represent the measured parameterization. The parameters shown in the figure were 0.710, 0.937, and 1.01 for the data of , , and , respectively. It should be noted that these values were obtained from the data within the spectrometer acceptance before they were extrapolated to the backward hemisphere.
The previous measurement Blobel et al. (1974) yielded the total cross section of mb for mesons. By assuming a ratio of ,444 The ratio was measured by the reactions of + charged particles and + charged particles Blobel et al. (1974). we obtain the meson production in the backward hemisphere as mb for a comparison with the present measurement. The triangle in Fig. 6 represents the obtained value. The measured meson production cross section in the present collision data is consistent with their cross section within the error.
IV.2 Differential cross section of and production measured in decays
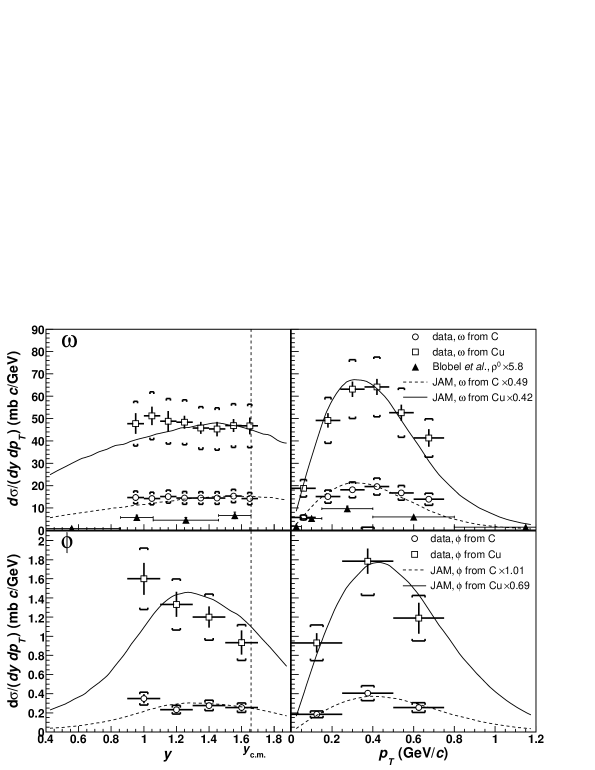
In a region and GeV/, the differential cross sections of and mesons were obtained for each or bin, as shown in Fig. 7. These are also listed in Table 6.
|
|
||||||||||||||||||||||
| 0. | 9 – | 1. | 0 | ± | 1. | 5 | 2. | 9 | ± | 4. | 6 | 10. | 0 | ± | 0. | 083 | 0. | 042 | |||||
| 1. | 0 – | 1. | 1 | ± | 1. | 2 | 2. | 8 | ± | 4. | 2 | 10. | 7 | ± | 0. | 070 | 0. | 041 | |||||
| 1. | 1 – | 1. | 2 | ± | 1. | 1 | 3. | 0 | ± | 4. | 6 | 10. | 2 | ± | 0. | 071 | 0. | 040 | |||||
| 1. | 2 – | 1. | 3 | ± | 0. | 8 | 2. | 8 | ± | 2. | 9 | 10. | 1 | ± | 0. | 049 | 0. | 039 | |||||
| 1. | 3 – | 1. | 4 | ± | 0. | 8 | 2. | 8 | ± | 2. | 7 | 9. | 6 | ± | 0. | 048 | 0. | 039 | |||||
| 1. | 4 – | 1. | 5 | ± | 0. | 7 | 2. | 8 | ± | 3. | 2 | 9. | 5 | ± | 0. | 052 | 0. | 039 | |||||
| 1. | 5 – | 1. | 6 | ± | 0. | 7 | 3. | 0 | ± | 2. | 9 | 9. | 8 | ± | 0. | 045 | 0. | 038 | |||||
| 1. | 6 – | 1. | 7 | ± | 0. | 7 | 2. | 8 | ± | 3. | 8 | 9. | 7 | ± | 0. | 056 | 0. | 039 | |||||
| 0. | 00 – | 0. | 12 | ± | 0. | 4 | 1. | 1 | ± | 1. | 2 | 3. | 9 | ± | 0. | 057 | 0. | 038 | |||||
| 0. | 12 – | 0. | 24 | ± | 0. | 7 | 3. | 0 | ± | 3. | 2 | 10. | 2 | ± | 0. | 047 | 0. | 038 | |||||
| 0. | 24 – | 0. | 36 | ± | 0. | 8 | 3. | 5 | ± | 3. | 4 | 13. | 2 | ± | 0. | 042 | 0. | 039 | |||||
| (GeV/) | 0. | 36 – | 0. | 48 | ± | 0. | 9 | 3. | 8 | ± | 3. | 6 | 13. | 4 | ± | 0. | 044 | 0. | 038 | ||||
| 0. | 48 – | 0. | 60 | ± | 1. | 3 | 3. | 3 | ± | 3. | 6 | 11. | 0 | ± | 0. | 063 | 0. | 040 | |||||
| 0. | 60 – | 0. | 75 | ± | 1. | 1 | 2. | 7 | ± | 3. | 9 | 8. | 6 | ± | 0. | 075 | 0. | 041 | |||||
| , GeV/ | ± | 0. | 34 | 2. | 79 | ± | 1. | 25 | 9. | 70 | ± | 0. | 021 | 0. | 037 | ||||||||
| from C | from Cu | ||||||||||||||||||||||
| 0. | 9 – | 1. | 1 | ± | 0. | 046 | 0. | 068 | ± | 0. | 17 | 0. | 32 | ± | 0. | 101 | 0. | 022 | |||||
| 1. | 1 – | 1. | 3 | ± | 0. | 032 | 0. | 045 | ± | 0. | 13 | 0. | 27 | ± | 0. | 101 | 0. | 020 | |||||
| 1. | 3 – | 1. | 5 | ± | 0. | 029 | 0. | 054 | ± | 0. | 11 | 0. | 24 | ± | 0. | 084 | 0. | 020 | |||||
| 1. | 5 – | 1. | 7 | ± | 0. | 037 | 0. | 050 | ± | 0. | 13 | 0. | 19 | ± | 0. | 119 | 0. | 019 | |||||
| 0. | 00 – | 0. | 25 | ± | 0. | 024 | 0. | 036 | ± | 0. | 10 | 0. | 19 | ± | 0. | 101 | 0. | 019 | |||||
| (GeV/) | 0. | 25 – | 0. | 50 | ± | 0. | 032 | 0. | 079 | ± | 0. | 13 | 0. | 36 | ± | 0. | 066 | 0. | 019 | ||||
| 0. | 50 – | 0. | 75 | ± | 0. | 032 | 0. | 050 | ± | 0. | 16 | 0. | 24 | ± | 0. | 111 | 0. | 021 | |||||
| , GeV/ | ± | 0. | 017 | 0. | 053 | ± | 0. | 070 | 0. | 258 | ± | 0. | 049 | 0. | 018 | ||||||||
The previous measurement Blobel et al. (1974) was plotted using triangles, as shown in Fig. 7. It should be noted that the data points were scaled by factors of 5.81 (= ) for clarity.
The distributions obtained by the jam calculation are compared with the measurements in Fig. 7. The total cross sections obtained from the jam calculation are larger than that obtained from the data. Hence, they are scaled by the factors 0.489 for + C , 0.421 for + Cu , 1.006 for + C , and 0.686 for + Cu . These scale factors were determined as the ratio of the total cross sections in the acceptance between the data and jam. The shapes of the differential cross sections of jam are consistent with the present data, although the absolute cross sections are systematically larger than the data.
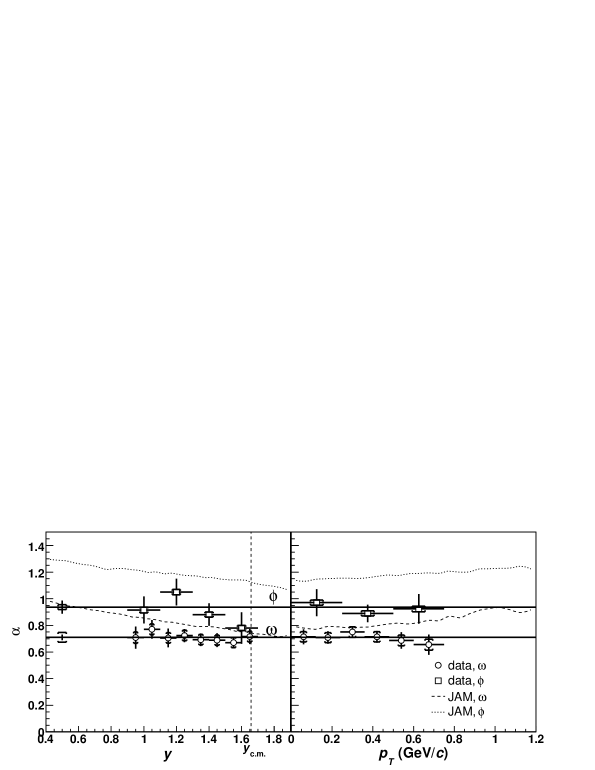
Figure 8 shows the parameters of and mesons obtained in the region of and GeV/. These are also listed in Table 6. The flat lines represent the averaged parameters with the errors shown in the left column. The dotted and dashed curves represent the results of jam for + C and + Cu collisions. Although the parameters of the jam calculation are significantly larger than those of the data, the difference between and mesons in the parameters is similar to what is seen in the jam calculation.
IV.3 Discussion
An interesting characteristic is the difference in the dependence between and meson production cross sections. While the production is essentially independent of , the production increases towards the smaller values. In addition, the parameters of and meson production are different by . This significant difference in the parameters confirms that the production mechanisms of and mesons are different.
One possible mechanism of meson production is a hard reaction between incident and projectile nucleons. If the hard reaction is dominant like production at higher energies, is expected to be around unity and independent of . Further, the distribution of the cross section is expected to be symmetric with respect to , which is not the case in the present production data.
Another possible effect to explain the observed characteristics of the parameter and cross sections is the effect of secondary collisions in a target nucleus. In this case, no hard reaction is necessary. These effects are expected to increase in a smaller rapidity region for + interaction, and the cross sections and are expected to be larger in the backward region.
Although the jam does not reproduce the data quantitatively, it yields fairly similar shapes in the inclusive cross sections of and meson productions; further, it also predicts the difference between the parameters of these mesons. In the jam calculation, more than 90% of the mesons are produced by secondary collisions mostly between non-strange mesons and nucleons in a target nucleus, while mesons are produced both in primary and secondary reactions. For example, 30% and 50% of the mesons are produced in secondary reactions in the cases of 12 GeV + C and + Cu reactions in jam, respectively. These differences in the production mechanism in jam will surely be an important step to understand the measured differential cross sections.
The difference between the scaling factors applied to meson production in + C and + Cu collisions, in jam, described in Sec. IV.2, can be understood qualitatively by the overestimated contribution of the secondary collisions in jam. Although in those calculations almost all the mesons are produced in secondary collisions, the present data suggest that the contribution of the primary collisions can be larger. For the case of the meson, jam just predicts larger absolute production yields than seen in the present data.
In summary, we measured the inclusive differential cross sections of the and meson production in + collisions in the backward region. The difference in the parameters between and mesons confirms that the production mechanisms of and mesons are different. The results are compared to the nuclear cascade calculations.
Acknowledgements.
We have greatly appreciated all of the staff members of KEK-PS, especially the beam channel group, for their helpful support. We would like to thank C. Lourenco for proof reading of the manuscript. This work was partly funded by the Japan Society for the Promotion of Science, RIKEN Special Post doctoral Researchers Program, and a Grant-in-Aid for Scientific Research from the Japan Ministry of Education, Culture, Sports, Science and Technology (MEXT). Finally, we also thank the staff members of RIKEN super combined cluster system and RIKEN-CCJ.References
- Agakishiev et al. (1998) G. Agakishiev et al., Eur. Phys. J. C 4, 231 (1998).
- Huber et al. (2003) G. M. Huber et al. (TAGX Collaboration), Phys. Rev. C 68, 065202 (2003), eprint nucl-ex/0310011.
- Suzuki et al. (2004) K. Suzuki et al., Phys. Rev. Lett. 92, 072302 (2004), eprint nucl-ex/0211023.
- Trnka et al. (2005) D. Trnka et al. (CBELSA/TAPS Collaboration), Phys. Rev. Lett. 94, 192303 (2005), eprint nucl-ex/0504010.
- Ozawa et al. (2001) K. Ozawa et al. (E325 Collaboration), Phys. Rev. Lett. 86, 5019 (2001), eprint nucl-ex/0011013.
- Naruki et al. (2006) M. Naruki et al. (E325 Collaboration), Phys. Rev. Lett. 96, 092301 (2006), eprint nucl-ex/0504016.
- Muto et al. (2005) R. Muto et al. (E325 Collaboration) (2005), eprint nucl-ex/0511019.
- Ono et al. (1979) M. Ono, J. Kishiro, S. Mikamo, A. Kusumegi, and T. Ishizuka, Phys. Lett. B 84, 515 (1979).
- Binkley et al. (1976) M. Binkley et al., Phys. Rev. Lett. 37, 571 (1976).
- Alessandro et al. (2004) B. Alessandro et al. (NA50 Collaboration), Eur. Phys. J. C 33, 31 (2004).
- Husemann (2005) U. Husemann (HERA-B Collaboration), Nucl. Phys. Proc. Suppl. 142, 104 (2005), eprint hep-ex/0408110.
- Aleev et al. (1992) A. N. Aleev et al. (BIS-2 Collaboration), Czech. J. Phys. 42, 11 (1992).
- Daum et al. (1983) C. Daum et al. (ACCMOR Collaboration), Z. Phys. C 18, 1 (1983).
- Bailey et al. (1984) R. Bailey et al., Z. Phys. C 22, 125 (1984).
- Back et al. (2004) B. B. Back et al. (E917 Collaboration), Phys. Rev. C 69, 054901 (2004), eprint nucl-ex/0304017.
- Akiba et al. (1996) Y. Akiba et al. (E-802 Collaboration), Phys. Rev. Lett. 76, 2021 (1996).
- Okubo (1963) S. Okubo, Phys. Lett. 5, 165 (1963).
- Ellis et al. (2000) J. R. Ellis, M. Karliner, D. E. Kharzeev, and M. G. Sapozhnikov, Nucl. Phys. A 673, 256 (2000), eprint hep-ph/9909235.
- von Rotz et al. (2000) S. von Rotz, M. P. Locher, and V. E. Markushin, Eur. Phys. J. A 7, 261 (2000), eprint hep-ph/9912359.
- Nakayama et al. (2001) K. Nakayama, J. Haidenbauer, and J. Speth, Phys. Rev. C 63, 015201 (2001), eprint nucl-th/0008047.
- Nara et al. (2000) Y. Nara, N. Otuka, A. Ohnishi, K. Niita, and S. Chiba, Phys. Rev. C 61, 024901 (2000), eprint nucl-th/9904059, URL http://quark.phy.bnl.gov/~ynara/jam/.
- Sugaya et al. (1996) Y. Sugaya, Y. Yamanoi, J. Chiba, Y. Kiselev, M. Numajiri, H. Ochiishi, K. H. Tanaka, K. Yasuda, and Y. Yoshimura, Nucl. Instrum. Meth. A 368, 635 (1996).
- Simkin and Trowbridge (1979) J. Simkin and C. W. Trowbridge, Rutherford Laboratory, RL-79-097 (1979), URL http://www.vectorfields.co.uk/.
- Kawabata et al. (1988) S. Kawabata, R. Sugahara, T. Tauchi, N. Ujiie, Y. Watanabe, S. Kuroda, and T. Suwada, Nucl. Instrum. Meth. A 270, 11 (1988).
- Sekimoto et al. (2004) M. Sekimoto et al. (E325 Collaboration), Nucl. Instrum. Meth. A 516, 390 (2004).
- Agostinelli et al. (2003) S. Agostinelli et al. (GEANT4 Collaboration), Nucl. Instrum. Meth. A 506, 250 (2003), URL http://wwwasd.web.cern.ch/wwwasd/geant4/geant4.html.
- Faessler et al. (2000) A. Faessler, C. Fuchs, and M. I. Krivoruchenko, Phys. Rev. C 61, 035206 (2000), eprint nucl-th/9904024.
- Hagiwara et al. (2002) K. Hagiwara et al. (Particle Data Group), Phys. Rev. D 66, 010001 (2002).
- Blobel et al. (1974) V. Blobel et al. (Bonn-Hamburg-Munich Collaboration), Phys. Lett. B 48, 73 (1974).
- Yokkaichi (2000) S. Yokkaichi, Ph.D. thesis, Department of Physics, Faculty of Science, Kyoto University (2000).
- Ishino (2000) M. Ishino, Ph.D. thesis, Department of Physics, Faculty of Science, Kyoto University (2000).