in press in Int. J. Mass Spec.
The WITCH experiment: completion of a set-up to investigate the
structure of weak interactions with a Penning trap.
Abstract
The WITCH experiment aims to study a possible admixture of a scalar or tensor type interaction in -decay by determining the angular correlation from the shape of the recoil energy spectrum. The installation period was completed and intensive commissioning of the set-up was performed already. The lay-out of the WITCH set-up and results of commissioning tests performed until now are described here, showing that the full set-up up to the spectrometer is now operational, although several efficiencies are still to be improved. Due to its feature of being able to measure the energy spectrum for recoil ions, the WITCH experiment also opens possibilities for other
observables.
Key words: weak interaction, beta decay, scalar
interaction, Penning trap, retardation spectrometer
1 Introduction
Despite the fact that the -decay process was discovered already at the end of the 19th century, our understanding of weak interactions has developed only gradually. The Standard Model of the electroweak interaction is very successful in describing existing experimental data both qualitatively and quantitatively, but a number of parameters have to be determined experimentally and several important properties of the interaction are not well understood. The most general interaction Hamiltonian for nuclear -decay which includes all possible interaction types consistent with Lorentz-invariance is given by [1, 2]
| (1) | |||||
The coefficients and , are the coupling constants for Scalar (S), Vector (V), Tensor (T), Axial-Vector (A) and Pseudoscalar (P) contributions. In the Standard Model of the weak interaction only V and A interactions are present at a fundamental level, which leads to the well-known structure of the weak interaction. However, this assumption is based on experimental results only and the presence of scalar and tensor types of weak interaction is today ruled out only to the level of about 8% of the V- and A-interactions [3].
A possible admixture of a scalar or tensor type weak interaction in -decay can be studied by determining the angular correlation. This angular correlation for unpolarized nuclei can be written as [4]:
| (2) |
where is the angle between the particle and the neutrino, E, and m are the total energy, the velocity relative to the speed of light and the rest mass of the particle, with the fine-structure constant and the nuclear charge of the daughter nucleus, b is the Fierz interference term which has experimentally been shown to be small (e.g. at 90% C.L. [5]) and can as a first approximation be assumed to be zero, and a is the angular correlation coefficient. Since the S- and V-interactions lead to Fermi transitions (F) and the A- and T-interactions to Gamow-Teller transitions (GT), the angular correlation coefficient a can be approximated as (assuming maximal parity violation for the V- and A-interactions and real couplings)
| (3) |
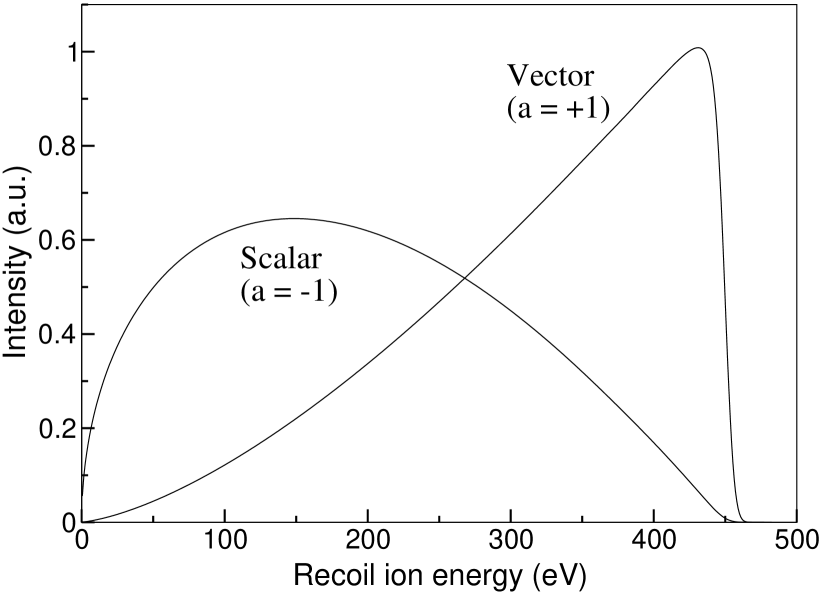
In the Standard Model, i.e. in the absence of S- and T-type interactions, and . Any admixture of S to V (T to A) interaction in such a pure Fermi (Gamow-Teller) decay would result in (). A measurement of a therefore yields information about the interactions involved. However, the neutrino cannot be detected directly and the angular correlation thus has to be inferred from other observables. From the properties of the general Hamiltonian of the weak interaction (Eq.(1) and [6]) and of the Dirac -matrices it can be shown that the two leptons in -decay will be emitted preferably into the same direction for a V (T) interaction and into opposite directions for an S (A) interaction. This will lead to a relatively large energy of the recoil ion for a V (T) interaction and a relatively small recoil energy for an S (A) interaction (Fig. 1). The WITCH experiment aims to measure the shape of the recoil energy spectrum with high precision to determine the angular correlation parameter a and from this deduce a limit on a possible scalar or tensor admixture in weak interactions.
Due to its feature of being able to measure the recoil ion energy spectrum in nuclear -decay, the WITCH experiment also provides interesting possibilities for other observables, e.g. one can also determine F/GT mixing ratios, -values, branching ratios and charge state distributions [12], [27]. In addition, the ion cloud in the decay Penning trap can also be used for and spectroscopy, this time not using the recoil spectrometer but with and detectors added to the WITCH set-up. For example, a detector on the axis of the decay trap at some distance behind the trap opens the possibility for spectroscopy with a pure sample without any scattering of the particles in the source. Adding detectors around the center electrode of the trap will make also spectroscopy possible.
2 Experiment
2.1 Principle
An experiment to measure the recoil energy spectrum in nuclear -decay faces two major difficulties: (1) the -emitter is usually embedded in matter, which causes a distortion of the recoil ion spectrum due to energy losses caused by ion scattering in the source, and (2) the recoil ions have very low kinetic energy rendering a precise energy measurement difficult.
In order to avoid the first problem and to be as independent as possible from the properties of the isotopes to be used, the WITCH experiment uses a double Penning trap [7] structure to store radioactive ions. The ion cloud in the second trap, the decay trap, constitutes the source for the experiment, where the ions are kept for several half-lives, i.e. of the order of 1 to 10 s for the cases of interest [8].
To solve the second problem and measure the recoil energy spectrum a retardation spectrometer is used. The working principle of such a device is similar to the -spectrometers used for the determination of the neutrino rest-mass in Mainz [9] and Troitsk [10]. The WITCH spectrometer consists of two magnets: the first one providing a field T, the second one providing T, and an electrostatic retardation system. Recoil ions are created in the strong magnetic field region (i.e. in the Penning trap) and pass on their way to the detector the region with low magnetic field (i.e. the retardation section of the spectrometer). Provided that the fields change sufficiently slow along the path of the ions, their motion can be considered as adiabatic. According to the principle of adiabatic invariance of the magnetic flux [11] , where is the momentum projection perpendicular to the magnetic field . From this it follows that the radial kinetic energies of an ion in the trap () and in the retardation section () are related as . Thus a fraction
| (4) |
of the energy of the ion motion perpendicular to the magnetic field lines will be converted into energy of the ion motion along the magnetic field lines. The total kinetic energy of the recoil ions can be probed in the homogeneous region of low magnetic field by retarding them with a well-defined electrostatic potential. By counting how many ions pass the analysis plane for different retardation voltages, the cumulative recoil energy spectrum can be measured [8, 12].
2.2 Overview of the set-up
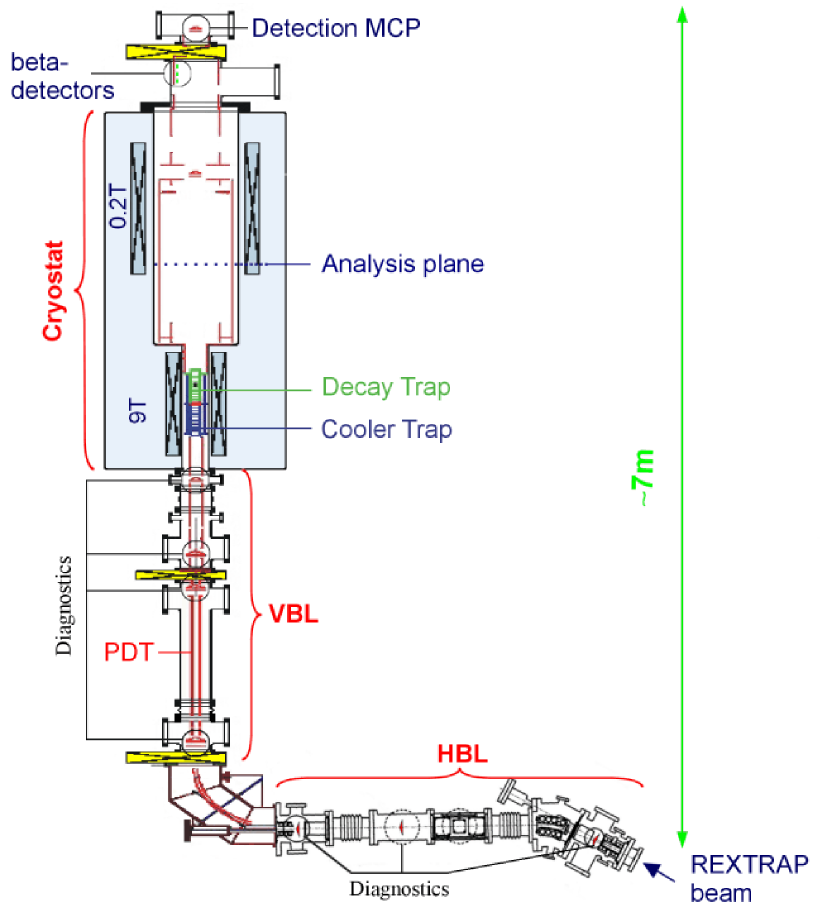
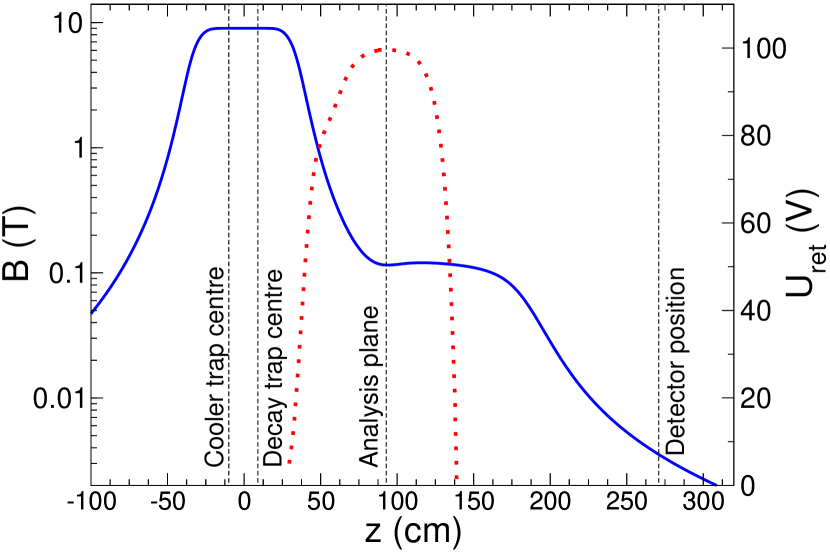
The general scheme of the set-up can be seen in Fig. 2. The installation at the ISOLDE facility at CERN was recently completed. In a first step the ions produced by ISOLDE [14, 15, 16] get trapped and cooled by REXTRAP [17]. As soon as a sufficient amount of ions (viz. to ions) has been collected by REXTRAP they are ejected as a 60 keV (optionally 30 keV) bunch and are transmitted through the horizontal beamline (HBL) of WITCH into the vertical beamline (VBL). There the ions are electrostatically decelerated from 60 keV to 80 eV in several steps. In order to avoid a high voltage platform a pulsed cavity is used [18] (named Pulsed Drift Tube, PDT, in the case of WITCH [28]). When the ion bunch is inside the PDT the potential of the cavity is switched down over the range of 60 kV (30 kV) from 52 kV (26 kV) down to -8 kV (-4 kV). In this way the kinetic energy of the ions is not changed while the potential energy is shifted to -8 kV (-4 kV), so that the total energy becomes nearly zero (80 eV in practice). The ions can then be captured in the cooler trap (the first Penning trap of the WITCH set-up), which is at ground potential. In this cooler trap the ion cloud is prepared (i.e. cooled and centered) before being ejected through the pumping diaphragm (which separates the vacua of the two traps) into the second Penning trap, the decay trap. The latter is placed at the entrance of the retardation spectrometer. After -decay the recoil ions emitted into the direction of the spectrometer spiral from the trap, which is in the strong magnetic field, into the weak field region. In the homogeneous low-field region the kinetic energy of the ions is then probed by the retardation potential (Fig. 3). The ions that pass this analysis region are re-accelerated to 10 keV to get off the magnetic field lines. The re-acceleration also ensures a constant detection efficiency for all recoil ion energies. Finally, the ions are focused with an Einzel lens onto the detection micro-channel plate (MCP) detector. For normalization purposes several -detectors are installed in the spectrometer section too (also to check the -simulations, see Sec. 2.6) [8, 12]. The recoil spectrum can be measured setting one retardation step for one trap load (in this case a normalization, e.g. by counting the -particles, is necessary) or scanning all retardation steps during the same trap load (in which case a correction for the time-dependence of the count rate due to the isotope half-life has to be performed). The latter case also allows to avoid a possible effect of the MCP degradation on the shape of the recoil spectrum.
2.3 Response function
Since the WITCH experiment measures the recoil energy spectrum, good knowledge of the spectrometer response function is of high importance. The response function has been investigated both analytically as well as with numerical calculations of the ion trajectories through the spectrometer [19]. Two important issues regarding this response function are discussed below.
2.3.1 Influence of the residual gas
The residual pressure in the spectrometer section (and also in the decay trap) should be as low as possible. Indeed, in order to measure precisely the recoil spectrum it is very important to avoid scattering of the recoil ions. The residual gas can also cause another problem for the experiment, namely charge exchange which leads to neutralization of the ions such that they can not be probed anymore by the retardation principle.
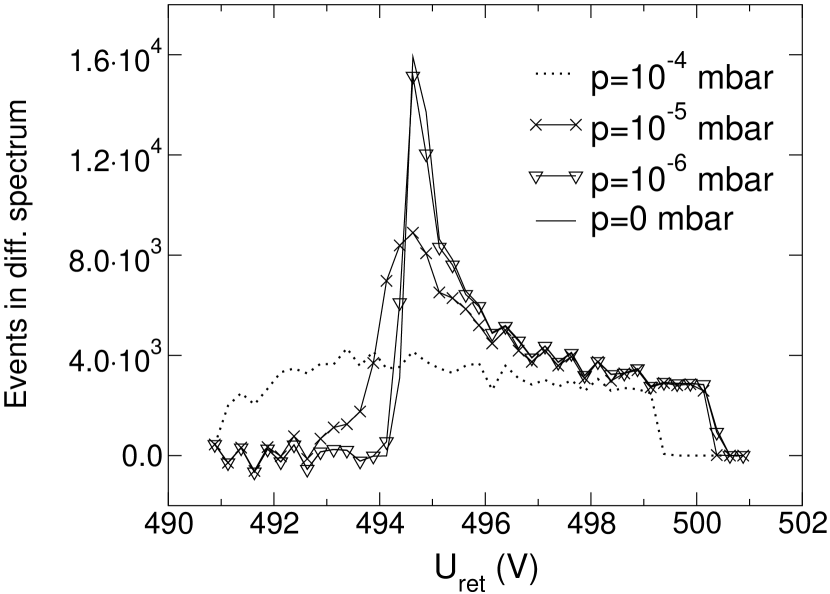
The influence of ion scattering was investigated via simulations of the ion trajectories, taking into account a Stokes force to describe the damping of the ion motion. The results are presented in Fig. 4. These simulations were performed for argon gas in both traps and in the spectrometer. The same pressure is used everywhere. For helium gas the indicated pressures have to be multiplied by a factor of . One can see that with increasing rest gas pressure the response function broadens. It can also be noted that for a pressure better then mbar the energy distribution deviates only a little bit from the ideal case mbar, meaning that for a successful recoil spectrum measurement the residual gas pressure has to be mbar in the decay trap and in the spectrometer. Up to now no estimates were made for the effect of charge exchange on the WITCH response function.
2.3.2 Doppler broadening
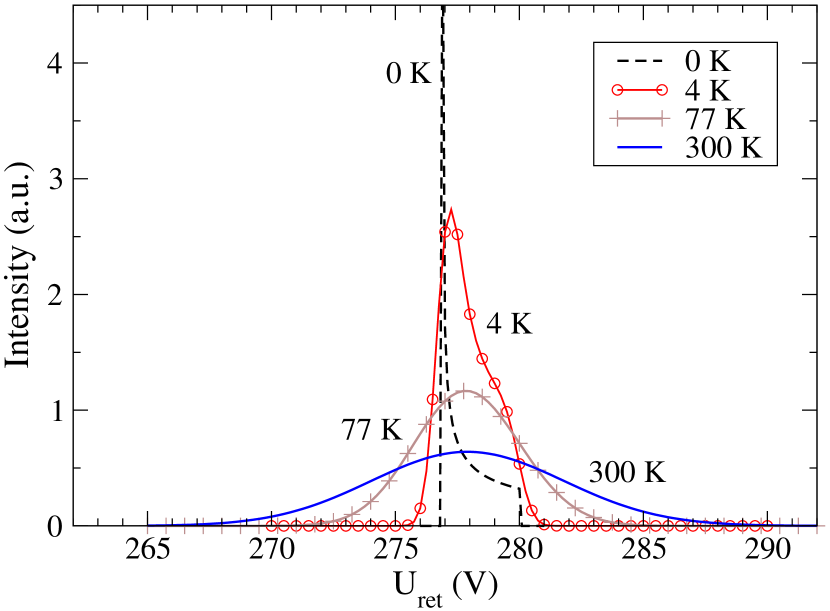
The ideal response function was derived assuming that the ions are at rest. The real situation, however, differs since the ion cloud in the decay trap is at least at room temperature. The velocity of the recoil ion is thus the superposition of the velocity of the mother nucleus in the trap and the velocity obtained due to the beta decay. This definitely affects the recoil spectrum. Assuming a Maxwellian ion velocity distribution and taking into account that the energy at room temperature (0.025 eV) is much smaller than the recoil energy O(100 eV), it can be shown [20] that the energy shift due to Doppler broadening results in the Gaussian distribution:
| (5) |
with
| (6) |
where is the recoil ion energy obtained in the beta decay, k is the Boltzmann constant and T is the ion cloud temperature. Eq.(6) yields, for e.g. eV and K, eV. This means that the mono-energetic response function broadens significantly if the ion cloud is at room temperature. To get the real response function for the WITCH spectrometer one has to fold the ideal mono-energetic response function with this broadened energy distribution. Fig. 5 shows the WITCH response function thus obtained for different ion cloud temperatures. As one can see, down to liquid nitrogen temperature (i.e. 77 K) the shape of the response function is defined by Doppler broadening and only at the temperature of liquid helium (i.e. 4 K) it approaches the shape of the ideal response function. It would thus be interesting to consider to cool (at least to 77 K) both Penning traps.
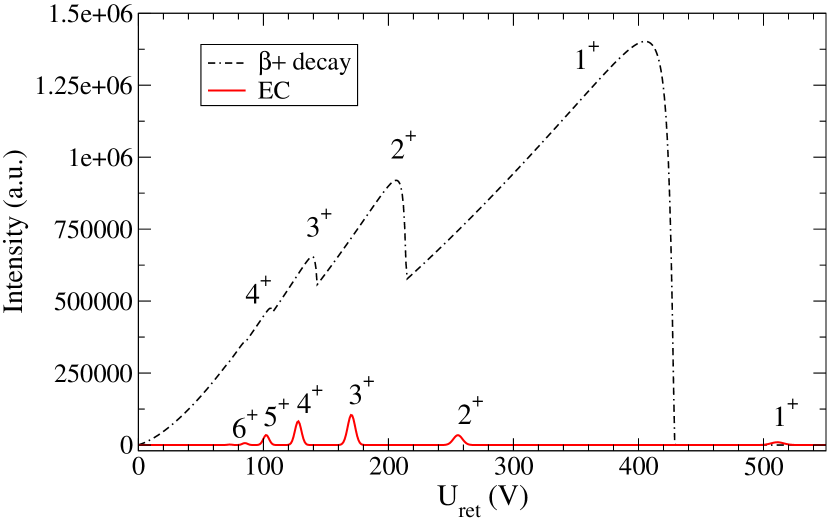
The response function can be determined experimentally by measuring recoil ions from electron capture decay (EC), which leads to a mono-energetic peak that is, if it accompanies decay, above the endpoint energy of the continuous recoil spectrum from decay (Fig. 6, see Sec. 2.4). By measuring these EC peaks for several suitable nuclides with different decay energies, an energy calibration of the spectrometer can be performed as well.
2.4 Recoil spectrum
Electron shake-off after the -decay [22] will cause the daughter ions to have different charge states . The recoil ions with energy and charge q will appear in the measured spectrum at a retardation voltage due to the retardation principle. The measured spectrum will thus be a superposition of the spectra of the various charge states, each with different endpoints , , where is the endpoint energy of the recoil energy spectrum for n = 1 (Fig. 6). Consequently, when measuring the full recoil spectrum up to the endpoint energy , the upper half of the spectrum will consist purely of events from charge state n = 1. This upper half of the recoil spectrum is therefore the most interesting part for analyzing the spectrum shape [12]. Note that the EC peaks of different charge states n for the same nuclide will also appear in the spectrum at different energies , .
It is also planned to check the dependence of the shake-off probability on the recoil ion energy, as has been seen in 6He decay [13]. This dependence is expected to be even larger in decay [24]. This effect to first order distorts the recoil ion spectrum by . The idea is to use the upper half of the 1+ charge state spectrum to fit simultaneously and correlation coefficient . A possible dependence of the shake-off process on the recoil energy can be checked by fitting spectra obtained for different charge states to (not including the parameter).
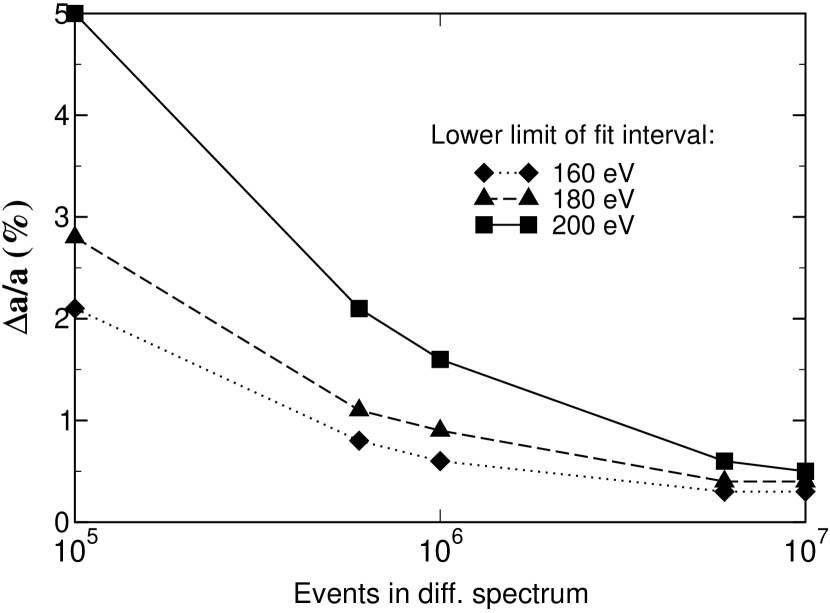
2.5 Achievable precision
A series of random integral recoil spectra have been generated from which the angular correlation parameter a was fitted. The response function of the spectrometer was approximated by Gaussian with 1%. No background and no dependence of the shake-off on the recoil ion energy were considered. By changing the fit interval and the bin width the influence on the achievable precision for a was studied. These simulations (Fig. 7) show that, to reach a precision of , the total number of events in the differential energy spectrum should be and a minimum of channels (i.e. retardation steps) in the upper half of the spectrum seems to be sufficient. Taking , , the number of ions in one trap load and the efficiency parameters for a fully optimized set-up (Table 1), one can find that the measurement time needed to reach a precision of (Fig. 7) is days for 35Ar ( s) and days for Al ( s) [8]. In fact, the results of the simulations presented in Fig. 7 show that the required precision of might be achieved already with which means that the measurement time reduces correspondingly, i.e. hours for 35Ar and days for Al.
2.6 GEANT4 -particle simulations
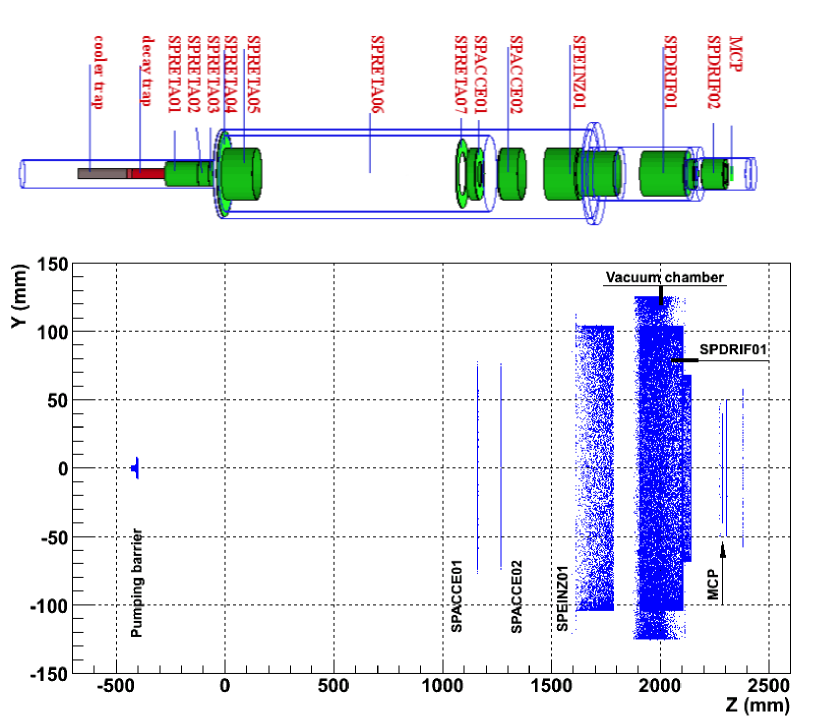
As was already mentioned in Sec. 2.2 normalization detectors (to count -particles) are available in the set-up too. Simulations with the GEANT4 simulation package [25, 26] were performed to find the best suited place for installing these detectors in order to provide good statistics for the normalization. The scheme of the simulated set-up is presented in Fig. 8 (top). The double Penning trap structure is described as a set of two solid copper cylinders (inner diameter 40 mm) separated by a copper pumping diaphragm with an opening of 4 mm diameter. All spectrometer electrodes as well the walls of the lower and upper magnet bore tubes are made from stainless steel. For the MCP detector a very simplified model is used, i.e. a solid disk of quartz material (), 80 mm in diameter and 1 mm thick.
The program was run for the case of 35Ar, with an isotropic -particle emission distribution and a 5 mm radius ion cloud in the center of the decay trap. The positions and elements of the set-up which are hit first by the -particles after they leave the decay trap were determined. This is shown in Fig. 8. One can recognize the shape of certain electrodes and also the pumping diaphragm (at nearly -400 mm). The largest number of hits is in the pumping barrier: nearly 80% of the betas going in this direction hit the barrier. The second most hit element is the SPDRIF01 electrode. Taking into account that the size of the pumping barrier is much smaller than the size of the SPDRIF01 electrode, one can conclude that the pumping barrier is the most suitable place to install the -detectors.
Another important result of these simulations is the estimate for the -background on the recoil ion detector. This MCP detector is introduced in the program as a very primitive model. Nevertheless, this allows to check how many particles will arrive on the detector. It appears that this amount is actually rather large: from a total of 250 000 simulated events 8608 betas arrive on the 8 cm diameter MCP detector. This number has to be compared to the number of ions arriving on the same detector. Considering the efficiencies for an ideal set-up (Table 1) it can be estimated that about 10 000 ions will arrive on the MCP detector. However, it might be that an MCP of 4 cm diameter is already sufficient for detecting all ions. Since the -background events equally cover the surface of the MCP, a two times smaller diameter of the detector means a reduction of the -background by a factor of 4, corresponding to 2152 beta-particle events. This estimate of the -background is not yet complete however, as one still has to take into account the different detection efficiency of the MCP for ions of O(10 keV) energy (the recoil ions are accelerated onto the MCP, see Sec. 2.2) and -particles of O(MeV) energy. The model used for the MCP detector is too primitive to answer this question. Measurements performed by the TRIUMF and Berkeley groups [43, 44] showed that this efficiency is actually very close to the one for ions (i.e. the absolute MCP detection efficiency is about 5075% for -particles of O(MeV) energy, compared to about 60% for ions). This means that if one assumes the MCP registration efficiency for betas and ions to be both 60%, the MCP detector will register 1290 particles against 6 000 ion events in the full recoil ion spectrum.
The first estimates [27] show that in order to achieve with such background an increase of the measurement time by about one order of magnitude might be necessary. However, if one considers that counts in the differential spectrum (not including background) is sufficient (Fig. 7, Sec. 2.5), the required precision on the correlation () might still be achieved in a realistic time period. These simulations, for sure, have to be checked experimentally and the issue of the MCP detection efficiency for ions and betas still has to be investigated in more detail too.
3 Tests performed
The WITCH set-up was completed only recently and commissioning was started already during the last phase of the installation. In most of the tests the off-line REXTRAP ion source (delivering a 39K ion beam) was used. The tests performed are discussed in this section.
3.1 HBL
The function of the HBL is to transfer the ion beam from the REXTRAP set-up into the WITCH vertical beamline as efficient as possible. Since the ISOLDE facility (and respectively, REXTRAP) is operated usually at either 60 kV or 30 kV, tests were done using both high voltage settings. The tests performed showed that the tuning can be done in such a way that there is no significant loss of beam intensity through the HBL, i.e. nearly 100% transmission efficiency is obtained. To tune the voltages and monitor the beam, the three diagnostics in the HBL and the first one in the VBL are used.
3.2 VBL
The main purpose of the VBL tests that were performed till now was to prove the functionality of the PDT, check its efficiency and investigate and optimize the injection of the ion beam into the WITCH magnetic field.
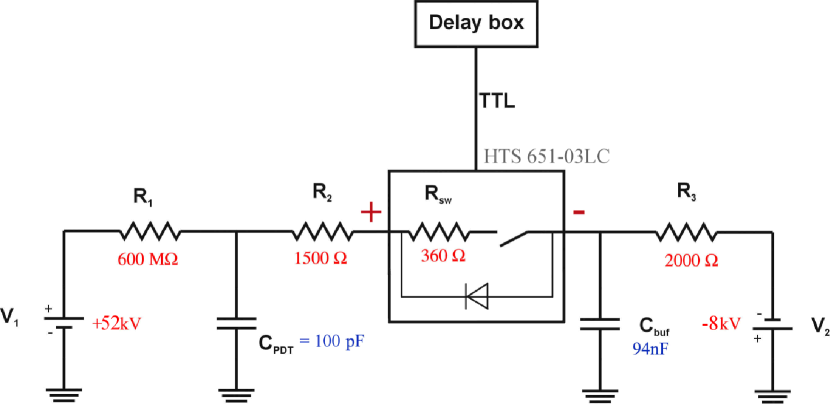
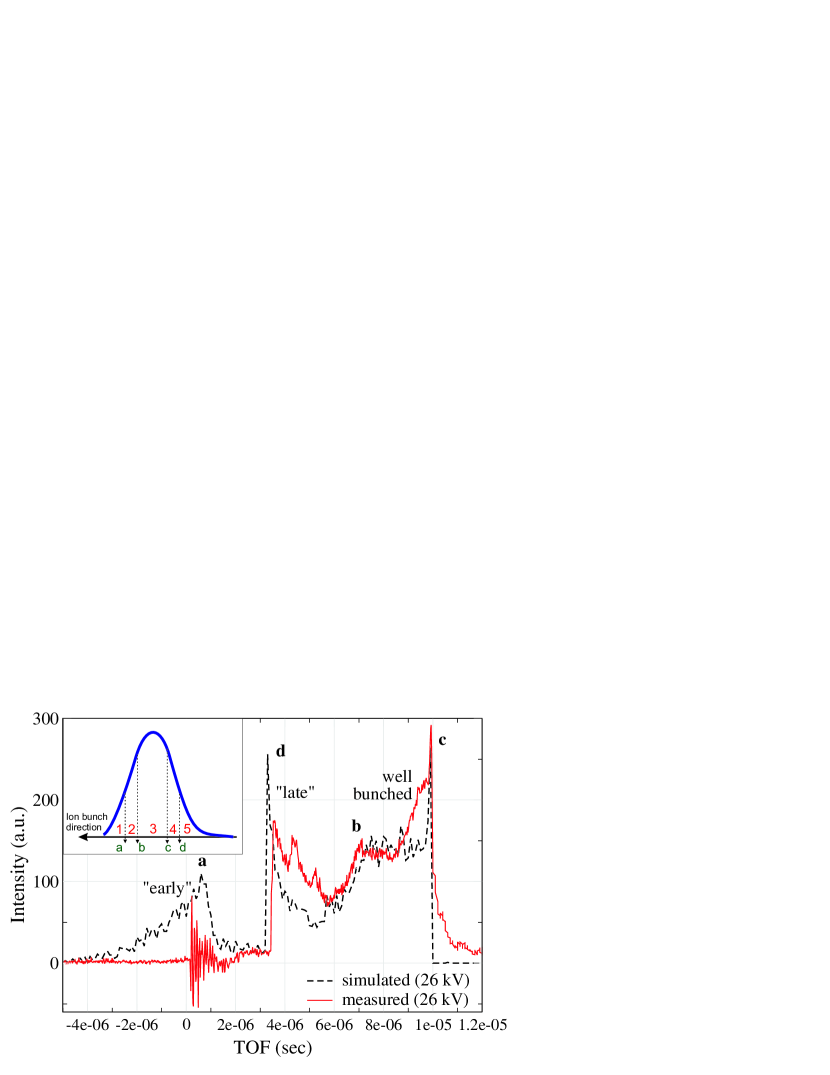
From the values for the resistances and capacitances in the HV switch box scheme (Fig. 9) the HV switching time constant was estimated to be 0.18. This provides a pulse down time of the PDT of about for a 60 kV (30 kV) ISOLDE beam, with being defined such that the energy of the ions after the switching differs less than 50 eV from the required value [28]. The travel time of 30 keV 39K+ ions in the PDT (for a combination of HV = +26/-4 kV) is . This gives an time window to pulse down the ion beam. However, the ion bunch ejected from the REXTRAP set-up has a time structure that is longer than this time window (the typical bunch length is ), meaning that it is not possible to pulse the complete bunch but at best only about 43% of it for a combination of HV = +26/-4 kV [28]. The original bunch can thus be considered to consist of different parts: 1) ions which will pass through the PDT before the pulsing down starts, 2) an intermediate part containing partially bunched ions, 3) well bunched ions, 4) another intermediate part of partially pulsed down ions and, finally, 5) ions which enter the PDT when this is already at low voltage (Fig. 10, top left corner). For the cases 1) and 5) these ions will have keV (30 keV) after the PDT, i.e. they are much faster than the well-bunched ions. This leads to the time structure of the signal after the PDT shown also in Fig. 10. In this figure the simulated (using the SIMION simulation routine [29]) and measured spectra are compared. As can be seen, good agreement between simulations and the measurement is obtained.
The efficiency of the PDT, , was measured using two diagnostic MCP detectors: one in front of the PDT and one behind it at 40 cm from the exit of the PDT. The resulting efficiency is less than the expected value of 43% but is of the right order of magnitude [28].
From the signal of the MCP detector behind the trap structure (i.e. in the magnetic field) the overall efficiency of the vertical beamline, including the efficiency of the pulsed drift tube, was found to be between 0.1% and 1% (for these measurements ions were not trapped but only sent through the traps) (Table 1). Additional measurements were performed in the mean time with improved MCP diagnostic detectors [39], i.e. with several Ni meshes in front to reduce the incoming beam intensity, and a grid-anode to determine the beam size. These have revealed a significant decrease of beam quality after the PDT. This is being looked into in more detail now.
3.3 Traps
In the initial phase, i.e. for a simple mode WITCH operation and tests of the spectrometer, a sophisticated use of the traps is not required. It was therefore not our aim to perform already now a detailed investigation of their properties. Rather we wanted to verify the simple operation of the traps, i.e. try out basic trap mechanisms, understand the behavior of ions in the traps and, if possible, optimize the parameters in order to find a suitable trapping regime.
3.3.1 Buffer gas cooling
An important step in verifying the operation of Penning traps is to check the buffer gas cooling procedure since this is usually a first main step in the ion cooling. The buffer gas used is high purity 4He (quality: Helium 57 or >99.9997%), but the transfer line is not yet equipped with a cold trap or other purification system. The buffer gas pressure measurement is done at a point after the gas dosing valve (Pfeiffer Vacuum, RME005) and before the transfer line enters into the vacuum chamber. With this installation the buffer gas pressure is regulated via a feedback loop.
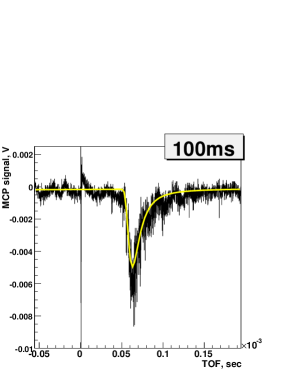
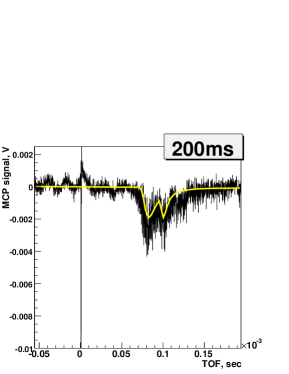
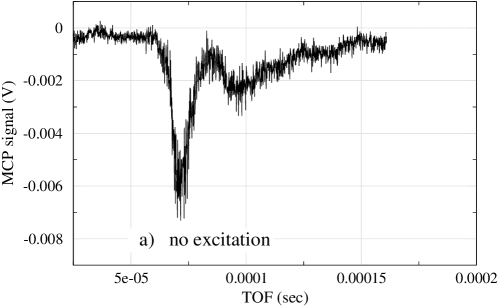
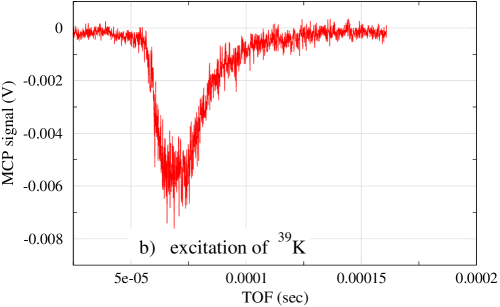
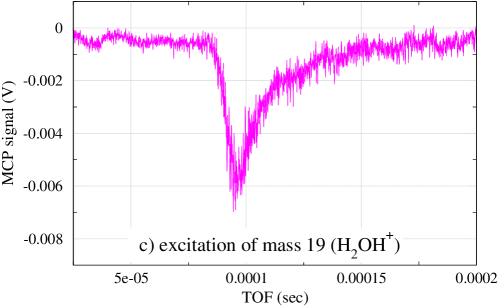
A scan of the MCP signal as a function of the cooling time was performed for a buffer gas pressure of 5 mbar at the gas dosing valve position. 39K+ ions are trapped in the cooler trap, cooled there for some time and then sent (without capturing) through the decay trap onto the MCP detector behind the WITCH trap structure. It was found that after 200 ms of cooling the MCP signal splits in two different peaks (Fig. 11). This means that other ions then 39K+ are present too, for instance because the buffer gas is not clean enough. Using dipole excitation of the reduced cyclotron motion (), the first peak was identified as mass 19 (H2OH+) while the second one corresponds to 39K+. Qualitatively the effect of the cooling can be seen in Fig. 11: after 100 ms of cooling the TOF position of the 39K+ peak is while after 200 ms of cooling the peak appears at .
3.3.2 Excitations
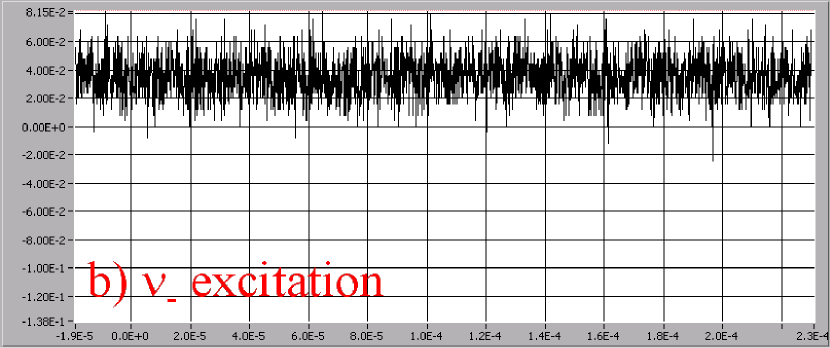
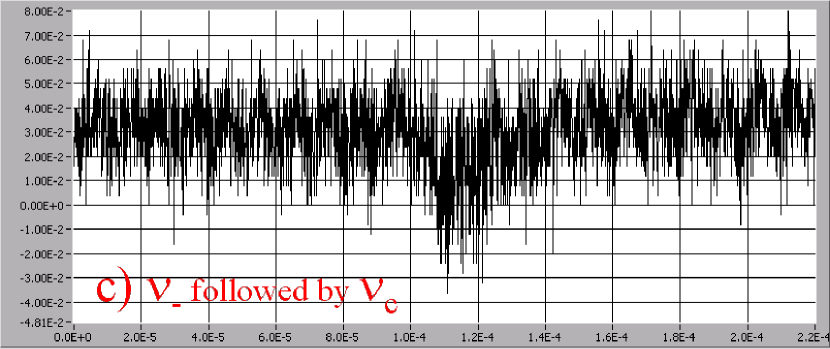
In Fig. 12 the oscilloscope pictures corresponding to the dipole excitation are shown. With no applied excitation two peaks (H2OH+ and 39K+) are visible. Next, the following scheme is used: first the ions are cooled by collisions with the buffer gas atoms in the cooler trap during 200 ms, thereafter they are excited at Hz (in a 6 T B-field) for 100 ms with an amplitude of V and, finally, they are extracted (Fig. 12b). As can be seen the 39K+ peak disappears, i.e. with excitation the 39K+ ions were brought to a radius larger than the radius of the pumping diaphragm. In another test the ions in the first peak were excited at the reduced cyclotron frequency (mass 19) ( V) during 100 ms (in this case the ions were first cooled during 400 ms) (Fig. 12c). The same effect is obtained, i.e. the corresponding peak disappears. The increase of the MCP signal after removing the first peak could be related to MCP effects (see Sec. 3.5). No systematic scan of the number of ions ejected from the trap as a function of the excitation frequency was performed as yet, but only a qualitative study of the TOF oscilloscope spectrum. These tests nevertheless show that the excitation works for WITCH and allows to separate different masses.
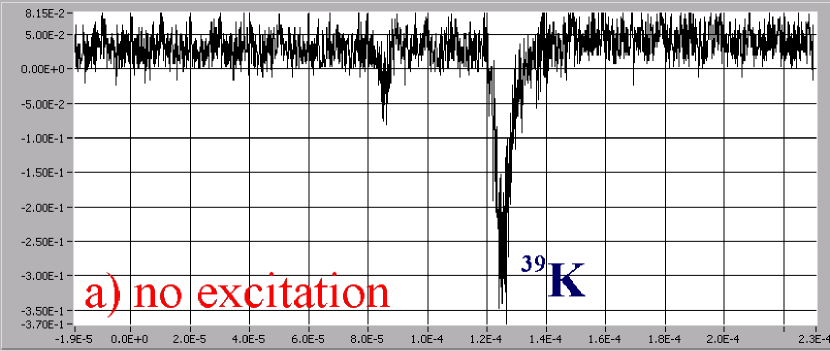
A mass selective removal of unwanted species can be achieved via a combination of dipole excitation of the magnetron motion () and quadrupole excitation at the true cyclotron frequency () [30]. This technique was tried qualitatively for 39K+ ions. A dipole excitation (at Hz, determined in a similar way as , i.e. checking at which frequency all ion peaks disappear from the oscilloscope spectrum) with amplitude mV was applied for 50 ms, and followed by a quadrupole excitation ( Hz) with amplitude V for 3 ms (B-field is 9 T). As in the previous tests no systematic scan of the excitation frequencies was performed but only a visual analysis of the TOF oscilloscope spectrum. The corresponding steps of the process are shown in Fig. 13. Fig. 13a displays the situation before any excitation. The second peak corresponds to 39K+. When a dipole excitation is applied, all ions are driven out as can be seen in Fig. 13b (both peaks disappear). If now a quadrupole RF-field at frequency is used, one can expect the 39K+ ions to recenter while other impurities should disappear. However, while it is clear from Fig. 13c that there is indeed no other species present than 39K+, the signal corresponding to the 39K+ ions is significantly smaller and broader than the one without any excitation. A possible reason for this can be either wrongly chosen parameters (so that the ions hit the electrode and are lost) or some electronics problem (e.g. electronic noise in some channels, a different capacitance of the track: connection wires + electrodes, or imperfection of power supplies used). Also, the behaviour of the ions might have been influenced by space charge effects.
The dipole excitation was also applied while working with 20Ne+ ions and the frequency used there was Hz (to successfully remove all species; B-field was 9 T). Combining this value with the one in the 39K test leads to Hz. Using now this value of and an estimation of the magnetic field in the cooler trap center (see next Sec. 3.4), one can deduce the trap characteristic parameter V/ for WITCH. For the ISOLTRAP [31, 32, 33] cooler trap, which is very similar to the WITCH cooler trap, one has V/ [34].
3.4 Magnetic field
The necessity to know precisely the magnetic field at the trap center is based on the following two factors: 1) the cyclotron frequency, and therefore the centering and cooling of the ion cloud as well as the mass-selectivity, are directly determined by the value of the field, while 2) the response function of the WITCH spectrometer also depends on it. Originally the magnetic field map was provided by Oxford Instruments for both magnets separately. However, this field map resulted from a calculation/approximation based on measurements that were made at the factory, prior to the delivery and installation of the system at CERN. Also, inserting the traps structure with all the wiring may change the field strength in the trap centers due to the magnetic susceptibility of the materials used. Direct measurement of the field with an NMR probe is hardly possible because of the very difficult access to the area.
An elegant way to estimate the magnetic field is to use a known isotope (i.e. with known mass ) and experimentally find the proper cyclotron frequency . This yields enough information to determine the magnetic field [35]. From the excitation tests performed with a 39K+ beam, was found via quadrupole excitation of 39K+ (direct determination, Hz) but also via dipole excitation of 39K+ (which gives only Hz; in another test Hz was found, see p.3.3.2). The estimated uncertainty for and is based on two measurements of at 6 T field: Hz and Hz (Fig.12), which leads to Hz. The final result for is Hz, which corresponds to a magnetic field in the center of the cooler trap T (according to the field map from Oxford Instruments the field in the center of the cooler trap is ). The set field was 9 T for the lower magnet and 0.1 T for the top magnet of the system (the WITCH magnet system allows to set any possible combination of the magnetic fields in the range T and T).
3.5 MCP regime
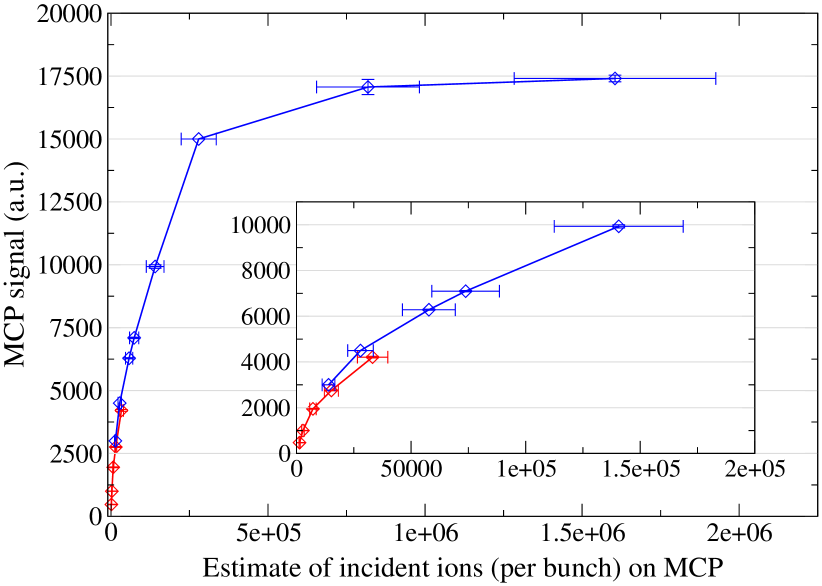
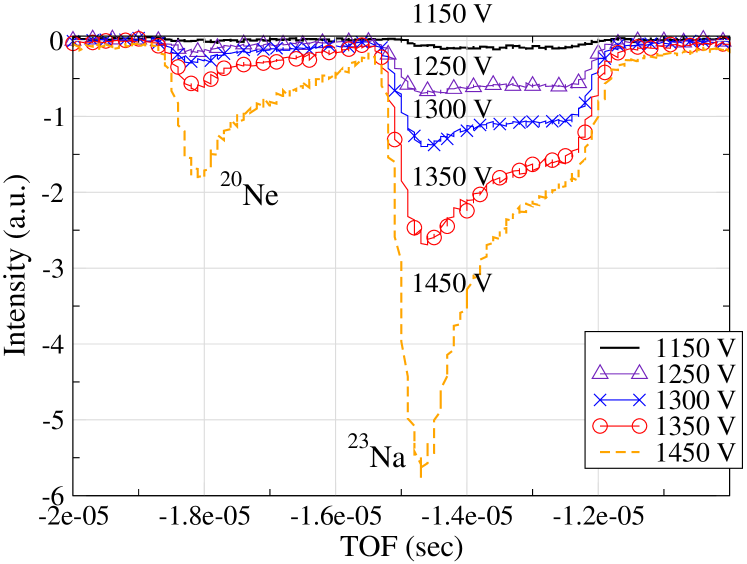
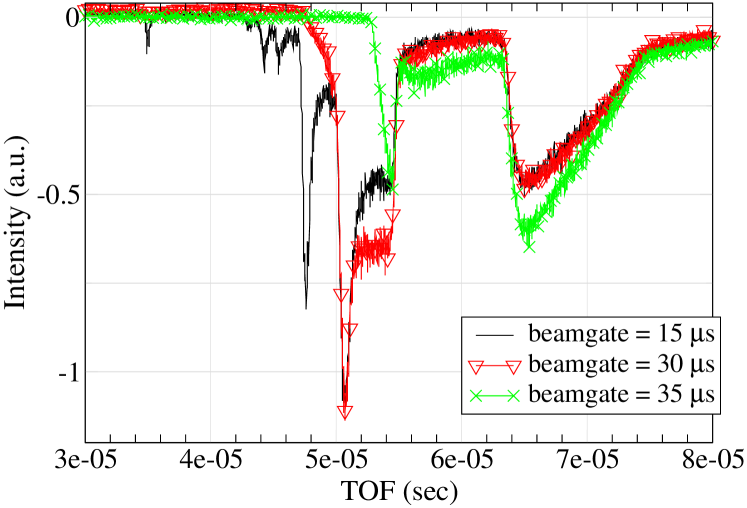
The working principle of an MCP detector can be found in e.g. [36, 37, 38]. Under certain conditions an MCP is not sensitive anymore to the number of incident particles (Fig. 14), meaning that the detector misses some events. This state is known as the saturation of the MCP. The typical dead-time of one MCP channel is in the order of several tens of milliseconds [36]. For the WITCH diagnostic MCPs it is 30 ms. The saturation of an MCP depends on both the ion current density (i.e. the number of ions per MCP channel and per second) and the MCP acceleration voltage. The effect of the ion current density is shown in Fig.14: when the number of ions in the bunch exceeds a certain value the MCP signal remains constant. However, already much earlier the dependence of the MCP signal on the number of incident ions ceases to be linear. This behavior can be explained by partial saturation: Fig. 15 shows that at MCP HV=1.25 kV the 23Na+ signal has a block shape while at higher MCP voltages the total signal still increases but shows a significant drop in intensity for later arriving ions. This means that the early arriving ions saturate a certain fraction of the MCP channels, leading to a decrease of the MCP registration efficiency for later ions. This can also be seen from Fig. 16: when the early arriving ions are removed with a time window before they reach the detector (the WITCH beam gate is used for this), the signal corresponding to the late ions increases.
The effect described above influences the measurements and has to be taken into account for efficiency estimates and during the beam tuning. Saturation of the diagnostic MCP’s can be avoided by adding several Ni meshes in front and using appropriate MCP acceleration voltages. The dead-time and saturation of the MCP can also influence the recoil spectrum measurement, since in real measurement conditions the recoil ions are supposed to reach the recoil MCP detector at a rate Hz. Results of a careful study of the MCP response to high intensity pulsed beams are described in [39].
3.6 First radioactive ions
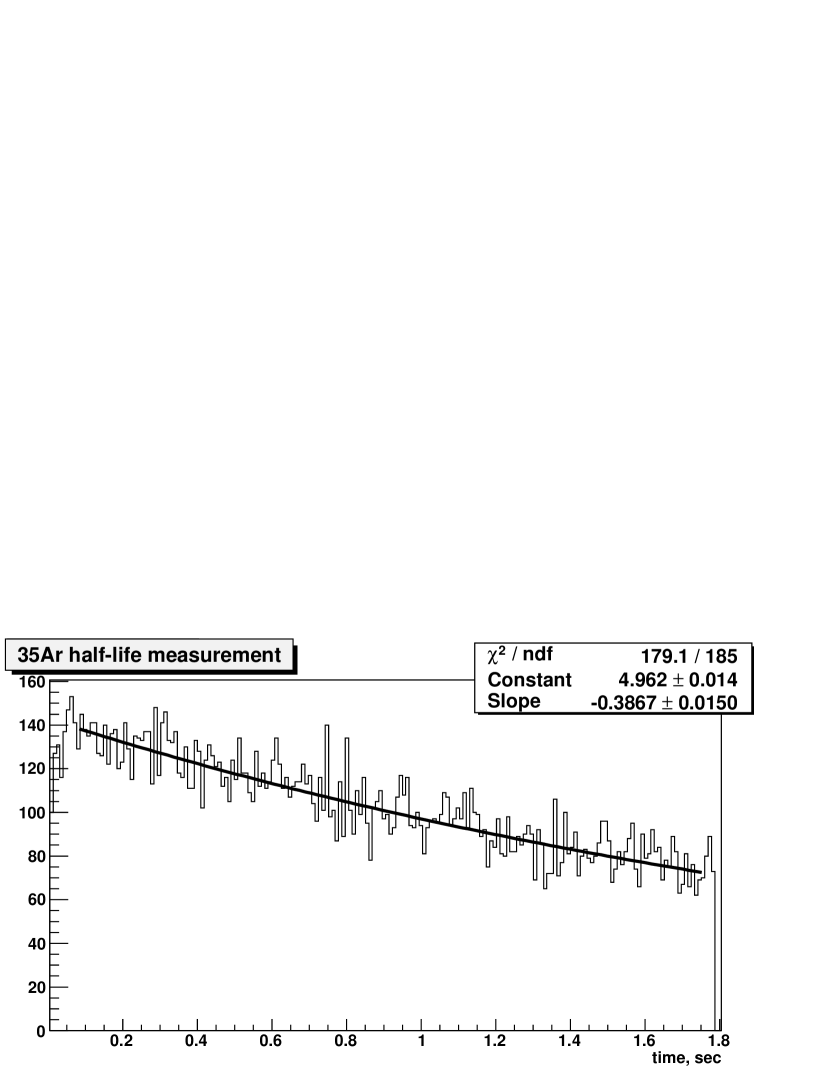
In November 2004 WITCH got its first radioactive beam time (with 35Ar+). A CaO ISOLDE target and a plasma ion source with cold transfer line were used. The rate for this particular run was about , being somewhat lower then expected. Coupled with the fact that the efficiency of WITCH is not yet high enough to deal with this intensity (see Table 1) a recoil energy spectrum measurement was not yet possible. Increase of ISOLDE rates of 40 times can be expected based on past demonstrated yields [16]. For WITCH ongoing optimization should yield an increase in overall efficiency of a factor of ten or more. Still, the decay of 35Ar was observed on the first VBL MCP detector (Fig. 17). The half life of 35Ar obtained as the weighted average of two short measurements is: s (the value in literature is 1.775(4) s). This showed that ISOLDE delivered a clean 35Ar+ beam with no radioactive contaminant, as is required for the planned recoil spectrum measurements.
4 Outlook & improvements
The WITCH set-up was completed and first commissioning tests performed only recently. There is still room for many improvements and more tests are necessary to better understand the behaviour of the different parts of the set-up.
The non-pulsed high energy 60 keV (30 keV) ions arrive first on the diagnostic MCP and can cause saturation of the detector, reducing its sensitivity, i.e. disturbing the tuning and efficiency measurements. Part of these energetic ions also reaches the detection MCP at the end of the spectrometer, in spite of the magnetic field. This will influence the measurement of the recoil ion spectrum. Another drawback is that during a radioactive run, the decays of non-pulsed 60 keV (30 keV) radioactive ions implanted directly on the detection MCP will lead to additional background. All these problems can be avoided if one uses a beam gate installed in the HBL (or VBL) in order to select only the part of the original beam corresponding to the correctly pulsed ions. The required electronics to switch the voltages in the range of 1000 V within several 100 ns is currently being developed.
A new system of VBL diagnostics is currently being prepared. It is based on an MCP detector with split anode and a Ni-mesh in front of it. The latter reduces the intensity of the incoming beam in order to avoid saturation of the detector. The transparency of this mesh can be measured to good precision with laser light. The split anode system provides the possibility to check the beam size and its position “on-line”. The combination of the Ni-mesh and the split anode will allow to avoid problems caused by the saturation of the MCP during the beam tuning.
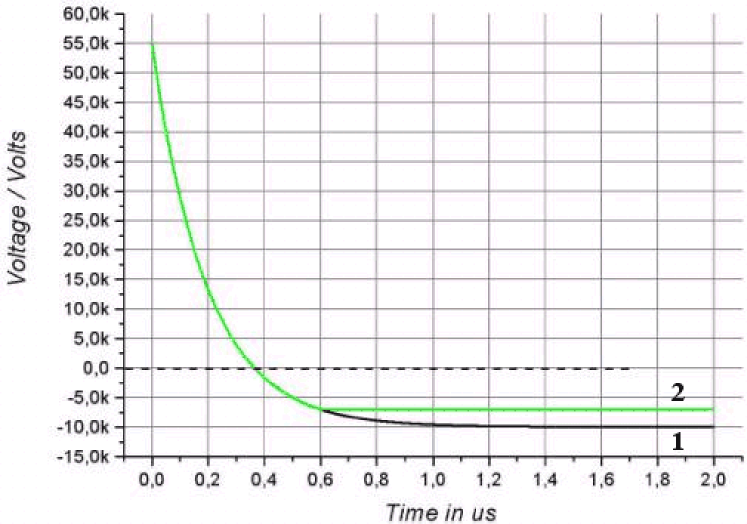
Based on the new HV switch system of ISOLTRAP a new HV scheme was developed in close cooperation with a company222 Dr. Stefan Stahl - Elektronik-Beratung, Sonderanfertigungen · Kellerweg 23, D - 67582 Mettenheim · Germany.. This new system is more reliable for 60 kV switching and has in addition the advantage that the switching time is improved by a factor of . This is done with an approach of a clamping diode, which ties the decreasing voltage to a pre-defined value for a limited period of time. The switching process in this case starts as usual (Fig. 18), i.e. the voltage of the PDT goes down towards the negative biasing voltage. After roughly 600 ns, corresponding to , the voltage has dropped below the value of an auxiliary voltage supply to which the diode is connected. The diode therefore becomes conducting and prevents the PDT-voltage from a further decrease.
The trap tests showed that the buffer gas of the cooler trap contains impurities. The main effect of this is that the ions of interest can be neutralized via charge exchange and can thus escape from the trap. To avoid this, the external gas line has to be as short as possible (the internal part cannot be changed), while in addition it has to be cleaned, baked and pumped to remove contaminations. To further clean the buffer gas one can in addition install a cold trap or use a commercially available He purifier. During the commissioning period it was realized that a higher energy for the ions leaving the PDT improves the injection in the cooler trap. However, this requires an upgrade of the end cap power supplies. The corresponding electronics is currently being developed. With respect to the detection part, an 8 cm diameter MCP detector with position sensitive anode will be used to study the size of the recoil ion beam, the possible dependence of the beam size on the ion energy, as well as the -background. This MCP and the necessary electronics will be provided by the LPC-Caen group [41, 42].
To carry out efficiency tests and improve the beam tuning in WITCH, it is necessary to transport ion beams through the complete WITCH beamline. The REXTRAP ion source is often needed by the REXTRAP team for tests and, in addition, can not be used during experiments involving the REXTRAP set-up (since this ion source blocks the ISOLDE beam at the entrance of REXTRAP). A design study was therefore started to develop an ion source for WITCH similar to the one of REXTRAP and to implement this in the horizontal beamline.
The vacuum of the WITCH system is at present reasonably good ( mbar) for normal WITCH operation but can still be improved to avoid pressure related systematic effects and to reduce the charge exchange probability. The WITCH spectrometer was designed with the possibility to use non-evaporable getters (NEG) and it is planned to put this system in operation soon.
Finally, additional tests are being prepared in order to improve the WITCH efficiency. For instance, one may try to optimize REXTRAP operation so as to reduce the ion bunch length, try to determine the rest gas pressure in the WITCH traps, study the size of the ion cloud, investigate space charge effects, and try to obtain an optimal cooling time. In addition, investigation of the spectrometer and its response function, as well as measurements to check the -background on the main detector are planned as well.
5 Conclusion
The installation period of the WITCH set-up, which was developed over the last few years, was finished in autumn 2004 while intensive commissioning of the set-up was performed during the whole year 2004. The main aim of these tests was to check the operation of the beam transport, the pulsing down of the ion beam and the injection of ions into the high magnetic field, to test the trap basics and check the spectrometer operation, and finally, to optimize as many settings as possible. These tests showed that the full set-up up to the spectrometer is now operational, although several efficiencies still have to be improved. The present overall efficiency of the experiment did not allow to actively test the retardation spectrometer which can only be done fully with radioactive ions. The results of the commissioning stage were carefully analyzed and possible improvements were suggested. This includes both technical modifications as well as the necessary tests in order to optimize the set-up and achieve the required efficiency.
Acknowledgement
This work is supported by the European Union grants FMRX-CT97-0144 (the EUROTRAPS TMR network) and HPRI-CT-2001-50034 (the NIPNET RTD network), by the Flemish Fund for Scientific Research FWO and by the projects GOA 99-02 and GOA 2004/03 of the K.U.Leuven. This research was partly funded with a specialization fellowship of the Flemish Institute for the stimulation of Scientific-Technological Research in the Industry (IWT). D.B. was supported by a Marie-Curie fellowship from the TMR program of the European Union.
References
- [1] T.D. Lee and C.N. Yang, Phys. Rev., 104 (1956) 254.
- [2] J.D. Jackson and S.B. Treiman and H.W. Wyld, Phys. Rev., 106 (1957) 517.
- [3] N. Severijns and M. Beck and O. Naviliat-Cuncic, Rev. Mod. Phys., (2006) to be published.
- [4] J.D. Jackson and S.B. Treiman and H.W. Wyld, Nucl. Phys., 4 (1957) 206.
- [5] J.C. Hardy and I.S. Towner, Phys. Rev. Lett., 94 (2005) 092502.
- [6] C.S. Wu and S.A. Moszkowski, Beta Decay, John Wiley & Sons Inc., New York, 1966.
- [7] L.S. Brown and G. Gabrielse, Rev. Mod. Phys., 58 (1986) 233.
- [8] M. Beck et al., Nucl.Instr. and Meth. A, 503 (2003) 567.
- [9] A. Picard et al., Nucl. Instr. and Meth. B, 63 (1992) 345.
- [10] V.M. Lobashev and P.E. Spivak, Nucl. Instr. and Meth. A, 240 (1985) 305.
- [11] J.D. Jackson, Classical Electrodynamics, John Wiley & Sons Inc., New York, 1975
- [12] V.Yu. Kozlov, M. Beck et al., Phys. of Atom. Nucl., 67 (2004) 1112.
- [13] T.A. Carlson, F. Pleasonton, and C.H. Johnson, Phys. Rev., 129 (1963) 2220.
- [14] E. Kugler et al., Nucl. Instr. and Meth. B, 70 (1992) 41.
- [15] E. Kugler, Hyp. Int., 129 (2000) 23.
- [16] ISOLDE Collaboration, http://isolde.web.cern.ch/ISOLDE/
- [17] F. Ames et al., Nucl. Instr. and Meth. A, 538 (2005) 17.
- [18] F. Herfurth et al., Nucl. Instr. and Meth. A, 469 (2001) 254.
- [19] D. Beck et al., Nucl. Phys. A, 701 (2002) 369.
- [20] B. Delauré, Development of a Penning trap based Set-up for Precision Tests of the Standard Model, Ph.D. thesis, Katholieke Universiteit Leuven, 2004
- [21] A. Gorelov et al., Hyp. Int., 127 (2000) 373.
- [22] A.H. Snell, The Atomic and Molecular Consequences of Radioactive Decay, in Alpha-, Beta- and Gamma-Ray Spectroscopy, ed. Siegbahn, North Holland, 1968, 1545.
- [23] A.H. Snell and F. Pleasonton, Phys. Rev., 100 (1955) 1396.
- [24] N. Scielzo et al., Phys. Rev. A, 68 (2003) 022716.
- [25] S. Agostinelli et al., Nucl. Instr. and Meth. A, 506 (2003) 250.
- [26] GEANT4 Home page, http://geant4.web.cern.ch/geant4
- [27] V.Yu. Kozlov, WITCH, a Penning trap for weak interaction studies, Ph.D. thesis, Katholieke Universiteit Leuven, 2005. CERN-THESIS-2006-009
- [28] B. Delauré et al., Nucl. Instr. and Meth. A, to be published.
- [29] D.A. Dahl, SIMION 3D 6.0: users manual, Princeton Electronic systems, Inc., 1995.
- [30] G. Savard et al., Phys. Lett. A, 158 (1991) 247.
- [31] G. Bollen et al., Nucl. Instr. and Meth. A, 368 (1996) 675.
- [32] H. Raimbault-Hartman et al., Nucl. Instr. and Meth. B, 126 (1997) 378.
- [33] D. Lunney and G.Bollen, Hyp. Int., 129 (2000) 249.
- [34] D. Beck, Ph.D. thesis, Johannes Gutenberg Universität Mainz, 1997.
- [35] M. König et al., Int. J. Mass Spec., 142 (1995) 95.
- [36] J.L. Wiza, Nucl. Instr. and Meth., 162 (1979) 587.
- [37] R.S. Gao et al., Rev. Sci. Instr., 55 (1984) 1756.
- [38] B. Brehm et al., Meas. Sci. Tech., 6 (1995) 953.
- [39] S. Coeck et al., Nucl. Instr. Meth. A, 557 (2006) 516.
- [40] S. Stahl, Technical report, Elektronik-Beratung, Sonderanfertigungen, Kellerweg 23, D - 67582 Mettenheim · Germany (2004).
- [41] Roentdek Handels GmbH, Kelkheim-Ruppertshain, http://www.roentdek.de
- [42] E. Liénard et al., Nucl. Instr. and Meth. A, 551 (2005) 375.
- [43] J. Behr, private communication.
- [44] N. Scielzo, private communication.

| Description of the parameter | Efficiency | |
|---|---|---|
| ideal set-up | achieved | |
| HBL efficiency, | 100% | 100% |
| PDT efficiency, | 43% | 8% |
| Injection into the magnetic field, | 100% | 1%10% |
| Trapping in the cooler trap | 100% | 60% |
| Losses during cooling | 100% a) | |
| Efficiency of transfer between traps | 100% | |
| Losses in the decay trap | 100% a) | 100% |
| Fraction of ions leaving the decay trap, taking into account the cut-off angle () and solid angle () | 40% d) | not yet studied |
| Shake-off for charge state , | 10% | not yet studied |
| Transmission through spectrometer | 100% a) | not yet studied |
| MCP efficiency, | 60% | 52.3(3)% e) |
| Total efficiency | ||
| a) 100% means that there are no losses. | ||
| b) after 300 ms of cooling, with 5 mbar He buffer gas pressure at the measurement position. | ||
| c) estimated from the tests performed, but one of the other effects (e.g. MCP regime) was not taken into account. | ||
| d) ion energy dependent value. | ||
| e) from E. Liénard et al., Nucl. Instr. and Meth. A, 551 (2005) 375. | ||
| f) when an efficiency has not been determined yet the values for an ideal set-up are taken. | ||