The NIMROD collaboration
Properties of the Initial Participant Matter Interaction Zone in Near Fermi-Energy Heavy Ion Collisions
Abstract
The sizes, temperatures and free neutron to proton ratios of the initial interaction zones produced in the collisions of 40 MeV/nucleon 40Ar + 112Sn and 55 MeV/nucleon27Al + 124Sn are derived using total detected neutron plus charged particle multiplicity as a measure of the impact parameter range and number of participant nucleons. The size of the initial interaction zone, determined from a coalescence model analysis, increases significantly with decreasing impact parameter. The temperatures and free neutron to proton ratios in the interaction zones are relatively similar for different impact parameter ranges and evolve in a similar fashion.
pacs:
24.10.i,25.70.GhI Introduction
For a collision between two heavy nuclei, measurements of emission cross-sections for early emitted nucleons and light clusters offer a means to probe the properties and evolution of the interaction region at early stages of the collision. Since light cluster production in such collisions reflects the particle-particle correlations within this interaction region, detection of a cluster can be viewed as a correlation measurement of its constituent particles in a bound state. Together with suitable application of a coalescence ansatz csernai86 ; mekjian78 ; sato81 ; awes81_1 ; llope95 , this approach provides information which is complementary to that obtained in particle-particle correlation measurements that are well established in the nuclear context and have been applied in a wide range of studies bauer92 ; ardouin97 . We have previously applied these techniques to obtain information on the early reaction dynamics and on the thermal evolution of the hot nuclei produced in near Fermi energy heavy ion collisions cibor00 ; cibor01 ; hagel00 ; wang05_1 ; wang05_2 . In this paper we report on the use of coalescence model analyses of light particle emission to probe the impact parameter dependence of the properties of the initial interaction zone and the evolution of participant matter produced in collisions of 40 MeV/nucleon 40Ar + 112Sn and 55 MeV/nucleon 27Al + 124Sn. We find that the size of the initial interaction zone increases significantly with decreasing impact parameter. The temperatures and free neutron to proton ratios in the interaction zones are relatively similar for different impact parameter ranges and they evolve in a similar fashion.
II Experiment
The reactions 40 MeV/nucleon 40Ar + 112Sn and 55 MeV/nucleon 27Al + 124Sn were studied at the K-500 super-conducting cyclotron facility at Texas A&M University. For these studies we used the NIMROD detector array consisting of a charged particle array inside a neutron calorimeter wada04 ; schmitt95 . The charged particle detector array of NIMROD includes 166 individual CsI detectors arranged in 12 rings in polar angles from to . In these experiments Si-CsI telescopes were used to identify intermediate mass fragments (IMF). For the present experiment each forward ring also included two “super-telescopes”, each containing two Si E detectors and a CsI E detector and seven telescopes containing a single Si E detector and a CsI E detector. Neutron multiplicity was measured with the neutron detector surrounding the charged particle array. This detector is a neutron calorimeter filled with a Gadolinium-doped pseudocumene liquid scintillator. Thermalization and capture of emitted neutrons leads to scintillation which is observed with phototubes providing event by event determinations of neutron multiplicity but little information on neutron energies and angular distributions. Further details on the detection system, energy calibrations and neutron calorimeter efficiency may be found in references wada04, . During the experiment, data were taken employing two different trigger modes, one a minimum bias trigger in which at least one of the CsI detectors detected a particle and the other a high multiplicity trigger which required detected particles in 3 to 5 CsI detectors (depending upon the reaction studied). We have previously reported on excitation energy deposition and composite nucleus de-excitation in the most violent collisions observed for these systems wang05_2
III Data Analysis
Many of the techniques applied in this analysis have been discussed previously in greater detail in references wang05_1, ; wang05_2, ; cibor00, ; hagel00, ; cibor01, ; wada04, ; ma05, . Only a brief summary of these techniques is included in the present work.
For the reaction systems studied, an inspection of the two dimensional arrays depicting the detected correlation between charged particle multiplicity and neutron multiplicity in NIMROD reveals a distinct correlation in which increasing charged particle multiplicity is associated with increasing neutron multiplicity.
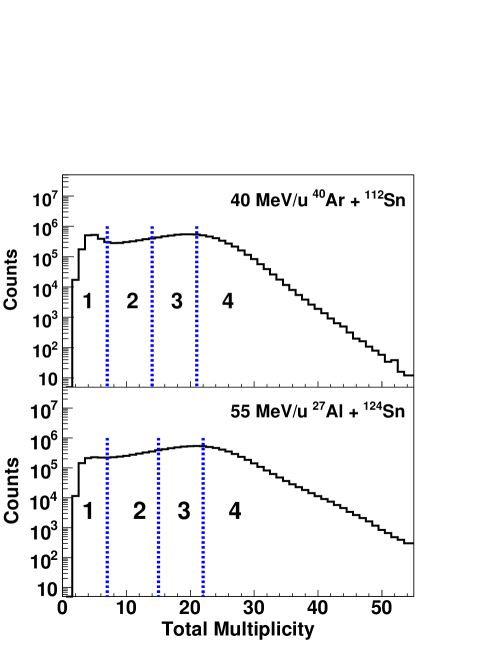
Although there are significant multiplicity fluctuations reflecting both the competition between the different decay modes and the instrumental detection efficiencies, the data show that the total number of emitted particles can serve as a means for categorizing collisions according to overall degree of collision violence. Simulations with the AMD-V transport code ono99 lead to similar conclusions. For the two reactions considered, the experimental distributions of total neutron plus charged particle multiplicity are shown in Figure 1. For the analysis reported in this paper we have used the total combined charged particle plus neutron multiplicities to select event classes for further analysis. For each of the reactions, events corresponding to four different regions of observed total detected neutron plus charged particle multiplicity were selected for analysis. These regions in total multiplicity are indicated by the dashed lines in Figure 1.
For the events in each selected multiplicity region we then carried out analyses using three-source fits to the observed energy and angular distributions of the light charged particles. The assumed sources were the PLF ( projectile-like fragment ) source, the target-like fragment source (TLF) and an intermediate velocity (IV) source awes81_1 ; awes81_2 ; wang05_2 ; prindle98 ; wada89 . From these fits we obtained parameters describing the ejectile spectra and multiplicities which can be associated to the three different sources. For the reactions studied, the spectral parameters for of 1H, 2H, 3H, 3He and 4He emission from the different sources, derived from the fits, follow the trends of earlier reported values at such projectile energies awes81_1 ; awes81_2 ; wang05_2 ; prindle98 ; wada89 ; fox88 . The IV source slope parameters for 1H, 2H, 3H, 3He and 4He are characteristic of those for pre-equilibrium emission in this projectile energy range awes81_2 ; wada89 ; wang05_2 ; prindle98 ; fox88 ; chiang80 ; cervesato92 . Given the continuous dynamic evolution of the system, such source fits should be considered as providing only a schematic picture of the emission process. We have employed them to estimate the multiplicities and energies of ejectiles emitted at each stage of the reaction for each region of multiplicities. Both the mass of light ejectiles associated with the IV source and that associated with the TLF source increase monotonically with collision violence.
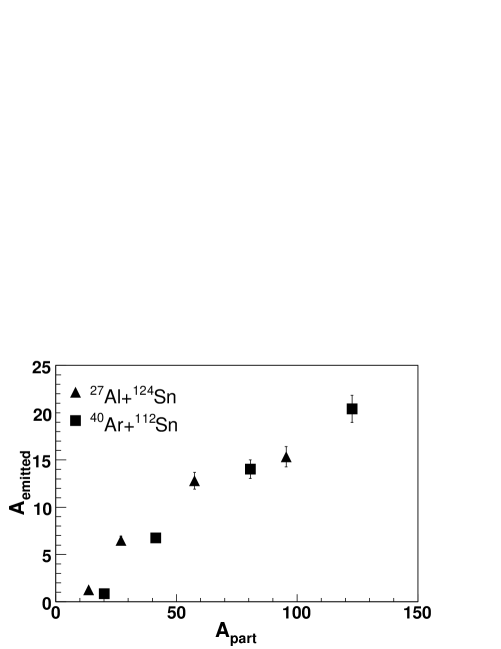
In the following we shall be particularly interested in the properties of the ejectiles from the IV source. To explore this part of the emission further, we have employed the Glauber model of reference glauber, to estimate the number of participating nucleons corresponding to the different selected bins in total multiplicity. For this purpose a sharp cut-off approximation was employed to divide the results of the Glauber model calculation into four impact parameter bins, ranging from peripheral to central. These bins were matched to the bins employed for the experimental data by assuming that increasing violence corresponds to decreasing impact parameter and choosing the impact parameter ranges for each bin to assure that it contained an identical fraction of the total reaction cross-section to that of the corresponding experimental sample. For each bin the average number of participant nucleons, Apart, was then determined from the Glauber model calculation. In Figure 2 we present the relationship between the average numbers of participating nucleons and the yields of ejectiles for emission from the IV source. For both systems, the mass yield is seen to increase monotonically with Apart, confirming the strong correlation between the collision violence and the number of early emitted particles. This reflects the early collision dynamics within the initial interaction zone containing the participant matter from the two collision partners.
In the following we attempt to probe further into the nature of this initial participant zone.
IV Participant zone properties
To probe the properties of the initial interaction zone, i.e., the sizes, temperatures and N/Z ratios of these zones, we have applied coalescence model analyses csernai86 ; mekjian78 ; sato81 . In coalescence models the yields of ejected light clusters are directly related to the free nucleon yields. The phase space correlations which lead to cluster formation may be parameterized in terms of the momentum space volume within which the correlations between nucleons exist. This momentum space volume is assumed to be spherical with a radius of P0. Analysis of the nucleon and cluster yields and extraction of P0 provides information on the properties of the emission zone.
To determine the coalescence parameter, P0, in our energy range we have followed the Coulomb corrected coalescence model formalism of Awes et al. awes81_1 for which the laboratory frame differential yield for a cluster of Z protons and N neutrons, having mass number A and a Coulomb-corrected energy per nucleon EA is:
| (1) | |||||
where t denotes the target nucleus and p the projectile nucleus.
This cluster yield is directly related to the proton double differential yield at the same energy per nucleon, E, i.e., at the same velocity. The energy prior to Coulomb acceleration is obtained in the analysis by subtraction of the Coulomb barrier energy, Ec, derived from the source fits. Since the system size may evolve during the particle emission stage we derive the parameter P0 as a function of velocity as in previous works cibor00 ; cibor01 ; hagel00 ; wang05_1 ; wang05_2 . The velocity we employ is the “surface velocity”, Vsurf, of the emitted particle, defined as the velocity of an emitted species at the nuclear surface, prior to acceleration in the Coulomb field awes81_1 . To focus on the earlier evolution of the system we also subtracted the contributions from the TLF source from the total spectra. This was done using the experimentally determined fit parameters for the TLF source. Since the early emitted light particle energies are strongly correlated with emission times, and the evaporative or secondary emission contributions to the spectra are primarily at the lower kinetic energies, the yields of higher energy particles are relatively uncontaminated by later emission processes. To further focus on early particle emission we chose to work in the IV source frame and define Vsurf as the surface velocity in that frame. In that IV frame we selected nucleons and clusters emitted at mid-rapidity, i.e., at angles of 70 to 80 degrees in the IV source frame. In this way we attempted to isolate the emission associated with the IV source that occurs during the thermalization stage of the reaction by minimizing contributions from the PLF and TLF sources.
V 3H/3He Ratios and Ratios
As indicated by Equation 1, in this coalescence model the ratios of two isotopes which differ by one neutron are essentially determined by the ratio of “free nucleons “in the coalescence volume. Thus, the free n/p ratio can be determined from a measurement of the 3H/3He ratio famiano06 ; keutgen . In Figure 3 we present measured values of the 3H / 3He ratio as a function of Vsurf.
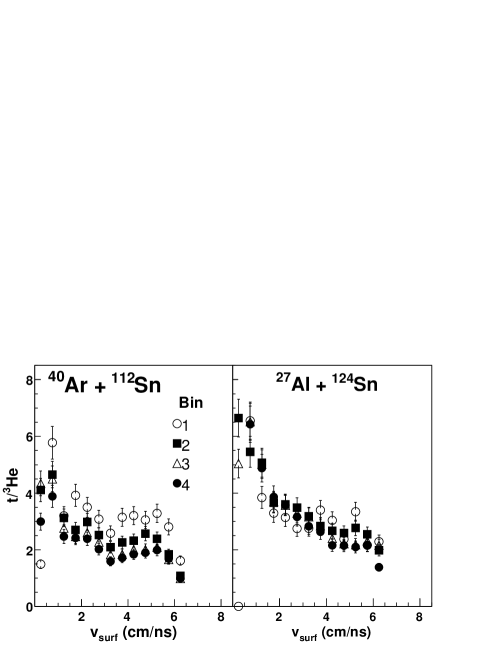
Except at the very highest velocities, these ratios are seen to be significantly higher than the total N/Z ratios in the entrance channel (1.24 for 40Ar + 112Sn and 1.40 for 27Al + 124Sn). This is consistent with earlier results obtained by Albergo et al. albergo85 who deduced significant free neutron excesses based on integrated yields observed in a variety of early intermediate energy experiments. Other recent work also results in large 3H/3He ratios hagel00 ; xu99 ; veselsky00 . It has been suggested that such observations provide evidence for a distillation leading to a nucleon vapor which is enriched in neutrons relative to a co-existing nuclear liquid in accordance with predictions of several theoretical studies muller95 ; baran98 . However, Sobotka et al. have pointed out that symmetric cluster formation may play an important role in determining these ratios sobotka97 .
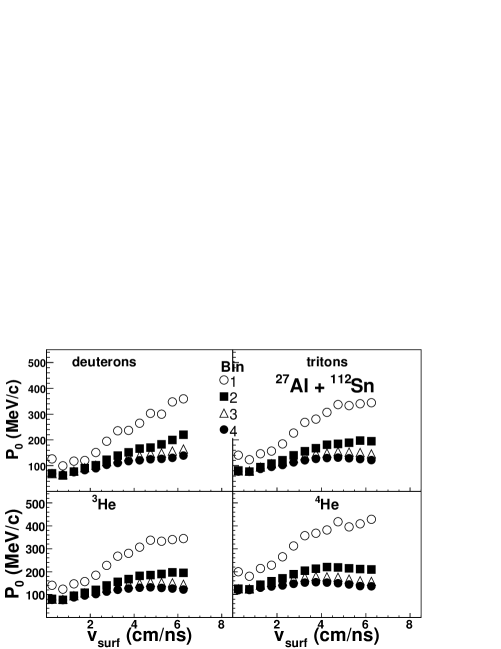
VI Coalescence Parameters, P0
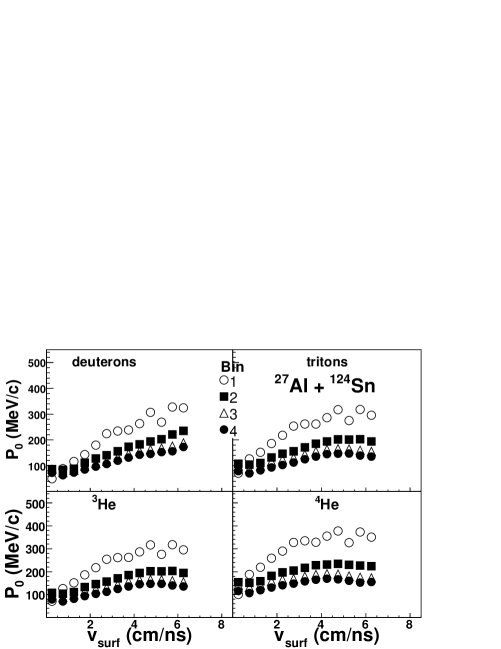
Using the observed 3H / 3He ratios to determine the n/p ratios required in equation 1, we have calculated the coalescence radius, P0, as a function of Vsurf. It should be noted that the method of derivation of the N/Z ratio from the 3H to 3He ratio leads to identical P0 values for 3H and 3He. The results, presented in Figures 4 and 5 reveal that, for each light cluster, the derived values of P0 decrease with decreasing Vsurf and also decrease with increasing total neutron plus charged particle multiplicity. A closer inspection shows that the trend with surface velocity appears somewhat different for deuterons than for the other clusters. We also see a tendency for P0 values for alpha particles in a given multiplicity bin to be larger than values for the other clusters.
VII Interaction Zone Sizes
To extract nuclear size information from the P0 measurements, the thermal coalescence model of Mekjian mekjian78 has been employed. In the Mekjian model there is a direct relationship between the volume in momentum space and the coordinate space volume of the emitting system. In terms of the P0 derived from Equation 1 the relationship is:
| (2) |
where Z, N and A have the same meaning as in Equation 1, E0 is the binding energy, s is the spin of the emitted cluster and T is the temperature. Thus in the coalescence model ansatz the volume of the emitting system can be derived from P0. For this purpose, the temperature must be determined. Assuming a spherical shape of uniform density, the configuration space radius, R0, may then be derived. This model assumes that both chemical and thermal equilibrium are achieved. Thus its applicability must be evaluated using a variety of experimental observables. In our previous work on similar systems, we have concluded that the data are consistent with achievement of such an equilibration, at least on a local basis wang05_1 ; wang05_2 . This point is discussed further in the following section.
VIII Double Isotope Ratio Temperatures
In an equilibrium model framework, the temperatures may be evaluated from double isotope yield ratio measurements mekjian78 ; albergo85 ; wang05_1 ; wang05_2 . Using the same techniques as in references wang05_1 ; wang05_2 we have determined, the double isotope yield ratio temperatures, THHe, derived from the yields of 2H , 3H ,3He and 4He clusters. This has been done as a function of ejectile velocity for each total multiplicity window for the two different systems under consideration. For particles emitted from a single source of temperature, T, and having a volume Maxwellian spectrum , ,where is the particle energy. The HHe double isotope yield ratio evaluated for particles of equal Vsurf, is times the ratio derived from either the integrated particle yields or the yields at a given energy above the barrier wang05_1 . Thus
| (3) |
If Y represents a cluster yield, RVsurf = Y(2H)Y(4He)/Y(3H)Y(3He) for clusters with the same surface velocity and the constants 14.3 and 1.59 reflect binding energy, spin, masses and mass differences of the ejectiles. Equation 3 differs from the usual formulation by a factor of appearing in the logarithm term in the denominator albergo85 . We present, in Figure 6, the resultant double isotope ratio temperatures, THHe, as a function of surface velocity. For the most violent collisions the temperature results have previously been reported wang05_2
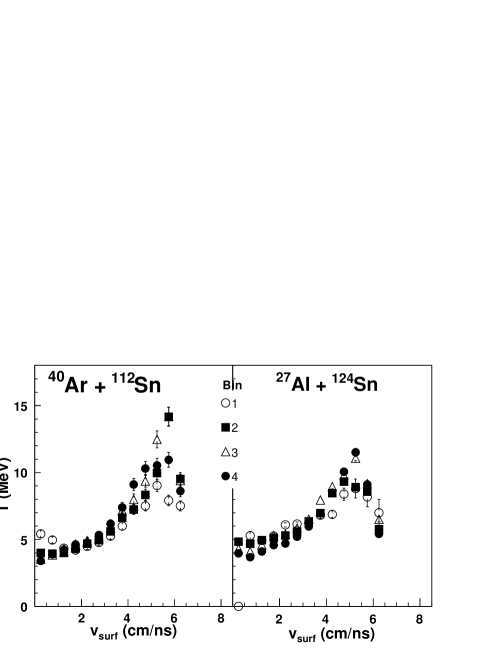
In Figure 6 we see that as Vsurf decreases from the highest Vsurf sampled, i.e., as reaction time increases, each of the temperature evolution curves exhibits a maximum and then decreases. Maximum temperatures of 8-14 MeV are observed.The trends in Figure 6 are very similar to those reported for previous measurements of the temperature evolution in the reactions of 26-47 MeV/nucleon projectiles with various targets cibor00 ; hagel00 ; wang05_1 ; wang05_2 . In those works the correlation of decreasing surface velocity with increasing emission time is discussed. In reference wang05_1, the peaks in the temperature at surface velocities near 6 cm/ns were interpreted as corresponding to times in the range of 95 to 110 fm/c, depending upon reaction system. After that time the temperature decreases monotonically with decreasing surface velocity. The AMD-V model calculations ono99 ; wada04 ; wang05_1 ; wang05_2 for those systems indicate a significant slowing in the rate of change of the ejectile kinetic energy near a velocity of 3.5 cm/ns, signaling the end of the IV (or pre-equilibrium) emission stages and entry into the region of slower nuclear de-excitation modes, i.e., evaporation, fission and/or fragmentation. At that point the sensitivity of the emission energy to time is significantly reduced. Consequently, we take the temperature at the time corresponding to the velocity of 3.5 cm/ns to be that of the hot nucleus at the beginning of the final statistical emission stage (appropriate to initial emission from the TLF source.) At that point the corresponding THHe temperatures are near 6 MeV and thus very similar to the limiting temperatures previously derived from a systematic investigation of caloric curve measurements natowitz02_1 , in this mass region. In reference wang05_1 ; wang05_2 it is concluded that, for velocities below those corresponding to the peaks in the temperature curves, the temperature data are consistent with the achievement of chemical and thermal equilibration, at least as sampled on a local basis.
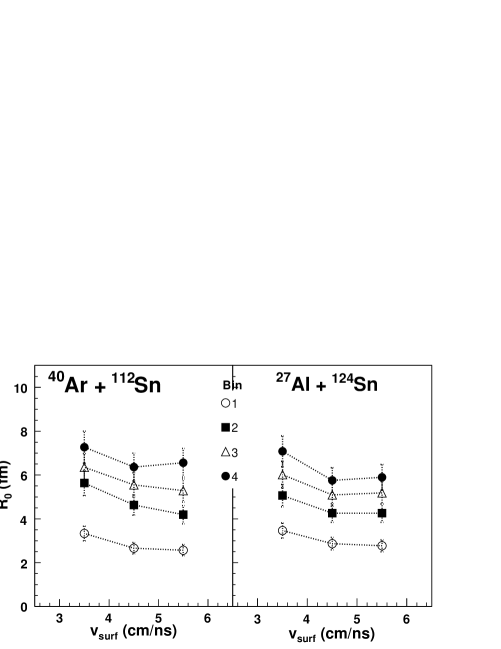
IX Emission Zone Radii
In Figure 7, average values of R0 for the two systems, obtained from the four different ejectiles, are presented for the four different windows of total neutron plus charged particle multiplicity. Over the range of Vsurf from 3 to 6 cm/ns these values are averaged for 1 cm/ns intervals. Here the observed trends in P0 result in a significant increase in R0 with increasing total neutron plus charged particle multiplicity. The derived values of R0 are seen to range from to fermis and be rather similar for the two systems. For the most violent collisions, values of R0 at the highest surface velocities are 6 to 6.5 fermis, close to the expectations for the equivalent sharp cut-off radius of normal density nuclei with total mass numbers equal to those of the entrance channel, A=151 or 152 preston62 . An increase of R0 with decreasing velocity is seen for the the different impact parameter windows, The fractional changes for different windows are quite similar.
In order to further evaluate the evolution of the interaction zone size, we have explored the correspondence between interaction zone size and the number of participant nucleons. For this purpose we have adopted a somewhat different estimate of the later quantity by relaxing the sharp-cut-off approximation of the Glauber model estimate. As previous calculations employing the AMD model of Ono et al. ono99 , had been found to reproduce well a variety of experimental observables for similar systems, we filtered results of AMD calculations for the two systems using the same conditions as employed for the experimental data. Not unexpectedly these results indicated that the impact parameter ranges selected by the adopted windows in total charged particle plus neutron multiplicity are not as sharply defined as those used to determine the average A of the Glauber model. We then revised these estimates of A by weighting the Glauber model results by the derived AMD impact parameter distributions. This procedure results in estimates of the participating nucleon numbers which are 10% lower than those obtained with the sharp cut-off assumption. In Figure 8 (a)-(c) the derived radii are plotted against these refined estimates, designated A. For comparison, fits of the function are also shown. This function fits the data reasonably. The values of extracted from these fits increase with decreasing surface velocity. They are 1.27fm, 1.28 fm and 1.51 fm respectively for the 5-6, 4-5 and 3-4 cm/ns windows. The scaling clearly implies that the size of the zone being sampled is proportional to A. If the zone contains A nucleons and has a spherical shape, a comparison of the r0values with the equivalent uniform radius parameter for normal density nuclei with A=151 preston62 , indicated by an open circle in each part of Figure 8, would suggest corresponding average densities decreasing from to (where is the normal ground state nuclear density)as the system evolves and Vsurf decreases. Such average density estimates are close to those derived from a Fermi gas model analysis of caloric curves for similar systems natowitz02_2 .
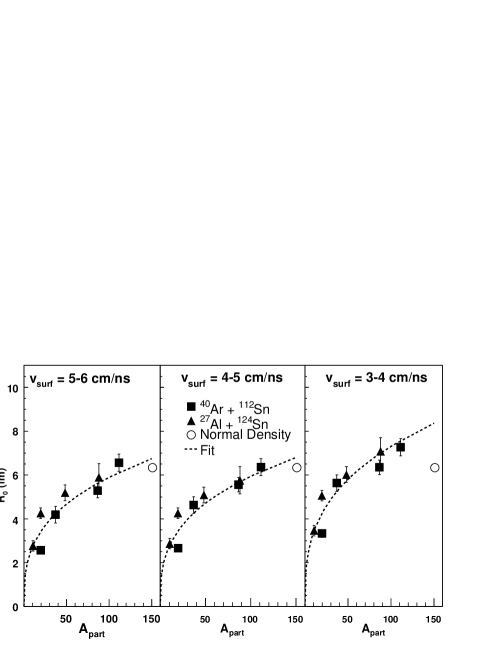
However, given that 1) many collisions should be Pauli blocked, that 2) some nucleons are emitted during this process and that 3) thermalization is occurring, it is difficult to extract precise information on the densities. Indeed, the AMD calculations for these and similar systems clearly indicate large density fluctuations with fragments of normal density imbedded in a lower density medium of nucleons and smaller clusters, a nuclear gas ono99 ; wada04 . If the nuclear gas is equated to the early emitted particles from the IV source, the observed scaling with A may simply reflect the direct dependence of the total mass of the emitted particles on the number of participant nucleons which is seen in Figure 2. In such a case, the interaction zone radii extracted from the coalescence model might better be viewed as those characterizing the nuclear gas and the densities derived from the ratios of the number of gas nucleons to the interaction zone radii would near 0.10. If this latter interpretation proves to be correct, it may be possible to employ analyses of such reaction data to test theoretical predictions of the properties of low density nuclear gases beyer00 ; shen98 ; horowitz05 in greater detail.
X Summary and Conclusions
The sizes, temperatures and free neutron to proton ratios of the initial interaction zones produced in the collisions of 40 MeV/nucleon 40Ar + 112Sn and 55 MeV/nucleon 27Al + 124Sn are derived for different degrees of collision violence, selected by gating on the total multiplicity of emitted neutrons and charged particles. The size of the initial interaction zone, derived from coalescence model analyses, increases significantly with total neutron plus charged particle multiplicity (centrality). The temperatures and the free neutron to proton ratios in these zones exhibit very similar evolutions with decreasing surface velocity. The similar behavior of these observables with surface velocity for the different bins indicates that the thermal and chemical properties of the participant zones are very similar from the most peripheral to the most central collisions. The interaction zone radii obtained from the coalescence analyses have been found to correlate well with the number of nucleons in the participant matter region. The interpretation of this correlation is discussed and it is suggested that measurements of the type reported here may allow more detailed investigation of the properties of low density nuclear gases, a topic of both nuclear and astrophysical interest beyer00 ; shen98 ; horowitz05 . We are currently exploring this possibility.
XI Acknowledgements
This work was supported by the United States Department of Energy under Grant # DE-FG03- 93ER40773 and by The Robert A. Welch Foundation under Grants # A0330 and A-1266.
References
- (1) L.P. Csernai and J.I. Kapusta, Phys. Rep. 131, 223 (1986).
- (2) A.Z. Mekjian, Phys. Rev. C 17, 1051 (1978); Phys. Rev. Lett. 38, 640 (1977); Phys. Lett B 89, 177 (1980).
- (3) H. Sato and K. Yazaki, Phys. Lett. 98B, 153 (1981).
- (4) T.C. Awes, G. Poggi, C.K. Gelbke, B.B. Back, B.G. Glagola, H. Breuer and V.E. Viola, Jr., Phys. Rev. C 24, 89 (1981).
- (5) W. J. Llope, S. E. Pratt, N. Frazier, R. Pak, D. Craig, E. E. Gualtieri, S. A. Hannuschke, N. T. B. Stone, A. M. Vander Molen, G. D. Westfall, J. Yee, R.A. Lacey, J. Lauret, A.C. Mignerey, and D. E. Russ, Phys. Rev. C 52, 2004 (1995).
- (6) W. Bauer, C. K. Gelbke and S. Pratt, Ann. Rev. Nucl. And Part. Sci. 42, 77 (1992).
- (7) D. Ardouin, Int. J. Mod. Phys. E 6, 391 (1997).
- (8) J. Cibor, R. Wada, K. Hagel, M. Lunardon, N. Marie, R. Alfaro, W. Q. Shen, B. Xiao, Y. Zhao, J. Li, B. A. Li, M. Murray, J. B. Natowitz, Z. Majka and P. Staszel, Phys. Lett. B 473, 29 (2000).
- (9) K. Hagel, R. Wada, J. Cibor, M. Lunardon, N. Marie, R. Alfaro, W. Shen, B. Xiao, Y. Zhao, Z. Majka, J. Li, P. Staszel, B.-A. Li, M. Murray, T. Keutgen, A. Bonasera, and J. B. Natowitz, Phys. Rev. C 62, 034607 (2000).
- (10) J. Cibor, A. Bonasera, J. B. Natowitz, R. Wada, K. Hagel, M. Murray and T. Keutgen, in ”Isospin Physics in Heavy-Ion Collisions at Intermediate Energies”, Eds.Bao-An Li and W. Udo Schroeder, NOVA Science Publishers, Inc. (New York), (2001).
- (11) J. Wang, R. Wada, T. Keutgen, K. Hagel, Y. G. Ma, M. Murray, L. Qin, A. Botvina, S. Kowalski, T. Materna, J. B. Natowitz, R. Alfarro, J. Cibor, M. Cinausero, Y. El Masri, D. Fabris, E. Fioretto, A. Keksis, M. Lunardon, A. Makeev, N. Marie, E. Martin, Z. Majka, A. Martinez-Davalos, A. Menchaca-Rocha, G. Nebbia, G. Prete, V. Rizzi, A. Ruangma, D. V. Shetty, G. Souliotis, P. Staszel, M. Veselsky, G. Viesti, E. M. Winchester, S. J. Yennello, W. Zipper, A. Ono, Phys.Rev.C72, 024603 (2005)
- (12) J. Wang, T. Keutgen, R. Wada, K. Hagel, Y. G. Ma, M. Murray, L. Qin, P. Smith, J. B. Natowitz, R. Alfaro, J. Cibor, A. Botvina, M. Cinausero, Y. El Masri, D. Fabris, A. Keksis, S. Kowalski, M. Lunardon, A. Makeev, N. Marie, E. Martin, Z. Majka, A. Martinez-Davalos, A. Menchaca-Rocha, G. Nebbia, S. Moretto, G. Prete, V. Rizzi, A. Ruangma, D. V. Shetty, G. Souliotis, P. Staszel, M. Veselsky, G. Viesti, E. M. Winchester, S. J. Yennello, W. Zipper, A. Ono, Phys.Rev. C71, 054608 (2005).
- (13) R. Wada, T. Keutgen, K. Hagel, Y. G. Ma, J. Wang, M. Murray, L. Qin, P. Smith, J. B. Natowitz, R. Alfarro, J. Cibor, M. Cinausero, Y. El Masri, D. Fabris, E. Fioretto, A. Keksis, M. Lunardon, A. Makeev, N. Marie, E. Martin, A. Martinez-Davalos, A. Menchaca-Rocha, G. Nebbia, G. Prete, V. Rizzi, A. Ruangma, D. V. Shetty, G. Souliotis, P. Staszel, M. Veselsky, G. Viesti, E. M. Winchester, S. J. Yennello, Z. Majka and A. Ono, Phys. Rev. C, Phys. Rev. C69 044610 (2004).
- (14) R. P. Schmitt, L. Cooke, G. Derrig, D. Fabris, B. Hurst, J. B. Natowitz, G. Nebbia, D. O’Kelly, B. Srivastava , B. Turmel, D. Utley, H. Utsonomiya and R. Wada, Nucl. Inst.and Meth. A 354, 487 (1995).
- (15) Y. G. Ma, J. B. Natowitz, R. Wada, K. Hagel, J. Wang, T. Keutgen, Z. Majka, M. Murray, L. Qin, P. Smith, R. Alfaro, J. Cibor, M. Cinausero, Y. El Masri, D. Fabris, E. Fioretto, A. Keksis, M. Lunardon, A. Makeev, N. Marie, E. Martin, A. Martinez-Davalos, A. Menchaca-Rocha, G. Nebbia, G. Prete, V. Rizzi, A. Ruangma, D. V. Shetty, G. Souliotis, P. Staszel, M. Veselsky, G. Viesti, E. M. Winchester, Phys.Rev. C71, 054606 (2005).
- (16) A. Ono, Phys. Rev. C 59, 853 (1999)
- (17) T. C. Awes, G. Poggi, C. K. Gelbke, B. B. Back, B. G. Glagola, H. Breuer and V. E. Viola, Jr., Phys. Rev. C 24, 89 (1981).
- (18) D. Prindle, A. Elmaani, C. Hyde-Wright, W. Jiang, A. A.Sonzogni, R. Vandenbosch, D. Bowman, G. Cron, P.Danielewicz, J. Dinius, W. Hsi, W. G. Lynch, C. Montoya, G.Peaslee, C. Schwarz, M. B. Tsang, C. Williams, R. T. deSouza, D. Fox, and T. Moore, Phys. Rev. C 57, 1305 (1998).
- (19) R. Wada, D. Fabris, K. Hagel, G. Nebbia, Y. Lou, M. Gonin, J. B. Natowitz, R. Billerey, B. Cheynis, A. Demeyer, D. Drain, D. Guinet, C. Pastor, L. Vagneron,K. Zaid, J. Alarja, A. Giorni, D. Heuer, C. Morand, B. Viano, C. Mazur, C. Ngo, S. Leray, R. Lucas, M. Ribrag and E. Tomasi, Phys. Rev. C 39, 497 (1989).
- (20) D. Fox, D.A. Cebra, J. Karn, C. Parks, A. Pradhan, A. Vander Molen, J. van der Plicht, G.D. Westfall, W. K. Wilson and R. S. Tickle, Phys. Rev. C 38, 146 (1988).
- (21) H.C. Chiang and J. Hufner Nucl. Phys. A349, 466 (1980).
- (22) I Cervesato, E Fabrici, E. Gadioli, E. Gadioli-Erba and M. Galmarini, Phys. Rev. C 45, 2369 (1992).
- (23) R. J. Glauber, Phys. Rev. 100, 242 (1955).
- (24) M. Famiano et al, to be published (2006)
- (25) T. Keutgen et al., unpublished data
- (26) S. Albergo, S. Costa, E. Costanzo and A. Rubbino, Nuovo Cimento A 89, 1 (1985).
- (27) H. S. Xu, M. B. Tsang, T. X. Liu, X. D. Liu, W. G. Lynch, W. P. Tan, G. Verde, A. Vandermolen, A. Wagner, H. F. Xi, C. K. Gelbke, L. Beaulieu, B. Davin, Y. Larochelle, T. Lefort, R. T. de Souza, R. Yanez, V. Viola, R. J. Charity, and L. G. Sobotka, Michigan State Report No. MSUCL-1137; NSCL Report No. 5526, (1999).
- (28) M. Veselsky, R. W. Ibbotson, R. Laforest, E. Ramakrishnan, D. J. Rowland, A. Ruangma, E. M. Winchester, E. Martin, and S. J. Yennello, Phys. Rev. C 62 041605 (2000).
- (29) H. Müller and B. Serot, Phys. Rev. C 52, 2072 (1995).
- (30) V. Baran, M. Colonna, M. Di Toro, and A. B. Larioinov, Nucl. Phys. A632, 287 (1998).
- (31) L. G. Sobotka, J. F. Dempsey, R. J. Charity, and P. Danielewicz, Phys. Rev. C 55, 2109 (1997).
- (32) J.B. Natowitz, R. Wada, K. Hagel, T Keutgen, M. Murray, Y. G. Ma , A. Makeev, L. Qin , P. Smith and C.Hamilton, Phys. Rev. C 65, 034618 (2002).
- (33) M. A. Preston, Physics of the Nucleus, Addison- Wesley Publishing Company, Reading, Mass. (1962).
- (34) J. B. Natowitz, K. Hagel, Y. Ma, M. Murray, L. Qin, S. Shlomo, R. Wada, and J. Wang, Phys. Rev. C 66, 031601 (2002).
- (35) M. Beyer, S. A. Sofianos, C. Kuhrts, G. Roepke, and P. Schuck Phys.Lett. B 488, 247 (2000)
- (36) H. Shen, H. Toki, K. Oyamatsu and K. Sumiyoshi, Nucl. Phys. A637 435 (1998); Prog. of Theo. Phys. 100, 1013 (1998).
- (37) C. J. Horowitz and A. Schwenk, ArXiv Preprint nucl-th/0507033 (2005).