Present address:]Dept. of Physics, Texas A & M University, College Station, TX, USA Present address: ]Dept. of Radiology and Radiological Sciences, Vanderbilt University, Nashville, TN, USA Present address: ]Dept. of Physics, University of Zagreb, Zagreb, Croatia Present address: ]Dept. of Physics, George Washington University, Washington, DC, USA,
Measurement of the Absolute Differential Cross Section for np Elastic Scattering at 194 MeV
Abstract
A tagged medium-energy neutron beam has been used in a precise measurement of the absolute differential cross section for np back-scattering. The results resolve significant discrepancies within the np database concerning the angular dependence in this regime. The experiment has determined the absolute normalization with uncertainty, suitable to verify constraints of supposedly comparable precision that arise from the rest of the database in partial wave analyses. The analysis procedures, especially those associated with the evaluation of systematic errors in the experiment, are described in detail so that systematic uncertainties may be included in a reasonable way in subsequent partial wave analysis fits incorporating the present results.
pacs:
13.75.Cs, 21.30.-x, 25.10.+sI INTRODUCTION
Theoretical treatments and applications of the nucleon-nucleon (NN) force at low and intermediate energies have progressed considerably in sophistication through the past decade. Partial wave analyses and potential model fits to the NN scattering database have incorporated explicit allowance for breaking of isospin () symmetry, e.g., by removing constraints that previously required equal phase shifts for the pp and np systems, and have been used to constrain the pion-nucleon-nucleon coupling constant review . Effective field theory approaches Mach2003 have become competitive with more traditional meson-exchange models of the interaction, in terms of the quality of fit provided to the database and the number of adjustable parameters employed, while holding out the promise of providing internally consistent two- and three-nucleon forces from the same theory. Striking success has been achieved in ab initio calculations of the structure of light nuclei abinit by combining phenomenological three-nucleon forces with NN interactions taken without modification from fits to the NN scattering database. An important aspect in these advances has been the approach toward consensus on which measurements should be included in an NN database to which conventional optimization techniques can be sensibly applied. The rejection of specific, allegedly flawed, experiments from the database has not been without controversy. In the present paper, we report detailed results from a new np scattering experiment addressing one of the most prominent of these controversies.
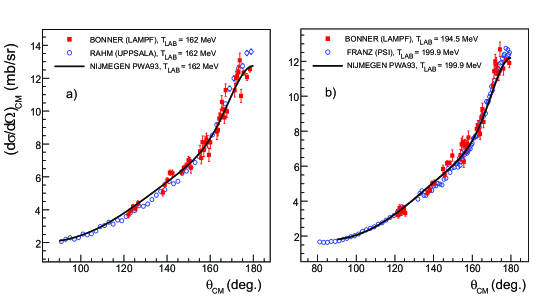
Discrepancies among different experiments have led to a drastic pruning of cross section measurements for intermediate-energy np scattering. For example, the SAID partial wave analysis (PWA) of the np database SAID rejects more than 40% of all measured cross sections in the range 100-300 MeV in neutron laboratory kinetic energy. The rejected fraction is even larger in the Nijmegen PWA Sto1993 ; Ren2001 , especially so for scattering at center-of-mass angles beyond 90∘. The rejected data include nearly all of the most recent experiments, carried out by groups at Uppsala Rah1998 and Freiburg Hur1980 ; Fra2000 . The problems are illustrated in Fig. 1 by the comparison of data from these two groups with earlier Los Alamos measurements Bon1978 that dominate the medium-energy back-angle cross section data retained in the database. Clear differences among these data sets are seen in the shape of the angular distribution. Other differences, reflecting the general experimental difficulty in determining the absolute scale for neutron-induced cross sections, are masked in the figure by renormalization factors that have been applied in the partial wave analyses. Removal of the Uppsala and Freiburg data, which exhibit fairly similar angular dependences, begs the question of whether the criterion used to reject them Sto1993 ; Bug1995 ; Ren2001 ; SAID may subtly bias the PWA results toward agreement with older measurements that might have had their own unrecognized systematic errors.
The np back-angle cross section discrepancies have been highlighted in debates concerning the value and extraction methods for the charged NN coupling constant (in the notation of pseudovector formulations of the interaction, or equivalently in pseudoscalar formulations) Eri1995 ; PiN2000 . np scattering PWA’s appear to determine this basic parameter of the NN force well: e.g., the Nijmegen analysis Sto1993 yields (equivalent to ), and the authors claim that the constraints are imposed by the entire database, with no particularly enhanced sensitivity to any specific observable Sto1993 . In contrast, Ericson et al. have extracted a significantly higher coupling constant, consistent with older “textbook” values (), by applying controversial pole extrapolation techniques to the Uppsala back-angle np scattering cross sections alone Eri1995 . While much debate has centered on the rigor of the pole extrapolation method PiN2000 ; Ren1998 ; Eri1998 , it is clear that the discrepancy in coupling constant values arises in large part Arn1995 from the cross section discrepancies between the Uppsala measurements and the “accepted” database. An experimental resolution of these discrepancies is highly desirable, especially if a new experiment can also pin down the absolute cross section scale. Bugg and Machleidt have pointed out Bug1995 that the largest uncertainty in their determination of is associated with the normalization of np differential cross sections, which are often allowed to float from the claimed normalization in individual experiments by 10% or more in PWA’s. In contrast, the Nijmegen group claims Ren2001 that, despite sizable normalization uncertainties in existing elastic scattering data, precise total cross section measurements fix the np absolute cross section scale to accuracy. This claim could also be checked by a new experiment that provides good experimental precision on absolute differential cross sections.
In the present paper we report detailed results from such a new experiment, designed to resolve these np back-angle cross section discrepancies. The experiment employed techniques completely independent of those used in other medium-energy measurements, in order to provide tight control over systematic errors. A tagged neutron beam Pet2004 centered around 194 MeV kinetic energy bombarded carefully matched, large-volume CH2 and C targets, which permitted accurate subtraction of backgrounds from quasifree scattering and other sources. The bombarding energy range was chosen to match approximately that used in earlier high-precision np scattering polarization measurements from the Indiana University Cyclotron Facility (IUCF) Vig1992 ; Sow1987 ; Bow1994 . Recoil protons from np scattering were identified in a detector array of sufficient angular coverage to measure the differential cross section at all c.m. angles beyond 90∘ simultaneously.
The tagging allows accurate determination of the absolute scattering probability for the analyzed subset of all neutrons incident on a secondary target, but it also offers a host of other, less obvious, advantages important to a precise experiment: (1) accurate relative normalization of data taken with CH2 vs. C targets; (2) event-by-event determination of neutron energy, impact point and incidence angle on the secondary target, with the latter measurement being especially important for cross section measurements very near 180∘ c.m. scattering angle; (3) three-dimensional location of background sources displaced from the secondary target Pet2004 ; (4) precise measurement of the detector acceptance for np scattering events; (5) methods to tag np scattering event subsamples that should yield identical cross section results but different sensitivity to various sources of systematic error. The tagging was thus essential to the entire approach of the experiment; no extra work was required to extract absolute cross sections, and thereby to provide an important calibration standard for medium-energy neutron-induced reactions.
The basic results of this experiment have recently been reported briefly Sar2005 . In the present paper we provide more detail on the comparison of results to PWA’s, on the data analysis procedures and on the evaluation and characterization of systematic uncertainties. Such details are important for resolving the sort of discrepancies that have plagued the np database. Partial wave analyses should, in principle, incorporate experimental systematic as well as statistical errors in optimizing fits to data from a wide variety of experiments. In order to do so, they must have access to clear delineations of which errors affect only the overall normalization, which have angle-dependence and, in the latter case, what the degree of correlation is among errors at different angles. Overall systematic uncertainties in the absolute cross sections reported here average , with a slight angle-dependence detailed herein. Statistical uncertainties in the measurements are in the range in each of 15 angle bins.
II DETAILS OF THE EXPERIMENT
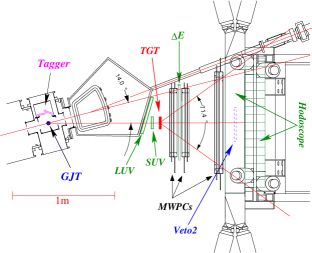
The experiment was carried out in the IUCF Cooler ring Pol1991 , with apparatus (see Fig. 2) installed in a ring section where the primary stored proton beam was bent by 6∘. A primary electron-cooled unpolarized proton beam of 202.5 MeV kinetic energy and typical circulating current of 1–2 mA was stored in the ring. Neutrons of 185-197 MeV were produced via the charge-exchange reaction p+d n+2p when the proton beam passed through a windowless internal deuterium gas jet target (GJT) of typical thickness atoms/cm2. The ultra-thin target permitted detection of the two associated low-energy recoil protons from the production reaction in double-sided silicon strip detectors (DSSD’s) comprising the “tagger”. Measurements of energy, arrival time and two-dimensional position for both recoil protons in the tagger, when combined with the precise knowledge of cooled primary proton beam direction and energy, allowed four-momentum determination for each tagged neutron on an event-by-event basis. During the measurement periods, the stored proton beam was operated in “coasting” mode, with rf bunching turned off to minimize the ratio of accidental to real two-proton coincidences in the tagger. The proton beam energy was then maintained by velocity matching (induced naturally by mutual electromagnetic interactions) to the collinear electron beam in the beam cooling section of the ring.
Details of the layout, design and performance of the tagger detectors and of the forward detector array used to view np scattering events from the secondary target are provided in Ref. Pet2004 . Here, we summarize the salient features briefly. The tagger included an array of four 6.46.4 cm2 DSSD’s with 480 m readout pitch in two orthogonal (,) directions, each followed by a silicon pad (“backing”) detector (BD) of the same area. The DSSD’s were positioned about 10 cm away from the center of the gas jet production target. Each DSSD had 128 and 128 readout channels. Readout was accomplished with front-end application-specific integrated circuits (ASIC’s) that provided both timing and energy information Pet2004 . The timing signals provided to external electronics consisted of the logical OR over groups of 32 adjacent channels of leading-edge discriminator signals based on fast shaped and amplified analog signals generated in the ASIC’s. The timing signals available from logical pixels for each DSSD permitted operation of the tagger in a self-triggering mode, where the time-consuming digitization of slow pulse height signals from all 1024 DSSD channels could be initiated by logic based solely on the tagger hit pattern, as reconstructed from the fast timing signals. This self-triggering was critical to the determination of precise absolute cross sections, because it allowed acquisition of data to count directly the flux of tagged neutrons that did not interact in the secondary target or in any of the forward detectors.
Only recoil protons that stopped either in the DSSD’s ( MeV) or BD’s ( MeV) were considered in the data analysis, because for these the tagger provided a measurement of total kinetic energy with good resolution. By combining these energy measurements with position measurements for both recoil protons, we were able to determine the energy and angle of each tagged neutron, within their broad distributions, with respective resolutions of keV and 2 mrad. As part of this determination, we reconstructed the longitudinal origin () of each produced neutron within the extended GJT density profile with a resolution of 2 mm, by comparing neutron momentum magnitudes inferred by applying energy conservation (independent of vertex position) vs. vector momentum conservation (dependent on vertex position) to the tagger information for the two recoil protons. Similar resolution was obtained for the transverse coordinates at which each tagged neutron impinged upon a secondary scattering target (TGT in Fig. 2) positioned 1.1 m downstream of the GJT.
Two solid secondary targets were used during the production running: a cm3 slab of polyethylene (CH2) containing hydrogen atoms/cm2 and a graphite target of known density machined to have identical transverse dimensions and the same number of carbon atoms per unit area. Each target thickness was determined to by weighing. Data were collected in 18-hour cycles, comprising 6 hours of running with the CH2 target, followed by 6 hours with C and 6 more hours with CH2. The frequent interchange of the targets facilitated accurate background subtractions. Both targets intercepted neutrons over an approximate production angle range of , and cuts were generally placed on the tagger information during data analysis to confine attention to tagged neutrons that would hit the secondary target. Such tagged neutrons were produced at a typical rate of 200 s-1, leading to typical free np back-scattering (angle-integrated) rates 1 s-1 from the CH2 target.
Protons emerging from the secondary target were detected in a forward array of plastic scintillators for triggering and energy information, and a set of (three-plane) multi-wire proportional chambers (MWPCs) for tracking, as indicated in Fig. 2. The plastic scintillators included large upstream veto (LUV) and small upstream veto (SUV) counters to reject charged particles produced upstream of the secondary target. The E scintillator was separated from the secondary target by a MWPC to permit easy discrimination against np scattering events initiated in that scintillator. The rear hodoscope comprised 20 plastic scintillator bars Geneva of sufficient thickness (20 cm) to stop 200 MeV protons and give 15-20% detection efficiency for 100-200 MeV neutrons. All forward detectors were rectangular in transverse profile, with the rear MWPC and hodoscope spanning a considerably larger vertical than horizontal acceptance. The entire forward array provided essentially 100% () geometric acceptance for np scattering events initiated at the CH2 target for angles (). For c.m. angles forward of 90∘ the large size and significant neutron detection efficiency of the hodoscope provided a small efficiency for detecting forward-scattered neutrons in coincidence with larger-angle protons that fired at least the first two MWPCs.
The tagger and forward detector array were designed to facilitate a kinematically complete double-scattering experiment with a first target giving negligible energy loss. With the same apparatus, a similar measurement of pp scattering was possible simultaneously. For this purpose one could use the tagger to detect a single large-angle recoil deuteron instead of two recoil protons, in order to tag a secondary proton beam via pd elastic scattering in the GJT. By requiring a coincidence between a single hit in the tagger and a signal from the small upstream veto scintillator (SUV in Fig. 2), we could define a secondary proton beam of very similar transverse dimensions to the tagged neutron beam. Another scintillator (Veto2) placed just in front of the rear hodoscope allowed us to distinguish, at trigger level, between protons from pd elastic scattering that traversed the forward array without further nuclear interactions and protons that scattered out of this secondary beam in material following SUV. In the present paper, we discuss only the former group, as their yield provides an accurate relative normalization of runs taken with the CH2 vs. C targets.
The triggered events of interest for the present analysis were recorded in four mutually exclusive event streams, three for tagged neutron candidates (consistent with two distinct tagger hits and no accompanying signals from LUV or SUV) and one for tagged proton candidates (consistent with a single tagger hit in prompt coincidence with both LUV and SUV). The trigger logic defined these event streams as follows: (1) tagged neutrons with no rear hodoscope coincidence, providing a prescaled (by a factor of 20) sample for neutron flux monitoring; (2) scattering candidates for which a tagged neutron was in coincidence with signals from both the E scintillator and the rear hodoscope; (3) tagged neutrons in coincidence with the hodoscope but not with the E scintillator, a sample used for evaluating the neutron detection efficiency of the hodoscope Pet2004 ; (4) tagged protons in coincidence with both the E and Veto2 scintillators, providing a prescaled (by a factor of 10) sample including pd elastic scattering events from the GJT, used to cross-normalize C and CH2 secondary target runs. The total flux of tagged neutrons intercepting the secondary target was determined from a sum over event streams (1)+(2)+(3), while comparative analyses of the three streams facilitated crosschecks to calibrate the system Pet2004 and aid understanding of potential systematic errors.
III DATA ANALYSIS
III.1 Cuts and conditions on tagged neutron beam properties
The general philosophy of the data analysis was to define properties of the tagged neutron beam by identical cuts applied to event streams (1)-(3), so that associated systematic uncertainties would cancel in the yield ratios from which the absolute np scattering cross section is extracted. Among these common cuts, described in more detail below, were ones to remove BD noise contributions correlated among the four quadrants of the tagger, to identify the recoil particles detected in the tagger, and to divide the tagged neutron events into subsamples for subsequent analysis. Additional cuts defined a fiducial range for the tagged neutron’s predicted transverse coordinates at the secondary target (9.5 cm and 9.5 cm), and selected prompt tagger two-particle coincidences ( ns, where is the arrival time of the recoil proton with the larger (smaller) DSSD energy deposition). Software cuts applied to event stream (2) alone to identify free np scattering events were kept to a minimum in order to avoid complicated systematic errors. We relied instead on the accuracy of the background subtractions, which could be verified to high precision. Before application of cuts, additional MWPC requirements were added in software to amplify the hardware definitions of the various triggers. Thus, at least one hit in the -plane and at least one hit in the -plane were required for each of the three MWPC’s for events from stream 2.
III.1.1 Particle identification
The correlation of DSSD vs. BD energy depositions was used to select two basic event classes for analysis of each of the three tagged neutron event streams: (a) “2-stop” events, where both protons associated with the neutron stopped inside the DSSD (either the same or different quadrants of the tagger); and (b) “1-punch” events, where one of the protons stopped inside a DSSD and the other punched through to the BD in a different quadrant and stopped there. These two classes, as discussed further below, differ significantly in neutron energy () and position () profiles, allowing an important crosscheck on the accuracy of the tagging technique by comparing np cross sections extracted independently from each class. The 2-stop events were further subdivided according to whether the higher of the two recoil proton DSSD energy depositions () was below or above 5.0 MeV. Protons with MeV range out near the exit of the DSSD, and hence possibly in dead layers at the back of the DSSD or front of the BD, making this event class subject to somewhat greater ambiguity regarding complete recoil proton energy reconstruction and accuracy of the predicted value for the tagged neutron. Events where both protons punched through to the BD’s, or where either punched through the BD itself, were not included in the analysis because they corresponded to below the range of interest.
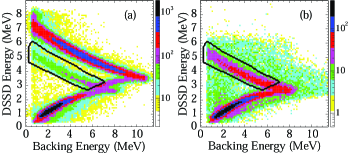
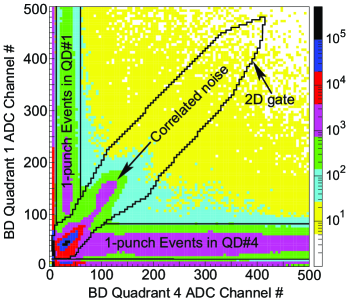
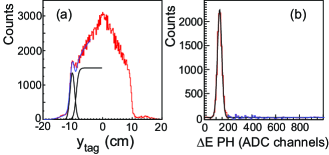
Figure 3 shows raw spectra for both tagged neutrons (event stream 1 in frame (b)) and tagged protons (event stream 4 in frame (a)) of the energy deposited in a typical DSSD quadrant vs. that in the companion BD when the latter is non-zero. The tagged proton events exhibit clear recoil proton (lower) and deuteron (upper) particle identification loci, while only the proton locus remains for tagged neutron events. The loci bend backwards when the detected particle begins to punch through the BD. The two-dimensional gate (dark boundary) shown in each frame was used to select recoil protons that enter and stop inside the BD, e.g., to identify the 1-punch tagged neutron events. Note that the most intense region along the proton locus, corresponding to deuteron breakup events with an energetic large-angle proton, is thereby eliminated. So are events lying off the proton locus, where the backing detector response may be corrupted by noise or pileup.
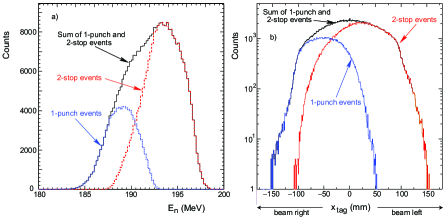
Figure 4 shows the reconstructed and distributions for the tagged neutrons in the 2-stop (for all values of ) vs. 1-punch samples. While the two samples yield overlapping distributions, it is clear that the 1-punch events correspond on average to lower-energy neutrons at larger production angles (preferentially populating the beam-right side of the secondary target).
III.1.2 Correlated noise in the BD
Special care was taken in the definitions of 1-punch and 2-stop events to minimize effects of substantial detector noise picked up by the large-capacitance BD’s. An important source of this noise was discovered to arise from the initiation of pulse height information readout on the adjacent DSSD front-end electronics Pet2004 . The induced noise was strongly correlated among the four BD’s, as illustrated in Fig. 5. This figure reveals two uncorrelated bands parallel to the and axes, due to 1-punch events in one of the quadrants and low pulse-height noise in the other (the pedestals for each BD appear in ADC channel 10). But one also observes a strong diagonal band indicative of noise correlations between the two quadrants.
Since the noise correlation pattern extends beyond a reasonable software threshold, it was necessary to use a two-dimensional gate, such as that shown in Fig. 5, to bound the noise correlation region. Candidates for valid 1-punch events were then required to: (1) surpass a threshold ADC channel (15) on at least one BD; (2) fall outside the noise correlation gates for all BD pairs; (3) not surpass the BD noise peak (ADC 70) in more than one BD; and (4) fall within the PID gate in Fig. 3 for the appropriate quadrant. These conditions and the complementary ones required for 2-stop events reduced the flux of tagged neutrons considered for subsequent analysis, by removing events with BD pulse height ambiguities, but since they were applied equally to all tagged neutron event streams, they did not introduce systematic errors in the np cross section extraction.
III.2 Corrupted events subtraction
An event misidentification mechanism discovered during the data analysis was attributed to an electronics malfunction in the gating or clearing circuit for the electronics module that was used to digitize the pulse height information for all four BD’s. The effect of the malfunction was to zero out valid BD energy signals for a randomly selected fraction of punch-through events. The effect was seen clearly, for example, in the pd elastic scattering events in stream 4, where a software gate placed on the two-body kinematic correlation between recoil deuteron DSSD energy deposition and forward proton angle could be used to select events in which the deuteron must have stopped in the BD. Roughly 3/4 of these events showed the anticipated BD pulse height, but 1/4 had . In the case of tagged neutrons, the corrupted events were misidentified as 2-stop events and gave systematically incorrect predictions of the tagged neutron trajectory, since some recoil proton energy was lost. However, the availability of full information for the surviving punch-through samples allowed us to emulate the effect and subtract the corrupted events accurately.
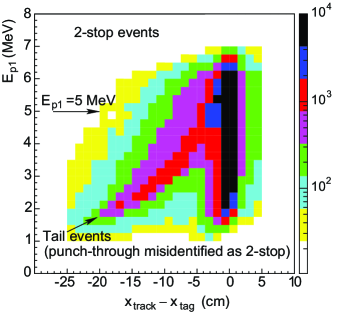
The corrupted events were easily distinguished in event stream 2 by using the MWPC tracking information. Figure 6 shows the correlation for event stream 2 between in the tagger and , where denotes the transverse coordinate of the detected proton from np scattering at the secondary target, as reconstructed from the MWPC hits. The majority of events have , independent of , as expected when both the tagging and tracking are accurate. The corrupted events populate the “tail” to the left of the most intense band, with exceeding by an amount that is strongly correlated with the recoil proton energy deposition in the DSSD: the lower , the larger is the lost and the consequent error in . While the corrupted events could be eliminated from event stream 2 by a software gate within Fig. 6, they could not have been similarly eliminated from event streams 1 and 3, where there was no forward proton to track. Hence, it was essential to find a way to subtract these corrupted events reliably and consistently from all three tagged neutron event streams.
The corrupted events were simulated using all recorded punch-through events that survived with their BD energy information intact, by reanalyzing these events after artificially setting in the software before tagging reconstruction. The distribution shapes of the tail events in Fig. 6 with respect to all variables were accurately reproduced when this simulation was based on all events in Fig. 3(b), both inside and outside the two-dimensional gate drawn, and also including events where both recoil protons punched through their DSSD’s. In order to determine the fraction of these punch-through events that was affected by the electronics malfunction, we relied on a comparison of the subsamples of our simulated events and of the apparent 2-stop events that had valid BD timing information despite having . Because the BD noise problems necessitated high thresholds to generate timing signals, these subsamples populate mostly the far tail in Fig. 6, corresponding to MeV (thus, to relatively large BD analog signals). The corrupted fraction of punch-through events was in this way determined independently for each of the three tagged neutron event streams, and found to be identical for the three, within the statistical precision (typically ) available in matching simulated and recorded corrupted event subsamples. The fraction varied slightly with time during the production run, but averaged 23. The success of this simulation and the persistence of the corrupted fraction across (both tagged neutron and tagged proton) event streams provide strong support for our assumption that the malfunction affected a random sample of punch-through events. Because the fractional loss of 1-punch events to this corruption was independent of event stream, there was no residual systematic effect on the extracted 1-punch cross sections, but rather only a slight loss of statistical precision.
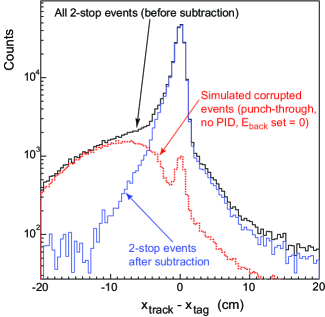
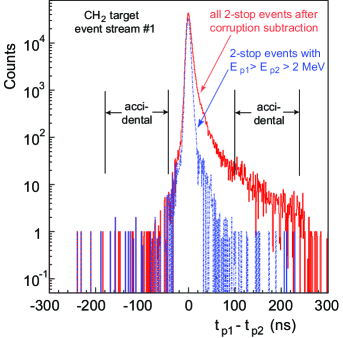
Figure 7 shows a comparison of the spectrum for all 2-stop events in stream 2 with the simulated corrupted sample, normalized as described above via the subsample with valid BD timing signals. The subtraction eliminates essentially completely the corrupted events with MeV, or cm, leaving a reasonably symmetric small background (discussed further in Sec. V.1.5) at cm. We therefore assume that the subtraction is similarly successful for event streams 1 and 3, where we have no tracking information to compare, and associate a systematic error for the subtraction (see Sec. V.2.2) that reflects only the uncertainty in the normalization scheme for the simulated corrupted events.
For 5.0 MeV, there is a remaining tail of small extent in the subtracted spectrum in Fig. 7 that arises not from the electronics malfunction, but rather from recoil protons that barely punch through the DSSD, while depositing insufficient energy in the BD to be distinguished from noise. Because of these events, we have separately analyzed the 2-stop samples with 5.0 MeV and 5.0 MeV. For the latter sample, after subtracting simulated corrupted events, we used a two-dimensional software gate on Fig. 6 to eliminate events in stream 2 that had potentially distorted information, thereby rejecting 18% of 2-stop 5.0 MeV events (as opposed to the 23% of all 2-stop events in stream 2 that were affected by the corruption). The yields of 2-stop 5.0 MeV events in streams 1 and 3 were then scaled down by the same 18%, to remove the remaining events of questionable 2-stop pedigree.
The small peak at in the simulated background in Fig. 7 indicates that a small fraction of the punch-through event sample used in the simulation really corresponds to true 2-stop events that were misidentified by virtue of BD noise that evaded the noise cuts discussed in the preceding subsection. Subtracting this small fraction of valid 2-stop events along with the simulated corrupted events has the effect of reducing the 2-stop tagged neutron yield by in all three event streams, with no significant consequence for the absolute cross sections extracted from the 2-stop sample.
III.3 Background subtraction
The background events for this experiment came mostly from np quasifree scattering off carbon nuclei in the CH2 target. However, there were also some prominent sources displaced from the secondary target, including: (1) protons coming directly from the gas jet production target, or from the exit flange on the Cooler beam magnet chamber (see Fig. 2), that evaded the veto scintillators due either to their imperfect coverage or electronic inefficiencies; (2) np scattering events induced either on the downstream scintillator face or the Lucite light guide for the SUV, yielding pulse heights below that veto detector’s threshold; and (3) quasifree np scattering induced on the vertically narrow (but longitudinally thick) aluminum frame used to support the secondary target. By frequently interchanging the CH2 target with a graphite target closely matched in transverse dimensions and in areal density of carbon nuclei, we were able to subtract the backgrounds from all sources simultaneously. The relative normalization of the CH2 and C runs was determined from the pd elastic scattering yield from the GJT, as recorded in event stream 4 Pet2004 . The background subtraction was determined to be sufficiently reliable that we could avoid imposing many kinematic cuts, with potentially significant systematic ambiguities, to define free np scattering events.
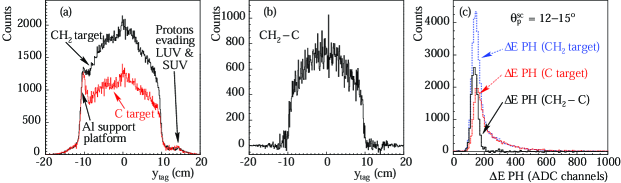
The accuracy of the background subtraction can be judged, for example, from Fig. 8, which presents CH2 and C spectra, and their difference, with respect to (the vertical impact position of the neutron on the secondary target, as reconstructed from the tagger) and scintillator pulse height within a narrow np scattering angle range. These two particular variables have been chosen for display in the figure because the CH2 spectra show prominent background features associated both with quasifree scattering (the long high pulse height tail in ) and with other sources (the cm peak from the aluminum support frame). Both sources are precisely eliminated by the background subtraction. Indeed, upper limits on the surviving remnants of these features allow us (as described in Sec. V.2.1) to reduce the systematic uncertainty for the background subtraction even below the level given by the precision of the measured C/CH2 target thickness ratio ().
III.4 Free scattering cuts
Software conditions imposed only on event stream 2 to distinguish free-scattering from background events have the potential to remove free-scattering yield in sometimes subtle ways. They were thus used in the analysis only when they could substantially reduce the statistical uncertainties (i.e., by suppressing background to be subtracted) without introducing significant systematic uncertainties in correcting for the free-scattering losses, or when such losses were judged to be inevitable to remove ambiguities in the analysis. The accuracy of the C background subtraction provided a reliable method to judge the extent of any free-scattering event removal.
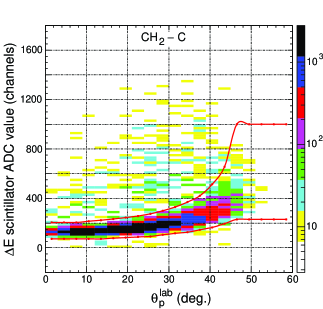
The most effective such cut applied was placed on the correlation of forward proton energy loss in the scintillator with the laboratory angle of the proton trajectory. The applied two-dimensional software gate is superimposed on the observed distribution of events following CH2 - C subtraction in Fig. 9. This distribution reveals that very few free-scattering events were removed by this gate, but it is clear from the long tail seen in the projected unsubtracted spectrum for one angle bin in Fig. 8(c) that a substantial number of quasifree background events, leading to lower-energy outgoing protons, were successfully removed.
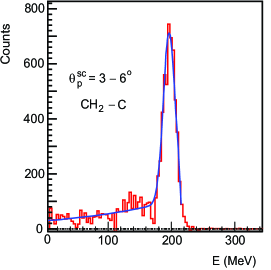
In contrast, we did not apply a comparable cut on the energy deposition of the forward proton in the rear hodoscope, where it generally stopped, despite an appreciable difference in the distributions of hodoscope energy between free and quasifree events. The reason for avoiding this cut is illustrated in Fig. 10: the free-scattering spectrum revealed by the C subtraction exhibits a quite substantial low-energy reaction tail in addition to the well-defined full-energy peak. An unacceptably large systematic error would have been introduced by the need to correct for loss of these reaction tail events, if we had imposed a cut on hodoscope energy to suppress background.
A benign cut imposed for slight background reduction placed an upper threshold on the value obtained for a linear track fit to the reconstructed MWPC space points. The CH2 - C subtraction indicates that only of free-scattering events were removed by this condition. More serious (6.3% of total CH2 - C yield), but unavoidable, losses were introduced by cuts confining the tagging and tracking information in event stream 2 to agree within cm and cm. These limits correspond to of the narrow Gaussian resolution function that dominates these distributions in the CH2 - C spectra. Nonetheless, the cut eliminates events in long distribution tails that are affected either by tagging errors or sequential reactions of the tagged neutron, which introduce serious ambiguities in interpretation. This cut, and its consequence for systematic uncertainties, will be discussed further in Sec. V.1.5.
Finally, it is worth mentioning one additional cut that we chose not to impose. The transverse np vertex coordinates are, in fact, determined by the tagging and tracking with considerably better resolution than implied by the mm value mentioned in the preceding paragraph Pet2004 . This latter value is dominated by the thickness of the secondary target, simply reflecting the uncertainty in precise longitudinal origin of the np scattering vertex. Much better information is, in principle, available by locating the vertex in three dimensions at the point of closest approach of the neutron trajectory reconstructed from the tagger and the proton trajectory reconstructed from the MWPC’s. Distributions of such reconstructed secondary vertex coordinates Pet2004 permit tagged neutron radiography of the background sources displaced from the CH2 target. However, any cuts to remove such background sources in this manner would be affected by the strong dependence of the reconstructed vertex resolution on the proton scattering angle (vertex information clearly deteriorates as the neutron and proton trajectories approach collinearity). We decided to rely completely on the C subtraction to remove such other sources of background, in order to avoid consequent angle-dependent free-scattering event losses.
III.5 Acceptance
The lab-frame proton scattering angle is determined for each analyzed event as the opening angle between the neutron trajectory reconstructed from the tagger and the forward proton trajectory reconstructed from the MWPC’s. The geometric acceptance of the forward detector array for np scattering events is a function of both and the coordinates of the scattering vertex at the secondary target. Because the distribution of scattering vertex coordinates, especially of (see Fig. 4), differed among the three analyzed data subsamples (1-punch, 2-stop with MeV, and 2-stop with MeV), the acceptance had to be evaluated separately for each subsample. This was done by comparing simulated to measured distributions of events with respect to azimuthal angle within each bin, for each data subsample.
The simulations were constrained to reproduce the measured distributions of the longitudinal production vertex coordinate of the neutron within the GJT (common to all three data subsamples) and its transverse coordinates on the secondary target (separately for each subsample). Within these distributions, coordinates were generated randomly for each event, as were also (in the range 0–75∘) and (over the full azimuthal range). Generated outgoing proton trajectories were then accepted if they would yield signals above the hodoscope pulse height threshold (required in trigger) and in all three MWPC’s (required in the data analysis). Forward detector location parameters were tuned slightly from their measured values to optimize the fit of the simulated to the measured distributions for all bins and for 1-punch and 2-stop samples simultaneously.
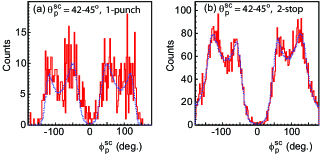
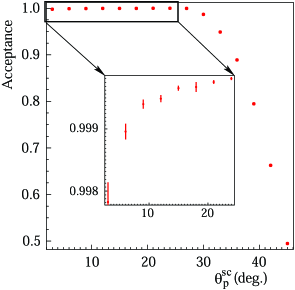
The high quality of the fits obtained is illustrated in Fig. 11 for the 1-punch (a) and 2-stop (b, summed over all ) samples for a single large angle bin, =42-45∘, where the observed azimuthal distributions display considerable structure. The structure reflects the rectangular shape of the hodoscope and large MWPC, projected onto space: e.g., the four peaks observed correspond to the four detector corners. The small changes in distribution between the 1-punch and 2-stop samples – e.g., in the relative heights of the peaks and in the extent of the dips near (beam left side) and 180∘ (beam right) – arise from the shift in profiles seen in Fig. 4. These features are all reproduced very well by the simulations. For , the measured and simulated distributions are essentially uniform over 2, indicating full acceptance. Figure 12 shows the simulated acceptance for the 1-punch data sample as a function of . The 0.2% shortfall from full acceptance near 0∘ reflects protons incident normally on the small cracks between adjacent hodoscope elements. Results presented in the next section are limited to the angle range for which the acceptance is at least 50%; at larger proton angles the uncertainty in acceptance grows rapidly.
IV RESULTS
The absolute differential cross section for np back-scattering was extracted independently for three data samples – 1-punch, 2-stop with 5 MeV, and 2-stop with 5 MeV – from the yields of event streams 1, 2 and 3 as follows:
| (1) |
where represents the number of free-scattering events from stream 2 within a given reconstructed proton angle bin, surviving all relevant cuts and background subtractions; and in the denominator represent analogous tagged-neutron yields from the mutually exclusive event streams 1 (corrected for prescaling), 2 (angle-integrated) and 3; the represent small corrections, summarized in Table 1 with details in section V, for various inefficiencies, tagged neutron losses or backgrounds, and software cut and dead time differences among event streams; H atoms/cm2 for the CH2 target; and is the azimuthal acceptance determined from simulations for the given angle bin. The data were analyzed in 1 MeV wide slices of reconstructed neutron energy from 185 to 197 MeV and an effective cross section extracted at the mean neutron energy of 194.00.15 MeV. For this purpose, a small (always ) cross section correction was made for the deviation of each analyzed slice from the mean energy, using the theoretical energy- and angle-dependence calculated with the Nijmegen PWA93 solution Sto1993 .
| Source | Correction Factor (ci) | Uncertainty in ci |
|---|---|---|
| Accid. tagger coinc. | 1.0003 | 0.001 |
| Non-D2 tagger | 1.0067 (2-stop); | 0.002 |
| background | 1.0044 (1-punch) | |
| n pos’n unc. on CH2 | 1.0000 | 0.001 |
| n atten’n before CH2 | 1.005 | 0.0025 |
| Sequential react’ns | 1.063 | 0.010 |
| & (n) errors | ||
| C bkgd. subtraction | 1.0000 | 0.004 |
| H in C target | 1.000 | 0.004 |
| Corrupted event | 1.000 | |
| subtraction | ||
| Software cut losses | 1.010 | 0.005 |
| Reaction tail losses | 1.004 | 0.002 |
| Neutron polarization | Angle-dependent: | 0.001 |
| effects | (1-punch) | |
| (2-stop) | ||
| CH2 tgt. thickness | 1.0000 | 0.004 |
| np scattering | 1.0000 | (120∘) |
| acceptance | (90∘) | |
| MWPC inefficiency | 1.017 | 0.002 |
| Trigger inefficiency | 1.002 + 0.008 | [0.001 + 0.004 |
| cos2() | cos2()] | |
| Dead time diffs. | 0.991 | 0.005 |
| Scattering angle | 1.000 | angle-dependent, |
| errors | 0.004 | |
| Net, typical |
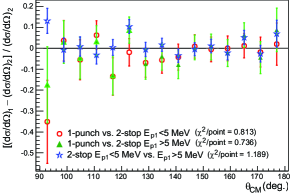
The cross sections for the three data subsamples, with their independently determined absolute scales, are mutually consistent in both magnitude and angular shape, within statistical uncertainties, as revealed by the comparisons in Fig. 13. The figure shows the relative difference, , between pairs of cross sections for the three data samples. The reduced value for the comparison of each pair of samples is indicated in the legend of Fig. 13. This comparison supports the reliability of the experiment and analysis, because these samples come from complementary regions of the tagged beam spatial and energy profiles (see Fig. 4) and are subject to somewhat different systematic error concerns. We view the agreement in absolute cross section scale as particularly significant demonstrations of the accuracy of the neutron profiles reconstructed from tagging and of the subtraction procedure applied to remove corrupted events from the 2-stop sample (see Sec. III.B). Cross sections extracted for different time periods within the production runs, and with different sets of cuts, are also consistent within uncertainties.
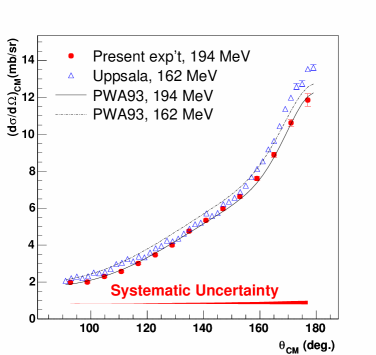
The results, averaged over all three data samples, are compared in Fig. 14 with previous experimental results at 162 MeV Rah1998 and with the Nijmegen partial wave analysis (PWA93) at the two relevant energies nij . The measured points are plotted at the yield-weighted centroid angle of each analyzed bin. The comparison of the present results with previous experiments and with partial wave analyses will be discussed in detail in Sec. VI, after first describing the nature and evaluation procedure for each of the systematic uncertainties included in Table 1.
V SYSTEMATIC ERRORS
Most of the individual correction factors applied to the extracted cross sections, and their associated systematic uncertainties listed in Table 1, have been evaluated via complementary analyses of the data. In this section we briefly describe the procedures used and error estimates for each, being careful to distinguish uncertainties that affect only the overall cross section normalization from those with appreciable angle-dependence. In the latter cases, we also characterize the degree of correlation among the uncertainties at different angles, to facilitate inclusion of the uncorrelated systematic errors in PWA’s including the present data. For purposes of logical flow, we organize the discussion into four categories: (1) tagged neutron flux uncertainties; (2) np backscattering yield uncertainties; (3) target thickness, acceptance and efficiency uncertainties; and (4) errors in determining the kinematic variables.
V.1 Tagged neutron flux uncertainties
The sources below contribute to uncertainties in extracting the angle-integrated yields
N1,2,3 in Eq. (1), dominated by the non-interacting tagged neutrons
in event stream 1. All of the issues discussed in this subsection give rise to overall
(angle-independent)
normalization errors in the differential cross sections.
V.1.1 Accidental tagger coincidences
Accidental coincidences between two uncorrelated particles detected in the tagger contribute slightly to the apparent tagged neutron flux on the secondary target, leading to an underestimate of the cross section. The accepted events in all three event streams passed a cut on the time difference between the two tagger hits, as indicated in Fig. 15. The correction factor was determined from the ratio of events in stream 1 that passed all other cuts defining the tagged neutron beam but fell within one of two displaced time windows, ns and ns, to the yield in the prompt coincidence window ns. The resulting correction factor is , with an uncertainty , showing that accidental coincidences were a minor issue for the experiment.
V.1.2 Tagger background from non-D2 sources
Additional possible background contributions to the tagged neutron flux could arise from real (correlated) two-particle coincidences in the tagger, generated by proton beam interactions with nuclei heavier than deuterium in material displaced from the GJT. This possibility was checked via runs where H2 was substituted for the D2 in the GJT, to induce similar beam “heating” without any real possibility of tagged neutron production (since the proton beam energy was far below pion production threshold for the p+p system). A correction factor for 1-punch (2-stop) events was determined from the ratio of accidental-subtracted tags satisfying the tagged neutron conditions with the H2 vs. D2 production targets. The statistical uncertainties in these ratios were considerably smaller than ; the quoted uncertainty is intended to allow for the possibility of slight systematic differences in beam heating, hence in the rate of interactions with displaced material, between the two GJT gases.
V.1.3 Impact position uncertainty on the CH2 target
This is the first of several error sources we consider that arise when a properly tagged neutron does not reach the CH2 (or C) secondary target, or reaches it at a significantly different position than expected from the tagging. Because of the finite (several mm) impact position resolution from the tagger, some tagged neutrons predicted to hit the secondary target may actually miss it, while some predicted to miss the target may hit it. Especially near the target edges, where the yield of np scattering events drops rapidly and nonlinearly as a function of impact position, this resolution smearing can affect the extracted cross sections. In practice, however, we observe no statistically significant difference in cross section normalization between the independent event samples from the bulk of the target ( cm and cm) and from a 5.0-mm wide strip ( cm or cm) surrounding this core. From this comparison and the fraction of all events arising near the target edges, we infer a correction factor .
V.1.4 Neutron attenuation before the CH2 target
Some tagged neutrons fail to hit the secondary target, leading to an underestimate of the extracted np cross section, as a result of interactions they undergo upstream of that target. Approximately 3.5% of 200 MeV neutrons will undergo an inelastic reaction of some sort in the upstream material NASA1997 , which is dominated by the 0.29 cm thick stainless steel vacuum window at the exit of the Cooler’s 6∘ magnet vacuum chamber, the 0.64 cm thick LUV plastic scintillator, and the 0.64 cm thick SUV plastic scintillator (the first two of these traversed at an incidence angle ). However, many of these “pre-scattering” neutrons give rise to charged products that get vetoed by LUV or SUV (and hence do not contribute to the tagged flux) or are removed by the C subtraction as apparent np scattering events from an upstream source. Others yield an energetic neutron or proton, not strongly deflected from the original tagged neutron trajectory, that still strikes the nearby secondary target with a chance to induce a tertiary interaction there, and so might still be considered as part of the incident flux.
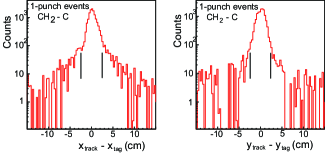
We may judge the rate of such tertiary interactions from events where a forward proton emerges from the secondary target at a transverse location () substantially different (by much more than the tagging position resolution effect considered in Sec. V.1.3) from the predicted impact position of the tagged neutron (). Such tertiary interactions introduce their own problems in the analysis, to be addressed separately in the next subsection. Here, we study them in order to place limits on the probability of larger-angle upstream scattering, which yields no chance of a tertiary scattering. In Fig. 16, we show the difference spectra for and for 1-punch events (to eliminate ambiguities from the corrupted 2-stop events seen in Fig. 6) after CH2 - C subtraction (to eliminate ambiguities from np scattering induced on material displaced from the secondary target). The narrow Gaussian resolution peaks sit atop a broad background that has important contributions from these tertiary interactions.
By fitting the background in Fig. 16 with a broad Gaussian, and assuming that the probability of initiating a scattering in the secondary target is roughly the same for the pre-scattered neutrons as for the bulk of the tagged neutrons, we estimate that 0.5% of tagged neutrons may be pre-scattered through a sufficiently large angle to cause a transverse displacement greater than 10 cm (i.e., half the target width or height) on the secondary target. We use this estimate to infer a correction factor for tagged neutron pre-scattering flux losses before the CH2 target. The uncertainty we assign to is intended to account for non-prescattering origins of the background in Fig. 16 (e.g., tagging errors or sequential reactions within the CH2 or tertiary scattering of a forward proton in material following the CH2 target) and for possible upstream neutron interactions that elude the above analysis.
V.1.5 Sequential reactions in the secondary target or upstream material
Here we deal explicitly with the events contributing to the broad backgrounds in Fig. 16 and in the analogous distributions for 2-stop events. From the behavior of these events and the differential cross sections we extract specifically from them, we judge them to correspond primarily to valid free np scattering in CH2 either following an earlier interaction of the tagged neutron or preceding a later interaction of the forward proton. The two interactions will in some cases both have taken place within the CH2 target. Some of the background may also arise from tagging errors associated with less than complete energy collection for the recoil protons in the tagger. Regardless of their detailed source, such events are distorted because we mismeasure the scattering angle and possibly the incident neutron energy for the free np scattering.
The least biased way to handle these events is to eliminate them from the analyzed sample. This is simple enough to do for each angle bin in event stream 2, via the software cuts requiring and , where cm and cm are the widths of the narrow Gaussian peaks in Fig. 16. However, we have no access to analogous cuts for event streams 1 and 3, where there is no MWPC information. Hence, we must correct the extracted cross section for our inclusion of tagged neutron flux that is associated with such eliminated sequential reaction events. The correction factor is the largest single correction and systematic uncertainty we apply. The value assumes that the 6.3% of event stream 2 (CH2 - C) yield (averaged over 1-punch and 2-stop samples and over scattering angle) removed by these sequential reaction cuts arises from 6.3% of the tagged neutron flux. (The actual correction factors applied differ for the three data samples, reflecting differences in the fraction of events removed by these cuts.) The uncertainty allows for errors in this assumption, for example, because it neglects the energy-dependence of the np scattering probability in the CH2 target.
V.2 Uncertainties in absolute np backscattering yields
Analysis issues in the extraction of the free-scattering yield needed in Eq. 1 can lead, in principle, to angle-dependent errors. We thus specify for each case below whether the estimated uncertainty should be considered as angle-dependent and as uncorrelated from angle bin to bin.
V.2.1 Uncertainties in background subtraction via the C target
As described in Sec. III.3, we relied heavily on the CH2 - C subtraction to remove simultaneously backgrounds due to quasifree scattering from carbon nuclei in the secondary target and to reactions induced on displaced sources. The precision of the subtraction depends on that of our knowledge of the relative target thicknesses and integrated neutron flux exposures for the CH2 vs. C runs, and on the stability of beam conditions between the two sets of runs. The relative normalization, taken from cleanly (kinematically) identified pd scattering yields measured simultaneously, is determined with quite high statistical precision but could, in principle, deviate systematically from the more relevant ratio of tagged neutron yields. The overall precision of the relative normalization was judged from the extent to which scattering events from the aluminum target platform (see Fig. 8(a)) were successfully removed by the C subtraction. We concentrate first on this background source because its yield is not sensitive to the CH2/C target thickness ratio.
The reconstructed distributions in the vicinity of the aluminum platform peak, for both CH2 and C targets (see Fig. 8), could be well reproduced by the sum of a Fermi distribution and a polynomial, to represent the bottom target edge, and a Gaussian to represent the aluminum peak. The fit for the CH2 is shown in Fig. 17(a). An analogous fit was then carried out for the C-subtracted spectrum in Fig. 8(b), fixing the positions and widths of the Gaussian and Fermi-function contributions to their common values for CH2 and C. The ratio of events in the Gaussian peak after subtraction to that before subtraction is , providing one measure of the accuracy of the background subtraction.
An independent measure was provided for each np scattering angle bin by the fraction of high energy-loss tail events that survive the subtraction in pulse-height spectra (see Fig. 8(c)). The tail events were integrated by summing all counts at values more than 4 above the center of a Gaussian fitted to the free-scattering peak, as illustrated in Fig. 17(b). For the three largest bins studied, this approach breaks down because the free-scattering peak develops a substantial Landau tail and is no longer well reproduced by a Gaussian shape. But for all (12) smaller-angle bins, the ratio of tail events after to before C subtraction fluctuates about zero, with a weighted average over angle bins of . This measure is sensitive to the target thickness ratio as well as to the relative flux normalization for CH2/C. The two measures combined do not give compelling evidence of a need for any correction, and are conservatively summarized by associating with the C subtraction an angle-independent correction factor .
The uncertainty estimated in this way also subsumes two other potential sources of systematic error. One is accidental coincidences between a real tagged neutron and an uncorrelated forward-going proton emerging from the GJT or the Cooler beam pipe (the most abundant sources of protons). To the extent that such coincidences passed all our cuts, they might have contributed to for the CH2 target. However, since these accidentals are independent of the presence or nature of the secondary target, they would be subtracted via the C target measurements. The second effect concerns possible proton attenuation before the hodoscope, which is required as part of the event stream 2 hardware trigger. The dominant material between secondary target and hodoscope that might have served as a source of such proton losses is the scintillator, where tertiary interactions should cause abnormal energy loss. Since the uncertainty estimate includes allowance for such abnormal pulse heights in carbon-subtracted spectra, it should also include such proton attenuation effects.
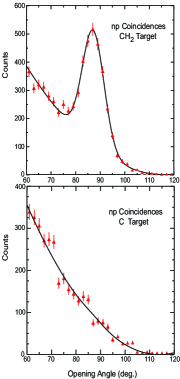
One further potential complication with the background subtraction could have arisen if there had been any appreciable hydrogen buildup on the graphite target used for the subtraction, a possibility limited by the hydrophobic nature of graphite. In this circumstance we would subtract some small fraction of the valid free-scattering events, and thus would introduce an effective overall normalization error in the hydrogen target thickness used in Eq. 1. To estimate this effect we considered np scattering events forward of , where event stream 2 contained some coincidence events, with a forward-scattered neutron detected in the hodoscope and the larger-angle proton detected in the scintillator and (at least) the front two MWPCs. The angle of the proton was determined from MWPC ray-tracing, while that of the neutron was deduced from the hodoscope elements fired and from the position inferred from the time difference between hodoscope phototubes mounted at the two ends of each element Pet2004 . The opening angle spectrum reconstructed for such np coincidence events exhibited a clear free-scattering kinematic peak for the CH2 target, but only the Fermi-smeared and acceptance-limited angular correlation characteristic of quasifree scattering for the C target (see Fig. 18). Figure 18 includes fits to the distributions for both targets based on the sum of a quadratic background and a Gaussian free-scattering peak, with the peak location and width fixed for the C target to the values determined from CH2. The fit for C is statistically consistent with no hydrogen content in the graphite target, with a 1 limit on the hydrogen thickness of 0.4% that of the hydrogen in CH2. We thus apply a cross section correction factor for hydrogen in the C target.
V.2.2 Uncertainty in subtraction of corrupted events
For the 2-stop event stream, we followed the procedure described in Sec. III.2 to subtract the punch-through events that had been corrupted by the electronic loss of backing detector pulse height information. There is no evidence for any systematic deviation in distribution shapes between the corrupted sample and our simulation of this sample using valid recorded punch-through events. Thus, the only uncertainty we consider is that in the normalization of the simulated sample to the corrupted events in stream 2. The normalization factors were determined from fits for the subsample of corrupted events that had valid backing detector timing signals, and the uncertainty in these normalization factors was then deduced from the change in normalization factor that caused an increase of unity in the overall value for the fit. The effect of this normalization uncertainty on the extracted 2-stop cross sections was typically , and is negligible in comparison with other systematic errors. Hence, we assign a correction factor with uncertainty to the subtraction of corrupted events.
V.2.3 Losses via software cuts
The efficiency of software cuts applied to event stream 2, but not to streams 1 and 3, was judged by comparing the ratio of cross sections obtained, after CH2 - C subtraction, for all events failing vs. satisfying a given cut. The most important of these cuts were on (see Fig. 9) and on and . The latter cuts were already dealt with in Sec. V.1.5. (Another cut, on the quality of track fits, is treated together with wire chamber inefficiencies below.) The cut limits were somewhat tighter than the 4 allowance used in estimating background subtraction accuracy (see Sec. V.2.1). We found the ratio of background-subtracted events failing/satisfying the cut to be 1.0%, averaged over all event streams and angles. There is no evidence for any significant angle-dependence in this loss, but there are strong enough fluctuations in the losses from angle to angle or event stream to event stream that we assign a uncertainty to the losses. We thus apply a corresponding, angle-independent correction factor . With this systematic uncertainty, application of the cut still reduced the overall cross section error bars slightly because the quasifree background to be subtracted decreased significantly.
V.2.4 Reaction tail losses beneath the hodoscope energy threshold
Since we did not use any software cuts on energy deposition in the rear hodoscope, we avoided the large corrections that would have been needed to account for protons lost to nuclear reactions in this hodoscope (see Fig. 10). However, if the reaction is sufficiently severe that the deposited energy falls below the hodoscope hardware threshold, then the event will have been lost in hardware to a trigger inefficiency. To estimate these potential losses, we fit the hodoscope energy spectra after CH2 - C subtraction to the sum of a Gaussian and an exponential (reaction) tail, as shown in Fig. 10. The tail was extrapolated to zero energy deposition, and the ratio of yields below to above threshold (typically set at 5–10 MeV proton energy) was thereby estimated. The loss below threshold was found to be quite consistent with 0.4% for each scattering angle bin, so that we again have applied an angle-independent correction factor .
V.2.5 Neutron polarization effects
While the stored proton beam in the Cooler was unpolarized for this experiment, the neutron production reaction selected neutrons scattered to one side of the beam (beam right) at about in the laboratory frame. At this angle, the D(p,n) charge exchange reaction that dominates our tagged beam production has a small polarization, so that the beam neutrons would have been slightly polarized vertically (perpendicular to the horizontal production plane). The magnitude of this effect is P, where the minus sign indicates that for neutron production to the right of the cooled proton beam, the neutron spin points preferentially downward at the secondary target. The tagged neutron polarization can then give rise to a left-right asymmetry in np scattering events:
| (2) |
Measurements and phase shift solutions at intermediate energies nij show the np scattering analyzing power, Anp, to be a strong function of scattering angle, but with magnitude no larger than 0.12 over the angle range of interest for the present experiment. The factor reflects the fact that it is only the component of the vertical neutron polarization perpendicular to the scattering plane for a given np event that matters.
Since the scattering yield is simply redistributed between scattering toward the left and the right, there would be no effect at all on cross sections measured with a fully left-right symmetric forward detector array. Thus, the only residual polarization effect changes the measured yield by a fraction:
| (3) |
where is the fractional detector acceptance (determined from fits such as those in Fig. 11) in the specified angle bin. The sign convention used here is that positive implies that we observe a higher event stream 2 yield than we should in the corresponding bin, necessitating a correction factor .
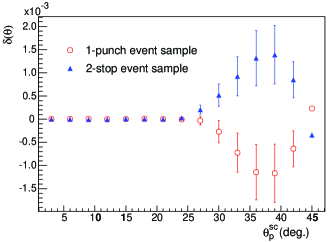
Figure 19 shows the distribution calculated for 1-punch and 2-stop data samples from Eq. 3, taking from Nijmegen PWA93 calculations nij . We find for both samples at all angles , because the detector has full azimuthal acceptance in that region. The small corrections have opposite sign, and hence tend to cancel, for the two samples at larger angles because the 2-stop events preferentially populate the left side of the secondary target, while the 1-punch events originate mostly on the right (see Fig. 4). The latter difference is reflected in their respective functions (see Fig. 11) used in Eq. 3.
While the np analyzing power and the forward detector acceptance functions are well determined in this experiment, we assign a significant uncertainty to the average tagged neutron polarization, , to account for contributions from production mechanisms other than charge exchange. There is correspondingly a uncertainty assigned to each value of in Fig. 19, but these errors are completely correlated from one angle bin to another and are strongly correlated between 2-stop and 1-punch data samples. The largest net uncertainty from neutron polarization after the (separately corrected) 1-punch and 2-stop results are combined is , and so we conservatively assign an angle-independent uncertainty of to .
V.3 Target thickness, acceptance and efficiency errors
V.3.1 CH2 target thickness uncertainty
The overall normalization uncertainty associated with in Eq. 1 was determined to be (i.e., ) from careful weighing of the CH2 target used. Because the target only sat in a secondary neutron beam of low flux, there should not have been any appreciable deterioration in the target during the length of the run, nor was any visually evident.
V.3.2 Acceptance uncertainty
The acceptance uncertainty was determined independently for each angle bin by varying the most critical one or two detector geometry parameters used in the simulations (see Fig. 11) from their best-fit values until the overall value for the simulated vs. measured distribution in that angle bin increased by unity. Because the optimized values of per degree of freedom for the different angle bins and event samples were statistically distributed about 1.14, rather than 1.00, we multiplied these acceptance changes by a uniform factor of 1.07 to arrive at final systematic uncertainties. The acceptance uncertainty is strongly angle-dependent, varying from at , where , to at , where . With this evaluation method, we consider the estimated uncertainties to be largely uncorrelated from angle bin to bin.
V.3.3 Wire chamber efficiencies
The MWPC’s were not used at all in forming a hardware trigger, but in software event reconstruction we required at least one hit registered in each of the x and y planes, for chambers 1, 2 and 3, plus a value below an upper threshold for fitting these hits to a straight line track. Thus, the overall MWPC efficiency to use in extracting absolute cross sections is:
| (4) |
The efficiency of each MWPC plane was determined from tracks reconstructed without the benefit of the plane in question, based on the fraction of such tracks that produced a hit on this plane in the immediate vicinity of the reconstructed crossing point. Each of the first six factors in Eq. 4 was found to exceed 0.99 and was determined with an uncertainty . Their product is .
The factor was determined by estimating the number of free-scattering events removed from the analysis by the cut. This was done by examining spectra for individual angle bins, following carbon subtraction, for events that failed the fit quality test. The number of free-scattering events (and its uncertainty) in each such spectrum was extracted by fitting Gaussian peaks of the same position and width as those used for the normal spectra, such as Fig. 17(b). There was no indication in these analyses that any of the factors in Eq. 4 varied with position on the MWPC’s, or therefore with scattering angle. The overall wire chamber efficiency correction is thus an angle-independent .
V.3.4 Trigger inefficiencies
Inefficiencies in detectors used to form the hardware trigger lead to loss of events in an unrecoverable way. Possible tagger inefficiencies do not matter here, because they lead to loss of the same fraction of events from streams 1, 2 and 3, and hence do not affect the cross sections determined from ratios of event yields in these streams. The two detectors used to form the hardware trigger for event stream 2, but not for stream 1, are the scintillator and the rear hodoscope. The former was viewed by four phototubes, at least three of which were required to give signals surpassing threshold in the trigger logic. In the data analysis, we were able to determine for each scattering angle bin the ratio of reconstructed free-scattering events that had only three vs. all four phototubes above threshold. We then estimated the trigger inefficiency under the conservative assumption that the ratio of free-scattering events with two or fewer phototubes firing to those with three firing would be the same as the determined ratio of events with three to four firing. (Some illuminated locations on the scintillator lacked a direct line of sight to one or another, but never simultaneously to two, of the four phototubes.) The resulting inefficiency appears to show a systematic angle-dependence, roughly represented by , i.e., the inefficiency grows as the pulse height shrinks.
We have considered two different types of potential hodoscope trigger inefficiencies. Problems in an individual hodoscope element or phototube would show up as an inefficiency localized in and , and therefore as a deviation of the measured -distribution for some angle bins from the simulated acceptance function. Any such localized trigger-level inefficiencies should thus be subsumed in the acceptance uncertainty calculation mentioned above.
However, an electronic inefficiency in the modules forming the hodoscope trigger logic could have caused equal fractional losses in all angle bins. A limit on this inefficiency was estimated from event stream 4 (observing tagged protons from the GJT), which included the Veto2 scintillator directly in front of the hodoscope, but not the hodoscope itself, in the trigger logic. We found that of these triggered events were not accompanied by hodoscope signals above threshold in both relevant phototubes, of which 0.4% have already been accounted for as reaction tail losses below threshold (see Sec. V.2.4).
Combining the above effects, the overall correction factor for trigger inefficiencies has been taken as . The angle-dependent part of the uncertainty here is intended to accommodate observed fluctuations in the inferred trigger efficiency, and is viewed as largely uncorrelated among different angle bins.
V.3.5 Dead time differences among event streams
Triggers in all event streams were blocked electronically at an early stage in the event trigger logic by a common busy signal reflecting electronic readout or computer processing activity in any of the event streams. To first order, then, the different streams should have a common dead time ( for typical running conditions), and the dead time should cancel in the event stream ratios from which cross sections are deduced (see Eq. 1). However, this cancellation is imperfect, as revealed by ratios of scaler values recording the number of tagged neutron vs. tagged proton candidates before and after busy-vetoing. Typically, fewer neutron tags survived the veto, and this was traced to the occurrence of bursts of electronic noise triggers from the tagger. While the loss of these noise triggers should not have directly depleted the valid sample of any event streams (i.e., (2)-(4)) that required other detectors in coincidence with the tagger, it did reduce the number of valid events recorded in the neutron flux stream (1), because all raw neutron tags, whether valid or not, contributed equally to the countdown of a (divide by 20) prescaler used for this stream. To compensate for this loss of neutron flux events, we have to reduce the extracted cross sections at all angles by a factor . The uncertainty in this correction allows for possible model-dependence in our interpretation of the live-time difference inferred from the scaler ratios.
V.4 Errors in Determination of Kinematic Variables for np Scattering
V.4.1 Neutron energy errors
As explained in Sec. IV, the data were analyzed in narrow neutron energy slices, with each result then being corrected slightly in order to extract a final overall cross section at the single mean energy of 194.0 MeV. There is an overall scale uncertainty in the tagged neutron energies that we estimate to be keV, with roughly equal contributions from the energy of the stored primary proton beam in the Cooler and the energies extracted from the tagger for the low-energy recoil protons. The stored beam energy (202.46 MeV) is based on the precisely measured rf frequency (1.96502 MHz) and the Cooler circumference, which has been previously calibrated Ste2003 to better than 1 cm out of 87 m, translating to keV. In the “coasting” (rf off) mode used for data taking, the beam energy is maintained by interactions with the cooling electrons, and this may increase the beam energy uncertainty to keV. The energy scale of the recoil protons is calibrated by analysis of 228Th -source spectra measured with the tagger Pet2004 , and its keV uncertainty arises predominantly from thickness uncertainties for detector dead layers, combined with the quite different corrections for energy loss in the dead layers needed for protons vs. the calibration -particles.
The energy scale uncertainty could be translated into a consequent cross section uncertainty as a function of angle by using Nijmegen PWA93 calculations to evaluate
| (5) |
Although this systematic error can be angle-dependent, the values at different angles would still be completely correlated, since the neutron energy scale will be off in the same direction for all angles. Hence, we prefer to not include this effect in the cross section uncertainties, but rather to quote the measured cross sections as applying at a mean neutron energy of MeV.
V.4.2 Scattering angle errors
A systematic error in determination of the centroid np scattering angle within a given analyzed bin is equivalent to an error in the measured differential cross section:
| (6) |
where the angular derivative of the cross section can be taken, for example,
from Nijmegen PWA calculations nij . In evaluating , we
consider the contributions from uncertainties in the neutron
incidence angle on target deduced from the tagger and in the angle
of the outgoing proton through the MWPC’s:
| (7) |
where the averages are evaluated over the full free scattering event sample, over the transverse coordinates of the scattering origin on the secondary target, and over all scattering angles. Consistent values were extracted for the 2-stop and 1-punch samples.
The angle uncertainties were estimated within cm2 pixels in as half the mean event-by-event difference between angles reconstructed by two different approaches. In the case of one method utilized tagger information only to predict the neutron trajectory, while the second considered instead the straight line from the neutron production vertex on the GJT, inferred from the tagger, to the intersection of the reconstructed forward proton track with the secondary target. For we used proton tracks reconstructed with MWPC geometry parameters that were either (i) optimized to minimize the overall value for tracks, or (ii) adjusted to increase overall by unity. A yield-weighted average of the results over all target pixels gives mrad and mrad.
The cross sections were not corrected for potential systematic angle errors, but we extract from Eq. 6 net systematic uncertainties of for , for and for . Because the extracted incidence angle differences (between the two methods described above) exhibit sizable fluctuations from one target pixel to another, or from one angle bin to another, we view these estimated uncertainties as uncorrelated from angle bin to angle bin.
V.5 Summary of angle-dependence
The effect of the correction factors associated with the various sources of systematic error considered in this section is cumulative, and averages 1.10, with small variations with angle and data sample, as summarized in Table 1. We assume, however, that the various uncertainties are uncorrelated with one another, and we add them in quadrature to obtain final systematic error estimates. The majority of error sources we have considered are explicitly or effectively angle-independent; when combined, these yield an overall normalization uncertainty of . The uncertainties associated with our measurements of acceptance and scattering angle, and with trigger inefficiencies, are considered angle-dependent and uncorrelated from point to point. These three sources are combined to give the net point-to-point systematic uncertainties in Table 2, where we also collect our final absolute cross section measurements obtained from a weighted average over the three independently analyzed and corrected data samples (1-punch, 2-stop with MeV and 2-stop with MeV). The point-to-point and normalization uncertainties combine to give an overall systematic error of in most angle bins.
| c.m. angle | Stat. unc. | Syst. unc.111This column lists point-to-point systematic uncertainties. In addition, there is an overall cross section scale uncertainty of . | |
|---|---|---|---|
| (deg.) | (mb/sr) | (mb/sr) | (mb/sr) |
| 92.7 | 1.98 | 0.06 | 0.03 |
| 98.8 | 2.00 | 0.05 | 0.02 |
| 104.8 | 2.31 | 0.05 | 0.02 |
| 110.8 | 2.57 | 0.05 | 0.02 |
| 116.8 | 3.01 | 0.05 | 0.02 |
| 122.8 | 3.47 | 0.06 | 0.02 |
| 128.8 | 4.01 | 0.06 | 0.02 |
| 134.9 | 4.75 | 0.07 | 0.03 |
| 140.9 | 5.34 | 0.08 | 0.03 |
| 146.9 | 5.98 | 0.08 | 0.04 |
| 152.9 | 6.64 | 0.10 | 0.04 |
| 159.0 | 7.61 | 0.11 | 0.05 |
| 165.0 | 8.89 | 0.14 | 0.06 |
| 171.0 | 10.62 | 0.19 | 0.07 |
| 177.0 | 11.86 | 0.34 | 0.08 |
VI Discussion
The preceding section provided a detailed catalogue of the issues that must be carefully controlled to measure precise absolute cross sections with medium-energy neutron beams. To our knowledge, no previous experiments have attempted a comparable degree of control. The best existing absolute neutron-induced cross section standards at intermediate energies are from attenuation measurements of total cross sections Lisowski , which are not suitable for calibrating neutron fluxes. It is hoped that the present results will provide a new calibration standard. The excellent agreement of our experimentally determined absolute cross section scale with that given by the Nijmegen PWA93 solution (see Fig. 14) confirms the consistency of our results with the total cross section measurements.
The level of agreement of our measurements with PWA’s at MeV is presented in more detail in Fig. 20. Here it is seen that, while the absolute cross section scale of the experimental results is in very good agreement with the Nijmegen PWA93 solution, there is a small systematic deviation in angular shape between the two: our results are higher than PWA93 by 2–3% for and lower by a similar amount for . These deviations considerably exceed our estimated systematic uncertainty in the angle-dependence. In particular, we note that the forward detector acceptance used in the former angle range is already essentially 100% (see Fig. 12), so that the extracted cross section cannot be overestimated by virtue of underestimating acceptance. Furthermore, the results for the three independently analyzed data samples agree extremely well in this angle region (see Fig. 13). We do see a possible small, statistically marginal, systematic deviation among our three data samples in Fig. 13 over the angle region from 100 to 130∘, with the 1-punch cross sections falling on average a few % below those for the two 2-stop event samples. However, even if this difference reflects a real systematic problem, it could only pull the averaged cross section down by less than 0.5% in this region, too small to account for the deviation from PWA93 in Fig. 20.
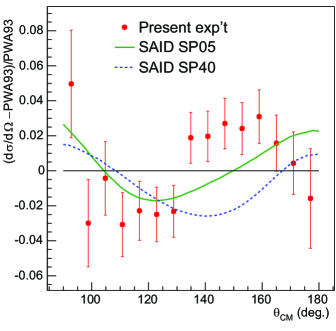
We also show in Fig. 20 the relative differential cross section differences between two recent SAID PWA solutions SAID ; SP40 and the Nijmegen PWA93. The various PWA solutions differ from one another by as much as 2–3% also in the angle region displayed. Furthermore, we note that the SAID solution has shifted by 2% after inclusion of the present results in the fitted np database (even though that inclusion was carried out by adding our full, mostly angle-independent, systematic uncertainties in quadrature with our statistical uncertainties, thereby under-weighting the present data in the fit). We conclude that the deviations between the present results and PWA93 are of the same order as the present uncertainties in the PWA solutions, and most likely point to the need to refit phase shifts. We note, however, that there is a conceptual flaw in the procedures for such refitting to a database where all experiments have systematic uncertainties, but there is considerable variability in the level at which those systematic uncertainties are reported in the literature.
Finally, we address the comparison of the present results with those from the recent experiments by the Uppsala Rah1998 and Freiburg Fra2000 groups, both of which have been rejected from the np database used in the Nijmegen and SAID PWA’s. As illustrated in Fig. 14 by the comparison of the two experimental results with PWA curves at the respective energies of the experiments, the present results deviate systematically from those of Rah1998 in the steepness of the back-angle rise in cross section. These deviations are larger than the differences anticipated from the difference in neutron energy between the two experiments. There is a similar, though not quite as pronounced, systematic deviation of the present results from those of Franz, et al. Fra2000 , shown in Fig. 1.
It is difficult to say definitively whether there might be a common problem that caused excessive cross sections near in both of these earlier, completely independent and quite different, experiments Rah1998 ; Fra2000 . We note only that measurements near , where the solid angle is vanishing, can be tricky with a secondary neutron beam of sizable angular divergence. One of the great advantages of the use of a tagged beam is that we are able in the present experiment to determine the neutron incidence angle event by event. We thereby see that an angle bin near with respect to the central neutron direction in fact includes important contributions from (so that for the bin in Eq. 1 exceeds ), arising from neutrons deviating from the central beam direction. In Fig. 21 we compare the present results with those we would have extracted if we had chosen to ignore the neutron incidence angle information from the tagger in reconstructing the np scattering angle event by event. Such neglect is seen to give rise to a systematic overestimate of the cross section at the largest angles by , comparable to the systematic deviations of the results in Refs. Rah1998 ; Fra2000 from those of the present experiment. (It also leads to a substantial underestimate near , where the yield is falling rapidly with increasing , due to detector acceptance edges.) The effect would differ for different experiments, depending on the angular profile of the neutron beam, including any effects from scattering off collimator edges (the present experiment used no collimators).
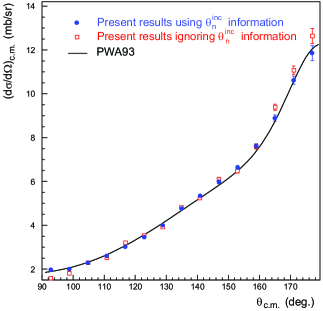
VII Conclusions
A tagged intermediate-energy neutron beam produced at the IUCF Cooler ring has facilitated a measurement of the np scattering differential cross section at 194 MeV bombarding energy to an absolute precision over the c.m. angular range 90∘-180∘. The usage of carefully matched and frequently interchanged solid CH2 and C secondary targets permitted an accurate background subtraction, reducing reliance on kinematic cuts that might have introduced larger systematic uncertainties. The internal consistency in both magnitude and angular shape of the cross sections extracted from independent data samples characterized by substantially different neutron beam spatial and energy profiles supports the accuracy of the tagging technique. Systematic uncertainties in the measurement, affecting both the overall absolute scale of the cross sections and the angular dependence, have been carefully delineated, often via auxiliary measurements and analyses.
The present results are in reasonable agreement with the Nijmegen PWA93 calculation, over the full angular range covered, although there are systematic deviations at the 2–3% level in the angular dependence that might be removed by minor tuning of phase shifts. In contrast, the present results deviate systematically from other recent measurements Rah1998 ; Fra2000 , especially in the steepness of the back-angle cross section rise. Our results thus appear to validate the omission of these earlier experiments from the database used in partial-wave analyses of np elastic scattering, while also suggesting a possible experimental cause of the earlier overestimates of the cross section near . As the back-angle rise is particularly influential in pole extrapolations that have occasionally been used Eri1995 ; PiN2000 to extract the charged pion-nucleon-nucleon coupling constant , the present data also bear on that coupling strength. Since our measurements at the largest angles are consistent with, or even slightly less steep than, the PWA93 solution, a valid pole extrapolation analysis of the present results should yield a coupling constant value no larger than that () extracted from the Nijmegen PWA Ren2001 .
Acknowledgements.
We thank the operations staff of the Indiana University Cyclotron Facility for providing the superior quality cooled beams, and Hal Spinka and Catherine Lechanoine-Leluc for the loan of critical detector hardware, needed for successful execution of this experiment. We acknowledge the U.S. National Science Foundation’s support under grant numbers NSF-PHY-9602872, 0100348 and 0457219.References
- (1) R. Machleidt and I. Slaus, J. Phys. G27, R69 (2001).
- (2) D.R. Entem and R. Machleidt, Phys. Rev. C68, 041001 (2003).
- (3) S.C. Pieper and R.B. Wiringa, Annu. Rev. Nucl. Part. Sci. 51, 53 (2001); P. Navratil and W.E. Ormand, Phys. Rev. C68, 034305 (2003).
- (4) http://lux2.phys.va.gwu.edu/analysis/nn_analysis.html
- (5) V. Stoks ., Phys. Rev. C48, 792 (1993).
- (6) M.C.M. Rentmeester, R.G.E. Timmermans and J.J. deSwart, Phys. Rev. C64, 034004 (2001).
- (7) J. Rahm ., Phys. Rev. C57, 1077 (1998).
- (8) W. Hürster ., Phys. Lett. B90, 367 (1980).
- (9) J. Franz, et al., Phys. Scripta T87, 14 (2000).
- (10) B.E. Bonner ., Phys. Rev. Lett. 41, 1200 (1978).
- (11) D.V. Bugg and R. Machleidt, Phys. Rev. C52, 1203 (1995).
- (12) T.E.O. Ericson et al., Phys. Rev. Lett. 75, 1046 (1995).
- (13) Proc. Workshop on Critical Issues in the Determination of the Pion-Nucleon Coupling Constant, ed. J. Blomgren, Phys. Scripta T87 (2000).
- (14) M.C.M. Rentmeester et al., Phys. Rev. Lett. 81, 5253 (1998).
- (15) T.E.O. Ericson et al., Phys. Rev. Lett. 81, 5254 (1998).
- (16) R.A. Arndt, I.I. Strakovsky and R.L. Workman, Phys. Rev. C52, 2246 (1995).
- (17) T. Peterson ., Nucl. Instr. and Meth. A527, 432 (2004).
- (18) S.E. Vigdor, et al., Phys. Rev. C46, 410 (1992).
- (19) J. Sowinski, et al., Phys. Lett. 199B, 341 (1987).
- (20) T.W. Bowyer, Ph.D. Dissertation, Indiana University (1994, unpublished).
- (21) M. Sarsour, et al., Phys. Rev. Lett. 94, 082303 (2005).
- (22) R.E. Pollock, Annu. Rev. Nucl. Part. Sci. 41, 357 (1991).
- (23) A. Ahmidouch,et al., Nucl. Instrum. Methods Phys. Res., Sect. A326, 538 (1993).
- (24) http://nn-online.sci.kun.nl/NN/
- (25) NASA Technical Paper 3656 (1997) (http://techreports.larc.nasa.gov/ltrs/PDF/1997/tp/NASA-97-tp3656.pdf).
- (26) E.J. Stephenson, et al., Phys. Rev. Lett. 91, 142302 (2003).
- (27) P.W. Lisowski, et al., Phys. Rev. Lett. 49, 255 (1982); V. Grundies, et al., Phys. Lett. 158B, 15 (1985); W.P. Abfalterer, et al., Phys. Rev. C63, 044608 (2001).
- (28) R.A. Arndt, I.I. Strakovsky and R.L. Workman, Phys. Rev. C62, 034005 (2000).