GABRIELA : a new detector array for ray and conversion electron spectroscopy of transfermium elements.
Abstract
With the aid of the Geant4 Monte Carlo simulation package a new detection system has been designed for the focal plane of the recoil separator VASSILISSA situated at the Flerov Laboratory of Nuclear Reactions, JINR, Dubna. GABRIELA (Gamma Alpha Beta Recoil Investigations with the Electromagnetic Analyser VASSILISSA) has been optimised to detect the arrival of reaction products and their subsequent radioactive decays involving the emission of – and –particles, fission fragments, – and X–rays and conversion electrons. The new detector system is described and the results of the first commissioning experiments are presented.
keywords:
Recoil separators; Decay tagging spectrometer; Alpha, gamma-ray, and conversion electron spectroscopy at recoil separators; GEANT Monte Carlo simulations;PACS:
, 23.60.+e , 27.80.+w , 29.30.Dn , 29.30.Kv, , , , , , , , , , , , , , , , , , ,
1 Introduction
The heaviest elements provide a unique laboratory to study nuclear structure
and nuclear dynamics under the influence of large Coulomb forces and large
mass ().
The stability of nuclei beyond the spherical “doubly–magic”
208Pb () decreases rapidly until the transfermium region
() where a lowering of the level density of single-particle states
for nuclei in the neighbourhood of the deformed doubly–magic
Hs reverses this trend locally [1]. However,
the position of the spherical doubly-magic nucleus beyond 208Pb remains
controversial : recent calculations predicting 114, 120, or, 126 for the
next magic proton shell, and 172 or 184 for neutrons
[2, 3, 4].
Among other things, this is a consequence of the treatment
of the spin-orbit splitting. At large values of a weakening of the
spin-orbit splitting is predicted [5, 6] which results in the
lowering of orbitals with , .
The magnitude of this effect can either create or destroy stabilising gaps
in the single-particle spectrum. For example, in various models
the gap predicted at depends highly on the and
proton spin–orbit splitting.
It is therefore crucial to determine the relative
excitation energies of these single-particle states in the
transfermium region [7] to reduce the
extrapolation required in predicting the position of
this “island of stability” for the very heaviest nuclei [8].
Recent reviews can be found in Refs. [9, 10].
Beyond Einsteinium (Z=99) detailed spectroscopic data is sparse. In both 256Fm [11] and 255Fm [12] ray spectroscopy was performed after the chemical separation of reaction products following the irradiation of 254Es and 253Es targets respectively. Unfortunately further studies using this method are hindered by a lack of suitable targets. Another method to populate the nuclei of interest is via heavy–ion fusion evaporation (HI,xn) reactions. In this case it is the overwhelming background from the predominant fission channel that needs to be addressed. This has been achieved with gas–jet transport systems and in-flight recoil separators. Recently spectroscopic studies in this mass region have seen intense activity in two distinct directions : 1) prompt in–beam spectroscopy at the target position exploiting the recoil decay tagging (RDT) method and, 2) isomeric, and, or, decay spectroscopy at the focal plane of the recoil separator. A number of rotational bands have now been observed using both ray and conversion electron (CE) spectroscopy : 254No [13, 14, 15, 16], 252No [18], 253No [15, 17], 250Fm [19], 251Md [20] and 255Lr [21]. These results and additional unpublished data have been reviewed in [22]. However, focal plane decay studies using coincidence measurements have only been reported for a few transfermium nuclei : 251No [23], 253No [22, 24] and 255Rf [25]. The coincidence, and, CE coincidence decay spectroscopy of 257No [26] presents an interesting development with the re-emergence of gas-jet systems.
In these high Z nuclei the internal conversion becomes an extremely important decay mode since it can compete effectively with gamma decay. This makes it essential to perform electron spectroscopy and is the motivation behind the projects GREAT [27] and BEST, and, the subject of this paper, GABRIELA. In section 2 the salient features of the VASSILISSA set up will be presented. Then, in section 3, the modifications to the experimental set-up needed to perform detailed spectroscopy of excited states in transfermium nuclei are described along with the electronics developments required for the programme. Finally, some experimental results from commissioning runs will be shown to illustrate the performance of the GABRIELA system.
2 The VASSILISSA separator system
In the following section only a brief description of the VASSILISSA separator
will be given. More details can be found in Ref [28, 29].
The principal component of VASSILISSA consists of three electrostatic
dipoles which separate spatially the trajectories of the recoiling nuclei,
multinucleon transfer reaction products, fission fragments and beam particles
by virtue of differences in their energies and ionic charges. An additional
dipole magnet deflects the evaporation residues (ER’s) by 37∘ improving
the background suppression of the scattered beam by a factor of 10 - 50. This
magnet also acts as a mass analyser [30, 31].
Between the magnet and the separator system there is a 2 m thick concrete
wall which provides substantial
shielding from the beam dump. Downstream of the magnet a time-of-flight
measurement is made and the ER’s are then implanted into a 300 m thick,
16–strip, 58 58 mm2 position sensitive Si detector at the focal
plane of the separator (hereafter called the stop detector).
Each strip is position sensitive in the vertical direction
with a resolution of 0.3 - 0.5 mm (obtained from correlations)
and has a typical energy resolution of 20 keV for 5-10 MeV alpha particles.
The subsequent position- and time–correlated alpha decays, characteristic of
the implanted recoils, are also measured in the Si detector. The detection
efficiency for these particles is around 50.
3 GABRIELA
In order to perform gamma–ray and conversion–electron spectroscopy at the focal plane of VASSILISSA a number of modifications were needed. The Monte Carlo simulation code Geant4 [32] has been used as an aid to design an experimental set up with the goal of maximising the efficiency and resolution with a minimum of complexity. The set up is given in more details in the following subsections.
3.1 Stop detector and support
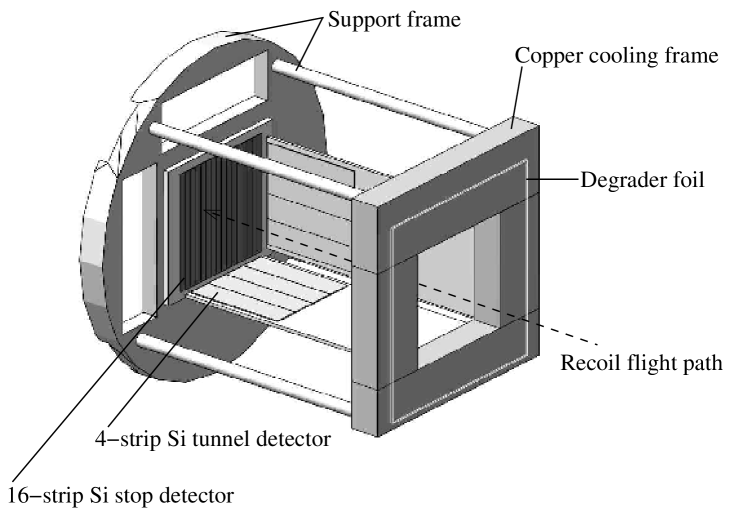
A new detector system, including a new more compact vacuum chamber optimised for transparency to –rays, was constructed to replace the old system which was used to measure alpha decay and spontaneous fission. The new aluminium chamber has a of thickness of 6.5 mm, with the portion in front of the Ge detectors machined down to 2.5 mm, and an inner diameter of 160 mm. The support for the stop detector has been made from a single disc of stainless steel with cut-outs to allow cable connectors, cooling fluid feed–through, and, more importantly, an unobstructed view of the detector from the sides and from upstream. Fig. 1 shows a schematic view.
3.2 Germanium detector array for -ray spectroscopy
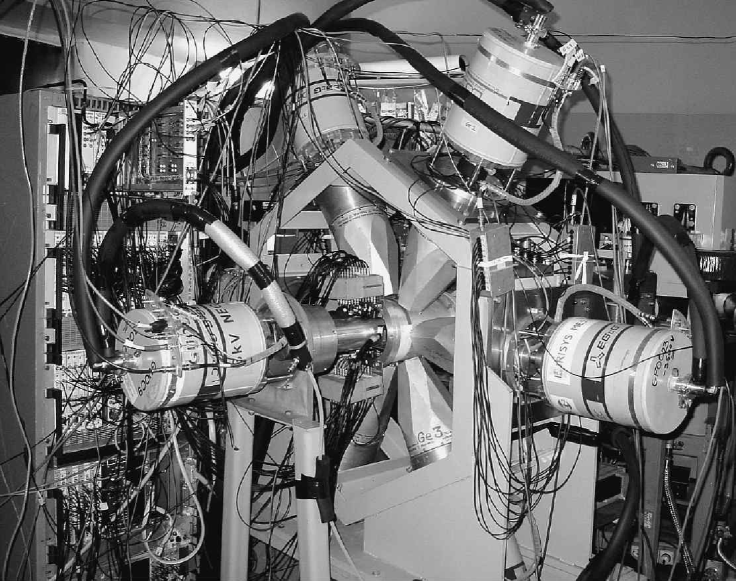
The focal plane stop detector was surrounded by 7 Eurogam Phase-I Ge detectors [33] obtained from the French-UK loan pool. Six of these were placed inside BGO Compton shields and formed a ring around the detector chamber with a focal point on the upstream (backwards) side of the stop detector (see Fig. 2). The distance from the centre of the stop detector to the front face of Ge crystal for these six detectors was about 130 mm. The aluminium back plate that closes the vacuum chamber was designed with an inset to enable the seventh Ge detector to be placed as close as possible to stop detector (about 35 mm). In the hollowed out portion the back plate is only 1.5 mm thick. The suppression shields served two purposes. The first of which is to improve the peak-to-total by vetoing events for which a ray Compton scatters out of the Ge detector which is indispensable for the identification of weak lines which would have otherwise been buried under the Compton background of more intense lines. The second is to reduce the counting rate from background radiation by vetoing events for which rays emitted from the concrete walls (mainly 40K) interact in the germanium detectors. This enables increased “search” times to be used in the hunt for long lived isomers.
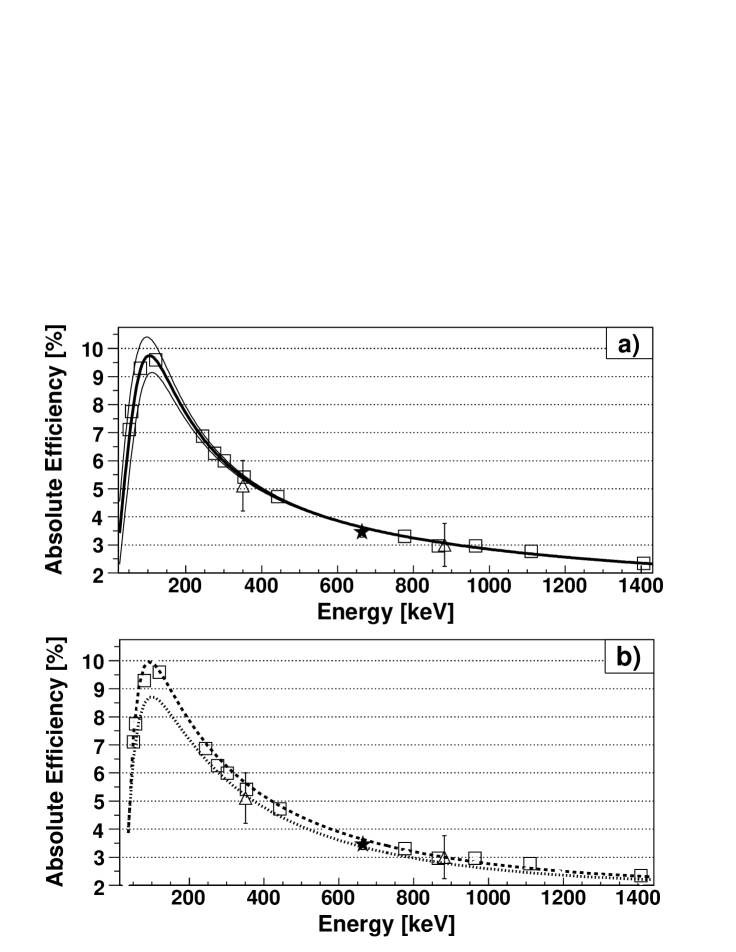
To obtain an absolute efficiency curve for -ray detection 133Ba, 152Eu and 241Am sources of known activities were attached individually to the centre of an old stop detector which was then fixed to the detector support and inserted into the chamber. This permitted calibrations to be taken in conditions as close as possible to those during experimental runs. The sole difference being that the calibrations were performed with a point source, while experimental data is taken with the gamma-ray emitting recoils distributed almost uniformly over the surface of the stop detector. In Fig. 3a the measured –ray photo-peak efficiency from the calibration data is presented.
The reaction 174Yb(48Ca,)222-xTh, which is used primarily for alpha calibration purposes, can provide ray detection efficiency data under experimental conditions. 217Th decays to 213Ra. A fraction of these decays populate excited states in 213Ra which, subsequently, decay to the ground state via emission [34]. From a comparison of the prompt coincidence intensity () with the total singles spectrum () one can determine the ray efficiency after correcting for internal conversion (). That is : . This measurement has also been carried out for the transfer product 211Bi which has fine–structure alpha decay to an excited state in 207Tl. These data, represented by the symbol in Fig.3a, are in agreement with the source data within errors. However, they do appear to indicate an experimental detectection efficiency lower than that taken with calibration sources.
To examine the effect a distributed source has on the efficiency, Geant4 simulations have been performed for various -ray energies with rays emitted into 4 from 1) a fixed point at the centre of the stop detector, and, 2) a uniform distribution over the x-y plane of the stop detector. The deposited energy recorded in the simulations was taken from the secondary electrons which are created by the Compton scattering and photoelectric processes. The results of these simulations are presented in Fig. 3b and indicate that an energy dependent scaling factor of 0.85 – 0.96 is needed to map the point source efficiency onto the distributed source efficiency. In order to obtain the excellent agreement between the measured and simulated efficiency curves every germanium crystal was shifted by 5 mm backwards within its aluminium housing relative to the nominal values given in Daresbury technical drawing A0-36/8813. This minor discrepancy is not that alarming since the precise dimensions and positions for the individual germanium crystals are not known.
For the above Germanium detector measurements new spectroscopy
amplifiers and ADCs (4096 channels,
2 s conversion time) which accept a veto signal were developed
at the Flerov Laboratory. They demonstrated an
excellent stability : during 1 month of measurements the omnipresent 1461 keV
background line from 40K was observed to have a maximum energy shift of
(0.4 keV).
Within the energy range of 81 - 1408 keV the rms deviation
of measured –ray energies compared to standard values [35]
was found to be 0.1-, 0.2-, 0.2-, 0.2-, 0.2-, 0.2- and 0.1 keV
for the 7 Ge detectors and indicates the precision to be expected
in subsequent measurements. At 1332 keV a full width at half maximum (FWHM)
of 2.5 keV was obtained.
3.3 Silicon detector array for conversion–electron spectroscopy
In the backward direction of the stop detector an array of four 4-strip silicon detectors (Canberra PF-4CT-50*50-500RM) are arranged in a tunnel configuration which is shown schematically in Fig. 1. Each detector has a total active area of 50 50 mm2, a thickness of 500 m, a front-face dead-layer thickness of 25 nm Si equivalent, and is mounted on a 1.6 mm thick, 60 120 mm2 IS450 resin board manufactured by ISOLA. The pre-amplifiers (designed by GANIL) for each strip are mounted on the reverse side of this support board which is attached to a copper frame through which cooling fluid can be circulated. Thus the heating effect of the pre-amplifiers can be counteracted and the Si detectors cooled in order to reduce the resolution destroying leakage current.
The Si detectors are used to measure emitted particles escaping from the stop detector : principally conversion electrons, but also, alphas, fission fragments and betas. Due to the tunnel geometry a large proportion of these particles will be detected at small distances upstream from the stop detector. The particles detected in the tunnel close to the stop detector will have suffered more straggling than those detected further upstream because, on average, they have travelled further in the stop detector. Therefore, Geant4 simulations were performed with the tunnel detectors being placed upstream from the stop detector at various distances to evaluate the compromise between the geometrical detection efficiency and spectral resolution. Dead layer thicknesses, support frames and epoxy boards for the silicon detectors and the vacuum chamber were included in the simulation geometry. Electrons were emitted into 4 from an implantation depth of 3.0(5) m distributed uniformly over the x-y plane of the stop detector. The results of these simulations indicate that the effect of straggling has a much smaller effect on the energy resolutions compared to the degredation expected from the leakage current in the detectors and the electronics noise in the system. We have therefore tried to minimise the distance between the stop and tunnel detectors with the nominal distance between the epoxy support boards being about 2 mm.
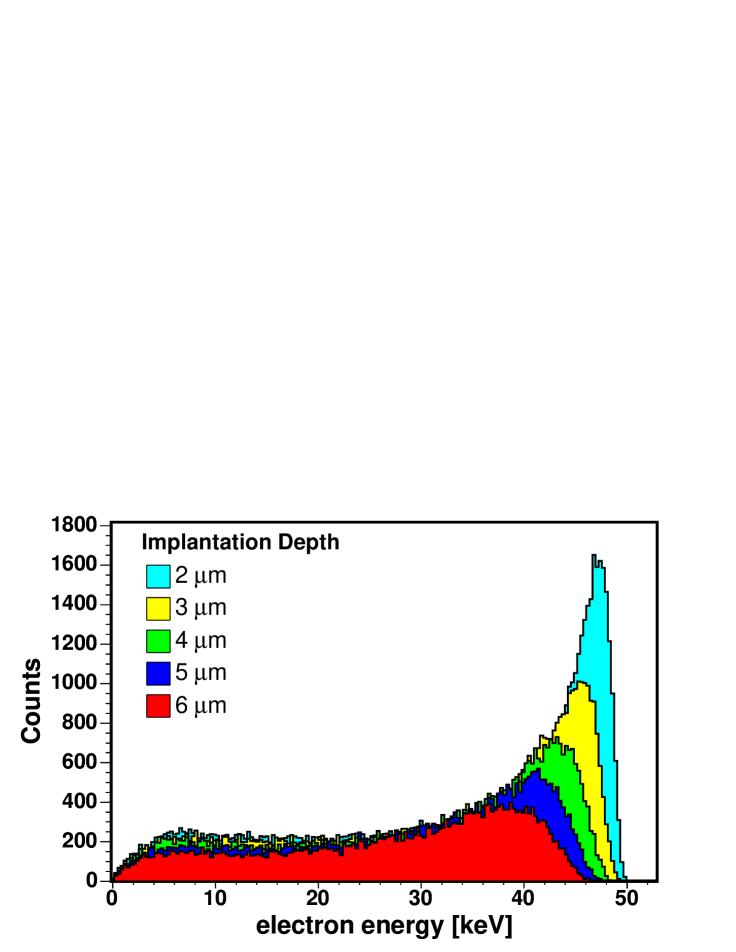
Simulations have also been performed to investigate the efficiency and resolution as a function of recoil implantation depth. Using the geometry described above, with a 2 mm gap between the tunnel and stop detector supports, electrons were simulated to have been emitted from implantation depths of 2.0(5), 3.0(5), 4.0(5), 5.0(5) and 6.0(5) m. The results are given in Table 1 and can be broken into 3 regions : 1) For electron energies above 500 keV the performance of the set up is almost independent of the implantation depth for those depths simulated. 2) For energies between 100 and 400 keV there is a marginal difference in efficiency and a noticeable increase in FWHM with increasing implantation depth. 3) Below 100 keV there is a significant degradation in both the detection efficiency and the resolution. In some simulations the effect of straggling was so large that peaks were no longer discernible and indicates that there is a limit below which one cannot perform electron spectroscopy in the tunnel detectors. This effect can be clearly seen in the simulations for 50 keV electrons shown in Fig. 4. The key to reducing this lower limit as far as possible is by placing a degrader foil in front of the stop detector in order to reduce the implantation depth.
Another important effect visible in Fig. 4, and presented in a more systematic manner in Table 1, is the shift in electron energy measured in the tunnel detectors. An energy calibration of the tunnel detectors must account for this shift. This can be achieved by either correcting unsealed source calibrations for the shifts given in Table 1, or, by implanting into the stop detector recoils known to decay via conversion electron emission and performing an in-beam calibration.
Before performing in-beam experiments initial calibrations with a 133Ba source were performed to align the Si electronics channels. Operating the Si detectors at C energy resolutions of between 8 - 10 keV FWHM were obtained for the 322-keV line, in-line with expectations when noise and leakage current affects are taken into account.
4 Commissioning experiments
To test the new detectors and electronics a series of commissioning experiments were performed using the complete fusions reactions 164Dy(48Ca,)212-xRn, 174Yb(40Ar,)214-xRa and 181Ta(40Ar,)221-xPa at beam energies corresponding to the evaporation of 4 and 5 neutrons.
The first reaction was used to obtain an absolute efficiency measurement for
the tunnel detectors.
In 207Rn a isomer at an excitation energy
of 899 keV decays with a half-life of 181(18) s to an intermediate
state at 665 keV which then decays to the ground state
[36]. This results in a
= M2:234-keV111Where represents either electric
or magnetic radiation and is the multipolarity and E is the transition
energy.
transition followed by an E2:665-keV line. Using coincidence measurements and
singles intensities the following absolute efficiencies can be obtained :
1) , and,
2) , where
represents the intensity observed for the
coincidence measurement between an electron of energy and a
–ray of and is the conversion coefficient. To reduce
the possible contamination from other reaction channels all intensity
measurements were taken in a time range 32s dT 1024s with
respect to the implantation of a recoil in the stop detector. The good
agreement between the germanium array efficiency obtained
from the coincidence, , and the source
measurements shown in Fig. 3a gives us confidence in the absolute
efficiency determined for the tunnel detector which have also been obtained
using the relationship :
,
where, E is either 234- or 665-keV, X is either the K,L or M conversion
electron and
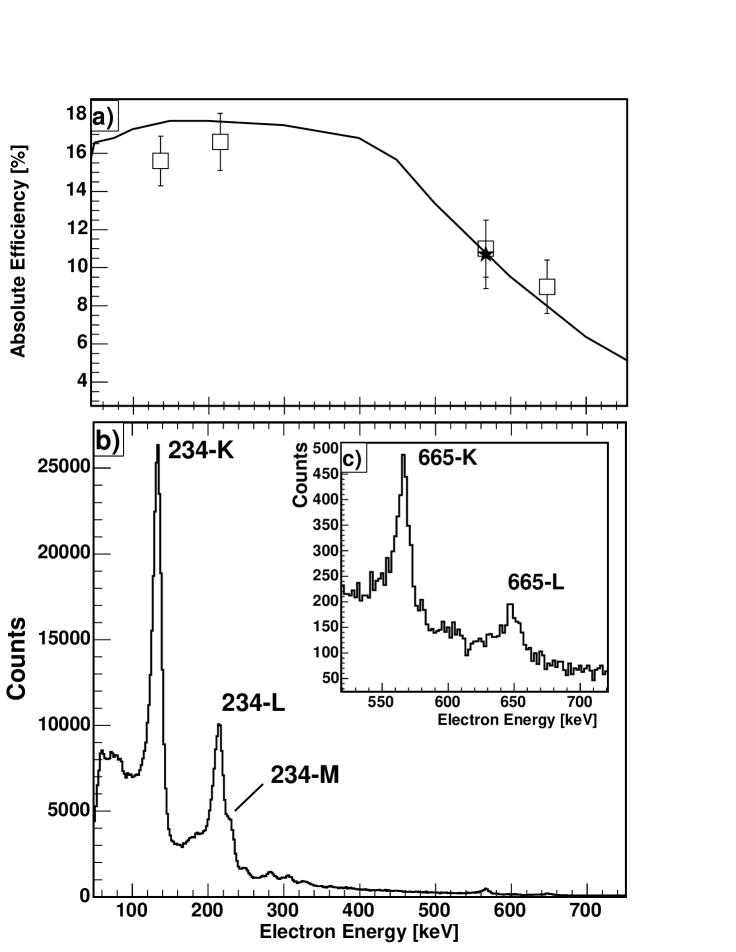
. These absolute efficiencies are presented in Fig. 5a
and are in good agreement with the Geant4 simulations.
In Fig. 5b electron singles spectra are shown as an illustration of the quality of these data. The FWHM of the 234-K line ranges from 9.2-
to 16.1 keV depending on the strip with most of the strips having a FWHM of
10 - 11 keV. The broadening of the lines with respect to the values
quoted in Table 1 can be attributed to the detectors not being
optimally cooled, an increase in noise during the U400 cyclotron operation
and an implantation depth of m for these “low” Z recoils since
the thickness of the degrader used was optimised for the higher Z transfermiums.
As an aside, these data have allowed a more accurate measurement of the half-life of the isomer in 207Rn. was obtained for the 234-K conversion-electron transition using the method described in Ref [37].
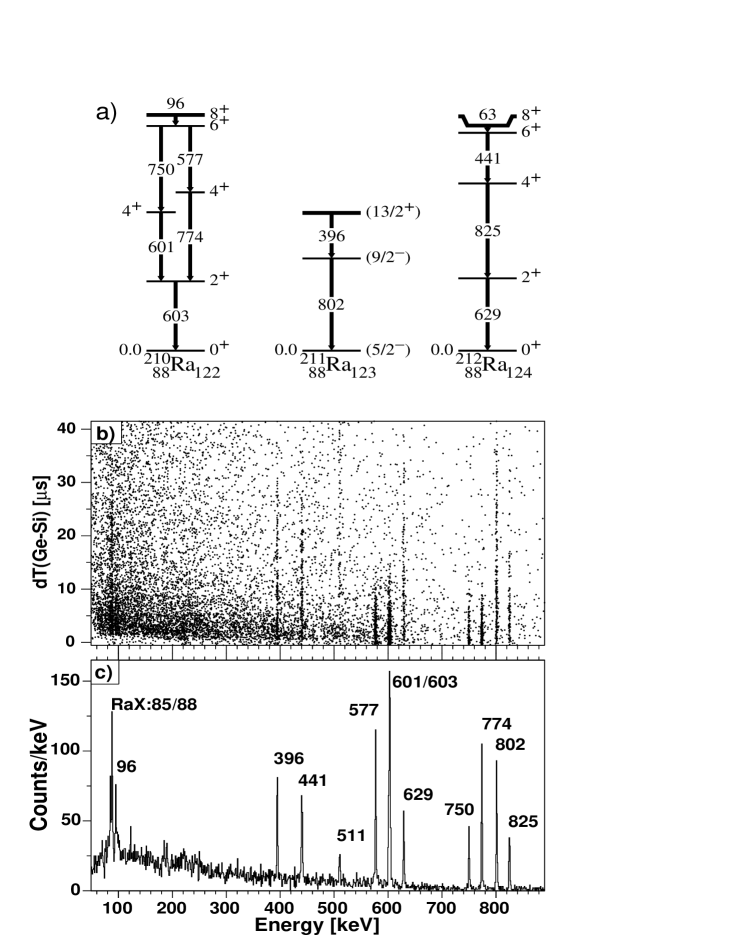
-ray spectra obtained for an unsuppressed detector during the 40Ar + 174Yb 214Ra∗ test run are shown in Fig. 6. The time difference between recoil and -ray detection as a function of measured -ray energy is plotted on an event-by-event basis in Fig. 6b. Different lifetimes for transitions depopulating the different isomeric states are clearly visible. –ray transitions detected within 40 s after the recoil implantation are shown in Fig. 6c. In Table 2 the apparent half-lives of these –rays measured in the current work are given. In view of the agreement obtained for the half-lives of isomers in 210Ra and 212Ra compared to the published values (2.28(8) s cf 2.24, 2.1(1), and 2.36(4) s [38, 39, 40], and 9.1(7) s cf 10.5, 10.9(4) [40, 41], respectively) the discrepancy between our measured value of 9.7(6) s and the value reported in Ref. [40] of 4.0(5) s for the isomer in 211Ra needs independent confirmation.
5 Conclusion and Perspectives
The characteristics of the new GABRIELA detector array have been presented. This array, designed with the aid Geant4 simulations, has been installed at the focal plane of the VASSILISSA separator at the FLNR in Dubna. It has been constructed with the goal of performing detailed spectroscopic studies in transfermium nuclei. Following commissioning tests in May and June of 2004, two one–month–long experimental campaigns were performed in September - October 2004 and October 2005. The complete fusion reactions 48Ca + 207,208Pb 255,256No∗ and 48Ca + 209Bi 255Lr∗ were investigated. The decays of the isotopes 253-255No, 255Lr and their daughter products are currently being analysed.
References
- [1] Z. Patyk and A. Sobiczewski, Nucl. Phys. A 533 (1991) 132.
- [2] S. Cwiok, J. Dobaczeewski, P.-H. Heenen, P. Magieski and W. Nazarewicz, Nucl. Phys. A 611 (1996) 211.
- [3] M. Bender, K. Rutz, P.-G. Reinhard, J.A. Maruhn and W. Greiner, Phys. Rev. C 60 (1999) 034304
- [4] A.T. Kruppa, M. Bender, W. Nazarewicz, P.-G. Reinhard, T. Verste and S. Cwiok, Phys. Rev. C 61 (2000) 034313
- [5] A. Bohr and B Mottelson, Nuclear Structure Vol. 1 (Benjamin, New York, 1969).
- [6] G. Mairle, Z. Phys. A 350 (1995) 285.
- [7] R.R. Chasman, and I. Ahmad, Phys. Letts B 392 (1997) 255.
- [8] A.V. Afanasjev, T.L. Khoo, S. Frauendorf, G.A. Lalazissis, and I. Ahmad, Phys. Rev. C 67 (2003) 024309.
- [9] M. Leino and F. Heberger, Annu. Rev. Nucl. Part. Sci. 54 (2004) 175.
- [10] S. Cwiok, P.-H. Heenen and W. Nazarewicz, Nature 433 (2005) 705.
- [11] H.L. Hall, et al., Phys. Rev. C 39 (1989) 1866.
- [12] I. Ahmad, R.R. Chasman, and P.R. Fields, Phys. Rev. C 61 (2000) 044301.
- [13] P. Reiter, et al., Phys. Rev. Lett. 82 (1999) 509.
- [14] M. Leino, et al., Eur. Phys. J. A 6 (1999) 63.
- [15] P.A. Butler, et al., Phys. Rev. Lett. 89 (2002) 202501.
- [16] R.D. Humphreys et al., Phys. Rev. C 69 (2004) 064324.
- [17] P. Reiter, et al., Phys. Rev. Lett. 95 (2005) 032501.
- [18] R.-D. Herzberg, et al., Phys. Rev. C 65 (2001) 014303.
- [19] R.-D. Herzberg, et al., Proc. Int. Conf. Frontiers of Nuclear Structure (Berkeley, USA, 29 July 2002) AIP Conf. Proc. 656 (2003) 373.
- [20] A. Chatillon, et al., private communication.
- [21] P.T. Greenlees, et al., private communication.
- [22] R.-D. Herzberg, J. Phys. G 30 (2004) R123.
- [23] F.P. Heberger, et al., Eur. Phys. J. A 22 (2004) 417.
- [24] F.P. Heberger, et al., Nucl. Instr. and Meth. B 204 (2003) 597.
- [25] F.P. Heberger, et al., Eur. Phys. J. A 12 (2001) 57.
- [26] M. Asai et al., Phys. Rev. Letts. 95 (2005) 102502.
- [27] R.D. Page, et al., Nucl. Instr. and Meth. B 204 (2003) 634.
- [28] A.V. Yeremin, et al., Nucl. Instr. and Meth. B 126 (1997) 329.
- [29] O.N. Malyshev, et al., Nucl. Instr. and Meth. A 440 (2000) 86.
- [30] A.G. Popeko, et al., Nucl. Instr. and Meth. A 510 (2003) 371.
- [31] O.N. Malyshev, et al., Nucl. Instr. and Meth. A 516 (2004) 529.
- [32] S. Agostinelli, et al., Nucl. Instr. and Meth. A 506 (2003) 250.
- [33] C. Beausang, et al., Nucl. Instr. and Meth. A 313 (1992) 37.
- [34] F.P. Hessberger, et al., Eur. Phys. J. A 15 (2002) 335.
- [35] R.B. Firestone, V.S. Shirley, C.M. Baglin, S.Y. Frank Chu, J. Zipkin, Table of Isotopes (John Wiley Sons, New York, Chicester, Brisbane, Toronto, Singapore, 1996).
- [36] I. Rezanka, I.M. Ladenbauer-Bellis, J.O. Rasmussen, Phys. Rev. C 10 (1974) 766.
- [37] M. Leino, et al., Phys. Rev. C 24 (1981) 2370.
- [38] J.F. Cocks and JUROSPHERE Collaboration, J. Phys. G 25 (1999) 839.
- [39] J.J. Ressler, et al., Phys. Rev. C 69 (2004) 034331.
- [40] F.P. Hessberger, S. Hofmann, I. Kojouharov and D. Ackermann, Eur. Phys. J. A 22 (2004) 253.
- [41] T. Kohno, et al., Phys. Rev. C 33 (1986) 392.
| electron energy | ||||||||||||
| 30 keV | 40 keV | 50 keV | 75 keV | |||||||||
| depth | E | fwhm | E | fwhm | E | fwhm | E | fwhm | ||||
| (m) | (keV) | (keV) | (keV) | (keV) | (keV) | (keV) | (keV) | (keV) | ||||
| 2.0(5) | 4.6 | 8.2(1.3) | 13.8 | 3.2 | 6.3(0.5) | 16.4 | 2.2 | 4.1(1) | 16.8 | 1.5 | 2.7(2) | 17.0 |
| 3.0(5) | 7.8 | 9.1(2.2) | 7.6 | 5.3 | 8.3(1.1) | 14.8 | 3.8 | 6.2(3) | 16.5 | 2.6 | 3.9(3) | 16.8 |
| 4.0(5) | – | – | – | 8.0 | 9.3(0.2) | 11.2 | 5.9 | 8.8(6) | 15.8 | 3.5 | 5.4(5) | 16.7 |
| 5.0(5) | – | – | – | 11.1 | 12(2) | 8.9 | 8.1 | 9.1(8) | 13.1 | 4.7 | 6.6(2) | 16.2 |
| 6.0(5) | – | – | – | – | – | – | 10.7 | 13.6(2) | 10.2 | 6.0 | 8.2(8) | 15.1 |
| 100 keV | 200 keV | 300 keV | 400 keV | |||||||||
| depth | E | fwhm | E | fwhm | E | fwhm | E | fwhm | ||||
| (m) | (keV) | (keV) | (keV) | (keV) | (keV) | (keV) | (keV) | (keV) | ||||
| 2.0(5) | 1.2 | 2.2(1) | 17.3 | 0.7 | 1.4(1) | 17.5 | 0.5 | 1.2(1) | 17.6 | 0.6 | 1.1(1) | 16.9 |
| 3.0(5) | 2.0 | 3.4(1) | 17.1 | 1.3 | 2.3(1) | 17.5 | 1.0 | 2.0(1) | 17.3 | 0.9 | 1.7(1) | 16.8 |
| 4.0(5) | 2.8 | 4.3(4) | 16.6 | 1.8 | 3.0(1) | 17.3 | 1.5 | 2.5(2) | 17.1 | 1.3 | 2.2(2) | 16.5 |
| 5.0(5) | 3.6 | 5.1(3) | 16.3 | 2.3 | 3.5(3) | 16.8 | 1.8 | 3.0(2) | 16.8 | 1.7 | 2.7(2) | 16.4 |
| 6.0(5) | 4.5 | 6.0(6) | 16.0 | 2.8 | 4.0(3) | 16.3 | 2.3 | 3.3(3) | 16.3 | 2.0 | 3.2(2) | 16.2 |
| 500 keV | 600 keV | 700 keV | 800 keV | |||||||||
| depth | E | fwhm | E | fwhm | E | fwhm | E | fwhm | ||||
| (m) | (keV) | (keV) | (keV) | (keV) | (keV) | (keV) | (keV) | (keV) | ||||
| 2.0(5) | 0.4 | 1.1(1) | 13.8 | 0.5 | 1.0(1) | 9.5 | 0.5 | 1.0(1) | 6.3 | 0.4 | 0.9(1) | 4.2 |
| 3.0(5) | 0.8 | 1.6(1) | 13.4 | 0.8 | 1.5(1) | 9.5 | 0.7 | 1.4(2) | 6.2 | 0.7 | 1.3(2) | 4.1 |
| 4.0(5) | 1.2 | 2.1(2) | 13.4 | 1.1 | 1.9(2) | 9.3 | 1.0 | 1.9(2) | 6.2 | 1.0 | 1.7(2) | 4.1 |
| 5.0(5) | 1.5 | 2.5(2) | 13.4 | 1.4 | 2.4(1) | 9.3 | 1.4 | 2.3(2) | 6.1 | 1.3 | 2.2(3) | 4.0 |
| 6.0(5) | 1.9 | 2.8(2) | 13.0 | 1.8 | 2.8(3) | 9.2 | 1.7 | 2.6(3) | 6.2 | 1.6 | 2.5(3) | 4.0 |
| 210Ra | 211Ra | 212Ra | |||
|---|---|---|---|---|---|
| [keV] | [s] | [keV] | [s] | [keV] | [s] |
| 96 | 2.51(31) | 396 | 9.5(8) | 441 | 8.9(9) |
| 750 | 2.57(32) | 802 | 9.9(8) | 825 | 7.7(1.3) |
| 577 | 2.37(17) | 629 | 10.2(1.0) | ||
| 774 | 2.34(17) | ||||
| 601/603 | 2.15(11) | ||||