Search for via reaction near production threshold
Abstract
We have searched for via reaction using 1.87 and 1.92 GeV/c beam at the K2 beam line of the KEK 12 GeV Proton Synchrotron. In the missing mass spectrum at beam momentum of 1.92 GeV/, a bump has been found at 1530 MeV/ which is consistent with the mass reported by several experiments. The statistical significance of this bump, however, is only 2.52.7. Therefore we have derived the upper limit of production cross section via reaction which is 3.9b at 90% confidence level assuming that is produced isotropically in the center of mass system.
aDepartment of Physics, Kyoto University, Kyoto 606-8502, Japan
bKEK, High Energy Accelerator Research Organization, Tsukuba 305-0801, Japan
cPhysics Department, Gifu University, Gifu 501-1193, Japan
dDepartment of Physics, Osaka University, Toyonaka 560-0043, Japan
eDepartment of Physics, Osaka City University, Osaka 558-8585, Japan
fDepartment of Physics, Pusan National University, Pusan 609-735, Korea
PACS: 12.39.Mk; 13.75.-n, 13.75.Gx; 14.20.-c
Keywords: Glueball and nonstandard multi-quark/gluon states, Hadron-induced low- and intermediate-energy reaction and scattering, Pion-baryon interactions, Baryons
1 Introduction
In the constituent quark model, mesons and baryons are described by quark and anti-quark pair and three quarks respectively. Many hadrons known so far are described by this model very well. On the other hand, the existence of exotic baryons such as pentaquark and dibaryon has been suggested theoretically, because QCD requires only that hadrons should be color singlet, but does not restrict the number of quarks [1]. Although many experimental efforts to search for these exotics were made, there was no clear evidence.
It was about 30 years later from the establishment of QCD that the first report about the exotic pentaquark, which is now called , was made by SPring-8/LEPS collaboration [2]. They showed a peak in mass distribution of system via reaction where neutrons in 12C nuclei were used as a target. This discovery stimulated many physicists, and many works have been done from both theoretical and experimental sides. Diakonov et al., using the framework of chiral soliton model, regarded as a member of anti-decuplet which is the third excited state of soliton field and predicted that its mass was 1530 MeV/ and the width was 15 MeV/ by treating the known (1710, 1/2+) resonance as a member of this anti-decuplet [3]. Jaffe and Wilczek proposed diquark-diquark-antiquark nature of in the anti-decuplet plus octet representation of SU(3) [4]. Many other theoretical studies such as constituent quark model, QCD sum rules and lattice QCD were devoted to [5].
Experimentally, the observation at LEPS was immediately confirmed by several experiments [6, 7, 8, 9, 10, 11, 12, 13, 14, 15]. Recently, however, null results were reported from several high energy experiments where they searched for with much higher statistics [16, 17, 18, 19, 20, 21, 22, 23]. Most recently, CLAS collaboration has reported some results of a series of high statistical search for . In [24], was not observed and the upper limit of production cross section via reaction was set to be 0.8 nb. These negative results make the existence of be in more puzzling situation. However Titov et al., using quark constituent coupling rules, shows that the production of the is suppressed relative to the resonance by about three orders of magnitude for high energy experiments [25]. Therefore, in order to confirm the existence of , high statistics experiments at low energy region with hadronic reaction become crucial. Many experimental data of are from photo-production experiments. In general the production cross section via hadronic reaction is expected to be much larger than that via photo-induced reaction. Now, physical properties such as spin, parity and width have not been determined experimentally yet. In order to measure these values, we need more statistics. From these viewpoints, the study of production using meson beam such as and is essential. Therefore we carried out an experiment to search for via reaction. In this reaction, the threshold momentum is 1.71 GeV/. We used 1.87 and 1.92 GeV/ beam.
The reaction near the production threshold was studied in 1960s using a bubble chamber [26]. The main backgrounds of the () reaction are production, production and 3-body phase space. The cross sections of these reactions were measured to be and b respectively at beam momentum from 1.8 to 2.2 GeV/. It is remarkable feature that in this momentum range the background is small because other channels do not open. In this past experiment the invariant mass of and were surveyed. Any peak structure was not observed. However numbers of and events were only 86 and 249 respectively.
The understanding of production mechanism is quite important to understand . Therefore a measurement of the production cross section with a simple reaction is important experimentally. Theoretically calculations with hadronic models using effective interaction Lagrangians and form factors were made by several authors [27, 28, 29, 30]. They try to understand the production mechanism via and reactions near the production threshold comprehensively. The theoretical calculations predict that the production cross section of reaction ranges from several b to several hundred b. However the parameters such as used in these calculations are not determined experimentally. Therefore these calculation should be compared with experimental data.
In this letter we report the results of an experiment to search for via reaction.
2 Experiment
We have performed the E522 experiment at the K2 beam line of the KEK 12 GeV Proton Synchrotron in 2004. The main objective of this experiment was to search for H-dibaryon resonance with () reaction. We searched for the enhancement at the threshold region of the double- system, which was first measured at KEK-PS E224 experiment [31], with much better statistics [32]. Besides this reaction, we optionally took data, because the search via mesonic reaction became crucial to confirm its existence and the K2 beam line is a unique beam line which can provide up to 2 GeV/ beam.
We used a beam of 1.87 and 1.92 GeV/. As a target, we used a scintillation fiber (SCIFI) target () and a bulk target of polyethylene (). The SCIFI target is 20 cm long, and is the same one used in the hyperon-nucleon scattering experiment (KEK-PS E289) [33]. It was mainly used to detect decay particles from reaction for the H-dibaryon resonance search. For () data, we mainly used the 10 cm long polyethylene target to enhance the contribution from free protons. The SCIFI target was also used to detect tracks of the charged particles other than produced by reactions. At the beam momentum of 1.87 GeV/, 2.9 and 3.0 beam particles were irradiated to the SCIFI and the polyethylene targets respectively. At 1.92 GeV/, 7.4 beam particles were irradiated to only the polyethylene target. For the calibration we took the following data. In order to estimate the contribution from carbon in the SCIFI and polyethylene targets, we took data with a carbon target. The () data were analyzed to measure the peak position for the calibration of the missing mass spectrum.
The experimental setup consisted of two parts; one part was a beam line spectrometer to analyze momentum of each incident beam particle and the other part was a forward spectrometer to detect scattered particles. The set up was almost similar to the one used at KEK-PS E373 experiment and detail of the experimental setup is described elsewhere [34].
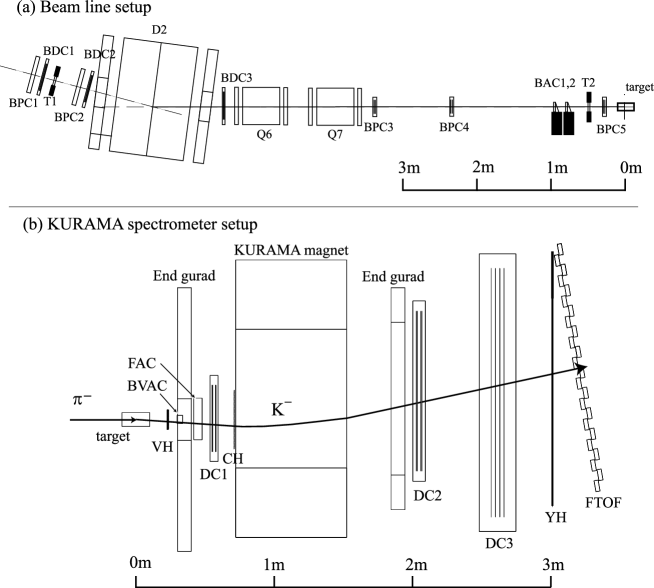
The K2 beam line is designed to transport charged particles up to 2.0 GeV/. Fig. 1 (a) shows the beam line spectrometer. The beam was bent by 15 degree at the bending magnet (D2) and focused at the target by two quadrapole magnets (Q6, Q7). The typical intensity of was 330k counts during 2 sec. spill with a primary proton beam of . Each beam particle was defined by the hit of T1 and T2 counters placed about 7.2m apart each other and was selected at a trigger by two aerogel cherenkov counters (BAC1,2), of which threshold velocity was 0.971, placed just upstream of the T2 counter. The beam momentum was analyzed with 5 wire chambers placed upstream and downstream of the D2 magnet. The momentum resolution is estimated to be MeV/ from a simulation. Between two quadrapole magnets (Q6, Q7) and the target, 3 proportional chambers were placed to measure the beam direction. The timing for all detectors was determined by the T2 counter.
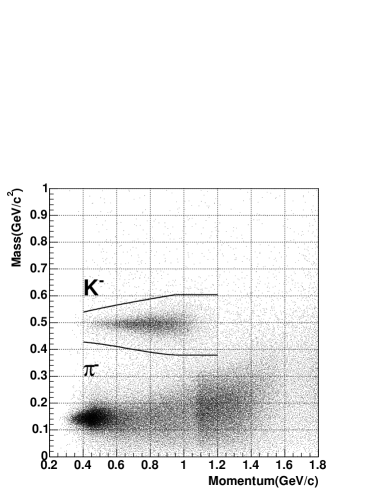
The scattered particles were detected by the forward spectrometer shown in Fig. 1 (b). The KURAMA magnet is 80 cm long and the magnetic field strength is 0.93T. The momentum of each scattered particle was measured using 3 drift chambers (DC1,2,3) and scintillation hodoscopes (VH, CH) placed upstream and downstream of KURAMA. The momentum resolution was 1.9 % (r.m.s.) for 0.8 GeV/ . The time-of-flight of each scattered particle was measured by a TOF wall (FTOF) placed at end of the spectrometer. A typical time resolution was 132 ps. Two cherenkov counters (BVAC, FAC) were installed between the target and KURAMA to veto . Besides this particle identification with these cherenkov counters at the trigger level, we selected the charge and momentum range of each scattered particle at 1st trigger level using the hit combination of each segments of CH hodoscope and FTOF. Momentum of each particle was determined using the hit combination. By combining time-of-flight information of the hit FTOF segment with this momentum information, the mass of each scattered particle was roughly calculated. We selected with this mass trigger (MT) at 2nd trigger level. This mass trigger rejected mainly which survived due to the inefficiency of the cherenkov counters. In the offline analysis, mass and momentum of each scattered particle are calculated more accurately as shown in Fig. 2. The mesons are clearly identified.
3 Analysis
| cut | efficiency(%) |
|---|---|
| selection | |
| Time-of-Flight cut | 93.8 0.1 |
| beam cut | 84.6 0.1 |
| beam momentum cut | 94.8 0.1 |
| selection | |
| mass-momentum cut | |
| Runge-Kutta cut | 72.70.2 |
| vertex selection | |
| vertex cut | 92.8 0.5 |
| closest distance cut | 97.8 0.1 |
| total | 49.60.3 |
We describe the analysis procedure to search for from the missing mass spectrum of the reaction. To obtain this spectrum, we applied the following cuts; 1) selection of in the beam and momentum analysis, 2) identification of the scattered and momentum analysis, and 3) selection of the reaction vertex point. The efficiencies of these cuts in the analysis, which are described in detail in the following paragraphs, are summarized in Table 1. The efficiencies of the track-finding routine are described in the next section and listed in Table 2.
The incident was identified using time-of-flight information between T1 and T2. The contamination of was negligible, and we selected region of its time resolution (70ps) as good events. Each incident momentum was calculated by fitting the hit positions at the beam line chambers (BDC1,2,3 and BPC1,2) with second order transfer matrix calculated by TRANSPORT [35]. The distribution of this fitting was consistent with the expectation except a tail towards large . We selected C.L.=95% region for cut whose efficiency was 84.6 % as the result of rejecting the large events. The event whose beam momentum was less than 1.8 GeV/ or larger than 2.0 GeV/ was rejected considering the momentum acceptance of the beam line.
Trajectories of outgoing particles were reconstructed by using the information of hit positions at the drift chambers (DC1-3) and the hodoscopes (VH, CH) and of the field map in KURAMA. At first, the local tracks upstream and downstream of KURAMA were searched by the straight-line fittings, and the consistency between these local tracks were checked to reject the decay events of . Then we used Runge-Kutta method for the momentum analysis [36]. The scattered ’s were selected by the momentum dependent mass cut and we selected 3 region as shown in Fig 2. The contamination of after this cut was about 3%. In the () reaction, the momenta of scattered ranged from 0.4 to 1.1 GeV/. Therefore the effect of multiple scattering made the distribution of Runge-Kutta tracking broader than the ideal one. To study the cut position of cut, we compared with the distribution obtained by the Monte Carlo simulation based on GEANT4 [37] which included all materials of the spectrometer and the electro-magnetic process, the hadoronic process and the decay process. The simulated distribution reproduces real data except a long tail towards large , not only for () reaction but also for () and () reactions where the typical momenta of were around 1.6 and 1.2 GeV/ respectively. From this study, we selected region where the distribution was consistent with the simulation.
In the momentum reconstruction, energy loss effect in the materials of the spectrometer was not taken into account. The energy loss in the target was corrected using the reconstructed momenta of the incident and outgoing particles with their directions and the calculated vertex positions.
The vertex point was calculated by the closest distant point between tracks of beam and outgoing particles. We required the vertex point to be less than 80mm from the target center. The beam size (1.4 1.3 cm2) was small enough in comparison with the target size. Because the SCIFI target enabled us to see particle trajectories as image data, we could estimate the efficiency of this vertex cut precisely by comparing the vertex position calculated by the spectrometer with one obtained in the image data. The efficiency of this cut was estimated to be 92.8 0.5 %. We also checked the distribution of the closest distance between tracks of beam and outgoing particles at the vertex point. The events where the closest distance was greater than 7mm, which corresponded to 3, were rejected considering that beam or outgoing particles reacted more than 2 times in the target.
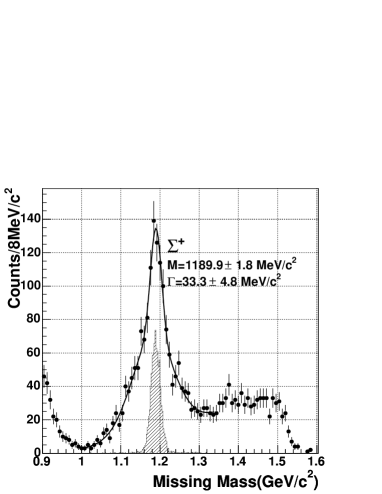
Fig. 3 shows the missing mass spectrum of the () reaction at the beam momentum of 1.92 GeV/. The peak due to is clearly observed. The beam momentum was normalized so as to make the obtained peak consistent with the PDG value. We fitted this spectrum with two Gaussian peaks assuming that the broad peak was attributed to quasi-free protons in carbon and the narrow one was attributed to free protons. The obtained width was 33.34.8 MeV/ (FWHM) which was almost consistent with the expected value of 28.3 MeV/ from the simulation. To estimate the missing mass resolution in the simulation, the position resolutions of the drift chambers, the momentum resolution of the beam spectrometer and the effects of the energy loss and the multiple scattering in materials for incident and outgoing particles were taken into account. Using the same program code, the missing mass resolution for was estimated to be 13.4 MeV/ (FWHM). In production, the momentum of the outgoing particle is much lower than that in the production. Therefore the missing mass resolution is better for .
4 Results and Discussion
The missing mass spectra for each beam momentum are shown in Fig. 5. In order to know the contribution from carbon nuclei in the SCIFI and polyethylene targets, carbon target data are also shown as the hatched spectra, which are normalized by the number of beam particle and the number of carbon nuclei in each target. The statistics of the carbon target data is about ten times lower than that of CH2 data. The net contribution from free protons is compatible with the expectation from the cross sections of background reactions measured in [26]. Because half of data at beam momentum of 1.87 GeV/ was taken with the SCIFI target, the contribution from free protons at 1.87 GeV/ is smaller than that at 1.92 GeV/.
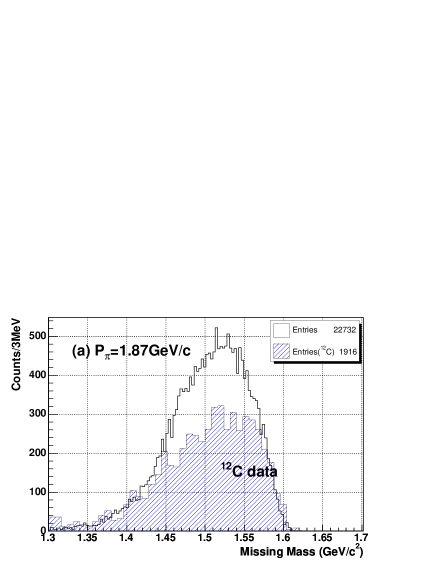
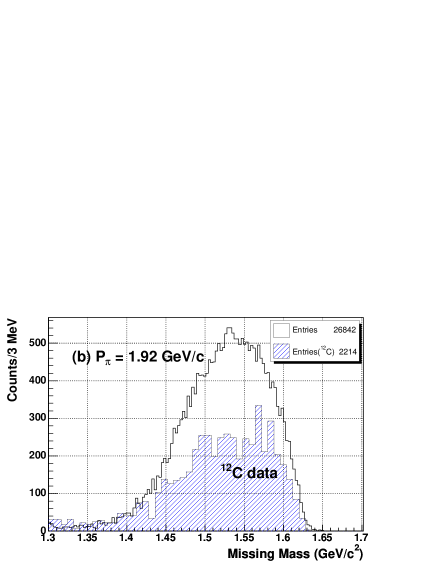
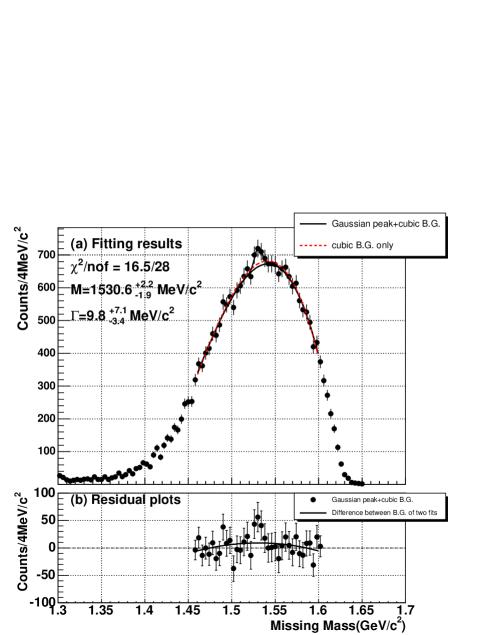
Fig. 5 (a) shows the missing mass spectrum of the reaction at 1.87 GeV/. In this spectrum, data for the SCIFI target and the polyethylene target are combined. Any peak was not observed in this spectrum.
Fig. 5 (b) shows the missing mass spectrum of reaction at 1.92 GeV/. It seems that there is a bump around 1.53 GeV/. However there is a possibility that the structure is only a statistical fluctuation. We fitted this histogram with the background of a cubic function and a Gaussian peak (see Fig. 5). The peak position is 1530.6 (stat.)(syst.) MeV/, the width is =9.8 MeV/ (FWHM) and the count of the peak is 139(stat.)10(syst.). The uncertainty of count resulting from varying the fitting range and binning is considered as the systematic error. The obtained width is consistent with the expected value of 13.4 MeV/ within the error. We also fitted this spectrum with the fixed width of 13.4 MeV/. The count of this bump was obtained to be 18371(stat.)10(syst.). The statistical significance of this bump was considered by two expressions. The first expression is the naive estimator where is the peak count within 2 region from the center and is the background within the same region, and the significance is 2.7. The second estimate of significance is given by , where is full area of the bump from the fit and is its fully correlated uncertainty. The significance of 2.5 is obtained by the second expression.
We fitted the histogram with only the background of a cubic function assuming that there is no peak structure. The fitting result is shown by a dashed line in Fig. 5. The statistical significance of the bump from this background is estimated to be 1.9 using the first expression, .
The statistical significance obtained in the present experiment is not sufficient to claim this bump as the evidence of . However it is quite important to estimate the upper limit of the production cross section of via the reaction. Therefore we have obtained the upper limit of the production cross section. To derive the upper limit, the peak count obtained from the fitting with the fixed width is used at beam momentum of 1.92 GeV/. We used a single tail approach assuming that the peak count fluctuates based on Gaussian statistics. Then the upper limit of the peak count is =274 at 90% confidence level, where denotes the peak count obtained from the fitting and , denote the statistical and systematic errors respectively, and we use this count for the following calculations.
In the missing mass spectrum at 1.87 GeV/, we could not find any obvious peak structure. We estimated that the signal from () is less than 1.28 at 90 % confidence level, where represents the count in the missing mass spectrum corresponding to region from the peak position (1530.6 MeV/) obtained from 1.92 GeV/ data. We calculated that were 62 and 52 for the SCIFI target and the polyethylene target, respectively.
The production cross section of was calculated by the following equation.
Here and represent the number of , beam particles and protons in the target. The solid angle covered by KURAMA spectrometer at laboratory frame is represented by d. Others represent various efficiencies, and are summarized in Table2.
| beam normalization factor | 83.6 1.3% | |
| track-finding efficiency of K2 beam line | 72.7 2.0% | |
| track-finding efficiency of scattered particle | 84.6 2.0 % | |
| Cherenkov overkilling factor | 90.8 0.8% | |
| decay factor | 57.6 0.1% | |
| absorption factor | 89.8 0.1% | |
| DAQ live time | 93.5 0.2% | |
| efficiency of mass trigger | 95.7 0.1% | |
| efficiency of analysis cut | 49.6 0.3% |
The coefficient is the correction factor to obtain the number of real . In this experiment, we could not distinguish and from . We referred the past experiment where a gas cherenkov counter was used to distinguish and and estimated that this contamination was 12.4% [38, 39]. We also calculated the reaction rate of in the target with GEANT simulation and obtained to be 4%. Adding these value, we estimated that was 83.6%.
The efficiencies of track-finding routines used in the analysis program for beam and scattered particles have to be estimated, because routines have criteria to find tracks such as minimum number of hit chambers and can not find out a part of tracks due to the inefficiency of the drift chambers or multi charged hit events. The coefficient is the track-finding efficiency for beam particles and obtained to be 72.7%. The reason for the inefficiency is mainly due to the dead channel of BDC3. The coefficient is the track-finding efficiency for scattered particles and obtained to be 84.6% by analyzing the data produced by the Monte Carlo simulation with the same analysis program. The validity of this estimation was checked using scattered proton events taken with () trigger data. The scattered protons could be selected by using information of hit combination of CH and FTOF counters and of time-of-flight without tracking. We estimated the track-finding efficiency by analyzing such pre-selected proton events. Results obtained from the simulated events and pre-selected proton events were consistent within 2.0% which denoted the error of the efficiency.
The coefficient represents the correction factor due to the overkilling rate of the cherenkov counters (BVAC, FAC) which was 9.2%. Therefore was obtained to be 90.8%. The coefficients, and , represent the correction factors due to the decay rate before arriving FTOF wall and the interaction rate of in the materials of the target and the forward spectrometer respectively. These factors were also calculated with the Monte Carlo simulation based on GEANT4 and obtained to be 57.6% and 89.8% respectively. The coefficients, and , are the efficiencies of the DAQ system and 2nd level mass trigger, and obtained to be 93.5% and 95.7% respectively. The coefficient is the analysis cut efficiency and summarized in Table1 and estimated to be 49.6%. Finally, the solid angle covered by the spectrometer () is 0.141 0.004 sr for reaction assuming that the mass of is 1530.6 MeV/. Scattered angles at the laboratory system range from to and the mean value of scattered angles is 8.2 .
Using these values, we obtained the upper limit of the differential cross section via reaction for 1.92 GeV/ data to be at 90% confidence level. Assuming that is produced isotropically in the center of mass system, 10.4% of is accepted by the spectrometer. Therefore, if the is produced with s-wave, the upper limit of the total cross section is obtained to be at 90% confidence level.
We obtained the upper limit of the cross section from the 1.87 GeV/ data as well as 1.92 GeV/ data. Because we used two different targets, we derived the upper limit for each target. From the SCIFI target data, the upper limit for and are obtained to be 1.7 b/sr and 2.1 b respectively. From the polyethylene target data, the upper limit for and are obtained to be 1.6 b/sr and 1.8 b respectively. These results from the two targets are consistent each other.
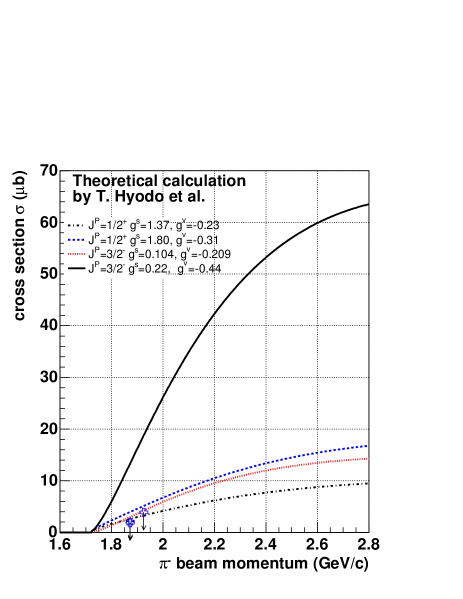
The theoretical calculations for this reaction have been done by W. Liu and C. M. Ko [27] and Y. Oh et al. [28]. These theoretical calculations depend on the values of the form factor and coupling constants. In Ref. [27], Liu and Ko calculated the cross section taking into account only the s-channel diagrams. They used , which corresponds to 20 MeV/ width of , and a cutoff value of GeV for the form factor. They predict that the cross section is about 50 b. Y. Oh et al. calculated the cross section taking into account the s-channel diagrams and t-channel diagrams where the is exchanged. They used =2.2, which corresponds to 5 MeV/ width of , and the same cutoff value used by C. M. Ko et al.. Because there is no information about , they used several values from 2.2 to 2.2 as . The calculated cross section ranges from about 2 b to 190 b. Present results are quite smaller than the theoretical calculations and gives strong constraint to these unknown parameters. Recently, a theoretical study of production mechanism via hadronic reactions has been done vigorously by T. Hyodo et al. [40]. Fig. 6 shows the obtained upper limit of the cross section for each beam momentum together with their theoretical calculations. They took particular note of the importance of two meson coupling, and calculated the total cross sections of the reaction and in case of and . They obtained the scalar and vector coupling constants of using the SU(3) symmetry from the decay width of . The obtained coupling constants have uncertainty due to the experimental uncertainties of the branching ratio. They restricted the coupling constants to be consistent with our present results for the dotted, dot-dashed and dashed lines in Fig. 6. The ratio of cross sections of and induced reactions can be calculated more reliably than the absolute value of the cross section. By using the coupling constant which explain the present data, they find that the ratio is very different for two assignments. In the case of the ratio of the cross section, , is 50, while in the case of it is 3.3. An experiment to search for via has being performed at KEK (KEK-PS E559). This experiment together with the present results provides deeper understanding on the existence of .
We have searched for via reaction with beams of 1.87 and 1.92 GeV/. In the missing mass spectrum at the beam momentum of 1.87 GeV/, no clear peak was found. At 1.92 GeV/, a bump has been found at 1530.6 MeV/. The statistical significance of this bump is 2.52.7 which is not sufficient to claim this bump as the evidence of . We have obtained the upper limit of production cross section via reaction at 90% confidence level assuming that is produced isotropically in the center of mass system. The upper limit have been obtained to be 1.8 and 3.9 b at beam momenta of 1.87 and 1.92 GeV/, respectively.
5 Acknowledgments
We would like to express our thanks to staffs of KEK PS and beam channel group for their support to provide beam with the excellent condition during the experiment. We also acknowledge to T. Hyodo for the theoretical discussion. One of the authors (K. M.) thanks to the Japan Society for the Promotion of Science (JSPS) for support. The work of J.K.Ahn was supported by a Korea Research Foundation grant (KRF-2003-015-C00130). This work was supported by the Grant-in-Aid for Specially Promoted Research (No.15001001) from the Ministry of Education, Culture, Science and Technology, Japan.
References
- [1] R.L. Jaffe, Proc. Topical Conference on Baryon Resonances, Oxford, July 1976, SLAC-PUB-1774.
- [2] T. Nakano et al., Phys. Rev. Lett. 91 (2003) 012002.
- [3] D. Diakonov, V. Petrov, M. Polyakov, Z. Phys. A 359 (1997) 305.
- [4] R. Jaffe, F. Wilczek, Phys. Rev. Lett. 91 (2003) 232003.
- [5] K. Goeke, H.-C. Kim, M. Praszalowicz and G.-S. Yang, Prog. Nucl. Part. Phys. 55 (2005) 350.
- [6] DIANA Collaboration, V. V. Barmin et al., Phys. Atom. Nucl. 66 (2003) 1715.
- [7] CLAS Collabaration, S. Stepanyan et al., Phys. Rev. Lett 91 (2003) 252001.
- [8] SAPHIR Collabaration, J. Barth et al., Phys. Lett. B 572 (2003) 127.
- [9] CLAS Collabaration, V. Kubarovsky et al., Phys. Rev. Lett 92 (2004) 032001.
- [10] A. E. Asratyan, A. G. Dolgolenko and M. A. Kubantsev, Phys. Atom. Nucl. 67 (2004) 682.
- [11] HERMES Collabaration, A. Airapetian et al., Phys. Lett. B 585 (2004) 213.
- [12] ZEUS Collabaration, S. Chekanov et al., Phys. Lett. B 591 (2004) 7.
- [13] COSY-TOF Collabaration, M. Abdel-Bary et al., Phys. Lett. B 595 (2004) 127.
- [14] SVD Collabaration, A. Aleev et al., arXiv:hep-ex/0401024.
- [15] P.Zh. Aslanyan et al., arXiv:hep-ex/0403044.
- [16] Hyper-CP Collabaration, M.J. Longo et al., Phys. Rev. D 70 (2004) 111101(R).
- [17] HERA-B Collabaration, I. Abt et al., Phys. Rev. Lett 93 (2004) 212003.
- [18] ALEPH Collabaration, S. Schael et al., Phys. Lett. B 599 (2004) 1.
- [19] BES Collabaration, J. Z. Bai et al., Phys. Rev. D 70 (2004) 012004.
- [20] BABAR Collabaration, B. Aubert et al., hep-ex/0502004.
- [21] CDF Collabaration, D. O. Litvintsev et al., Nucl. Phys. B (Proc. Suppl.) 142 (2005) 374.
- [22] SPHINX Collabaration, Yu. M. Antipov et al., Eur. Phys. J. A21, (2004) 455.
- [23] PHENIX Collabaration, C. Pinkerton et al., J. Phys. G 30 (2004) S1201.
- [24] CLAS Collabaration, M. Battaglieri et al., Phys. Rev. Lett 96 (2006) 042001.
- [25] A.I. Titov, A. Hosaka, S. Date, Y. Ohahi, Phys. Rev. C 70 (2004) 042202.
- [26] O. I. Dahl et al., Phys. Rev. 163 (1967) 1377.
- [27] W. Liu and C. M. Ko , Phys. Rev. C 68 (2003) 045203.
- [28] Y. Oh, H. Kim, and S. H. Lee , Phys. Rev. D 69 (2004) 014009.
- [29] Y. Oh, H. Kim, and S. H. Lee , Phys. Rev. D 69 (2004) 074016.
- [30] T. Hyodo, A. Hosaka, and E. Oset, Phys. Lett. B 579 (2004) 290.
- [31] J.K. Ahn et al., Phys. Lett. B 444 267 (1998).
- [32] C.J. Yoon et al., Proc. of the YITP workshop “Multi-quark Hadrons; for, five and more ?”, http://www.slac.stanford.edu/econf/C0402171/files/manuscripts/Yoon.pdf .
- [33] J.K. Ahn et al., Nucl. Instr. and Meth. A 457 137 (2001).
- [34] A. Ichikawa et al., Phys. Lett. B 500 (2001) 37.
- [35] K.L. Brown et al., CERN 76-13, (1976), SLAC-91, (1974).
- [36] J. Myrheim and L. Bugge, Nucl. Instrum. Methods. 160 (1979) 43.
- [37] S. Agostinelli et al., Nucl. Instrum. Methods. A 506 (2003) 250.
- [38] A. Yamamoto, KEK report 81-13, (1981).
- [39] Y. Kondo, Ph.D. thesis, Kyoto University (2000), (unpublished).
- [40] T. Hyodo, and A. Hosaka, Phys. Rev. C 72 (2005) 055202.