Present Address: ]Lawrence Livermore National Laboratory, Livermore, CA 94550
Half-life of 14O
Abstract
We have measured the half-life of 14O, a superallowed decay isotope. The 14O was produced by the 12C(3He,n)14O reaction using a carbon aerogel target. A low-energy ion beam of 14O was mass separated and implanted in a thin beryllium foil. The beta particles were counted with plastic scintillator detectors. We find s. This result is higher than an average value from six earlier experiments, but agrees more closely with the most recent previous measurement.
pacs:
21.10.Tg,23.40.Bw,12.15.Hh,27.20.+nSuperallowed nuclear beta decays can be used to determine the effective weak vector-coupling constant () for the nucleon. The Cabbibo-Kobayashi-Maskawa (CKM) matrix element is obtained from and the corresponding muon decay constant, , after appropriate radiative corrections are applied. Uncertainties in presently contribute the largest uncertainty to a precision unitarity test of the matrix. To determine the values to the required precision, the half-lives, branching ratios, and Q-values of superallowed transitions must be measured precisely. Several small but important radiative corrections must be determined reliably towner02 . The theoretical uncertainty in is currently thought to be dominated by nuclear structure dependent corrections. To attempt to assess the reliability of the theoretical corrections, some new work is directed to measuring superallowed transitions in higher-Z nuclei where the corrections are larger hardy03 . However, it remains important to reduce experimental uncertainties in the low-Z systems where the corrections are small. Radioactive beam techniques provide a new opportunity to study superallowed decays by making accessible systems with higher Z or , which lie farther from stability. These techniques can also be used to study low-Z superallowed beta decays with better precision by using very pure, mass-separated samples, as in Ref. gaelens01 .
We have measured the 14O half-life using a mass-separated radioactive ion beam, providing a relatively pure sample. With a low contamination sample, we could use simple fast organic scintillators to detect the beta particles emitted by 14O, instead of the gamma rays as in most previous experiments. Organic scintillators have small, well-controlled dead time as compared to the much slower germanium detectors used in previous experiments such as Ref. clark73 . The authors of Ref. barker04 identified a serious and unappreciated systematic effect in germanium detectors used for high-precision lifetime measurements.
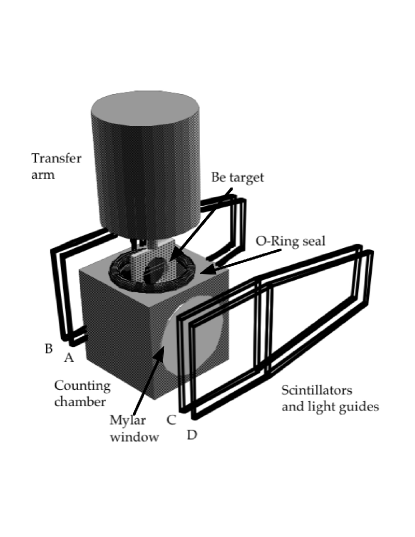
The 14O in this experiment was produced via the 12C(3He,n)14O reaction using a 20 MeV 3He beam (up to 10 pA) from the 88-Inch cyclotron at Lawrence Berkeley National Laboratory. The target was a piece of carbon aerogel (0.25 g/cm3) heated to 2000 K by the cyclotron beam and 200 W of additional electrical power from resistive heating. The 14O generated in the target evolved as gaseous CO and CO2. Radioactive gas diffusing from the target was pumped through a ten meter vacuum line by a magnetically levitated turbomolecular pump into an electron cyclotron resonance (ECR) ion source, described in Ref. wutte98 . The turbopump exhaust line was run through a cold trap (at -78 C) at the inlet to the ion source to remove condensable contaminant gases, improving the ion source performance. We estimated the fraction of the 14O released from the target by venting the exhaust from the turbopump into a closed vacuum chamber and counting the characteristic MeV gamma ray from 14O decay in this volume. The 14O yield from the target was calculated from the cross-sectionosgood64 . We conclude that of the 14O was released from the target at 2000 K. The ion source produced a 54 keV, mass-separated 14O2+ ion beam which was implanted into a 150 m thick beryllium foil (thin enough for the particles to pass through to trigger the detectors on both sides of the foil). The mean ion implantation depth was estimated to be 136 nm using an ion stopping and range calculation software package. At this depth and at the slightly elevated temperature of the foil (caused by ion beam heating), the diffusion of the 14O activity out of the foil during the count cycle is negligible. The target foil was shuttled 82 cm in vacuum in 10 s to a separate, shielded observation chamber with a magnetically coupled manipulator. The observation chamber was a hollow, aluminum cube (2.5 cm) with two 50 m thick aluminized mylar windows on opposite sides. A buna rubber O-ring sealed the manipulator arm, preventing any diffusion of radioactive gases into or out of the chamber during the counting cycle. The 0.1 cm2.54 cm2.54 cm plastic scintillators were located 4 mm from the windows. Tapered light guides coupled each of the four scintillators to a Hamamatsu R647 photomultiplier tube. Two pairs of scintillators were placed on opposite sides of the cube, with one scintillator 3 mm in front of another. The arrangement of the detectors around the counting chamber is shown in Figure 1. Beta particles from the source passed through the mylar windows, producing minimum ionizing signals in the scintillation detectors. The discriminator thresholds were set below the most probable minimum ionizing energy peak to mitigate the effects of gain shifts of the detectors.
Twenty-nine counting runs were performed during a 30 hour period. The target foil was exposed to the 14O2+ ion beam for 200 s. The source activity reached approximately decays per second during the bombardment. Following this exposure, a gate valve interrupted the ion beam, and the target foil was shuttled to the observation chamber. Scalers recorded the rate of three beta detectors (a fourth counter failed during the run and was not included in the analysis) for a period of 4000 s. At the end of the observation period, the foil was returned to the beam line, the gate valve was opened, and the procedure repeated. The 29 data sets each contained 8000 time bins spaced at 0.5 s intervals. The counting scalers were gated off for the last 500 s of each time bin to allow the data to be read out. We used a very long observation time (56 half-lives) in each run to precisely determine the background rate and to search for radioactive contaminant species. By design, the dead time of the system was dominated by the width of the final logic pulse sent to the scalers. This provided a single, well-characterized dead time much longer than other dead time contributions earlier in the electronic logic chain. The logic signal from each detector was sent to three separate scaler channels with different nominal dead times: 400 ns non-extendable, 700 ns extendable, and 400 ns extendable. This allowed analysis with different dead times for the same data set. The minimum dead time was long enough to avoid effects of PMT after pulsing, detected in about of the PMT pulses. The width of the count pulse sent to the scaler (the largest single component of the dead time) was measured off-line using a calibrated time-to-digital converter. The total dead time of the system was also checked using a radioactive source to determine the fractional loss in the rate in the final scalers compared to a fast analog scaler measuring the PMT signals. These two methods gave dead times differing by less than 9 ns, which we take to be the dead time uncertainty.
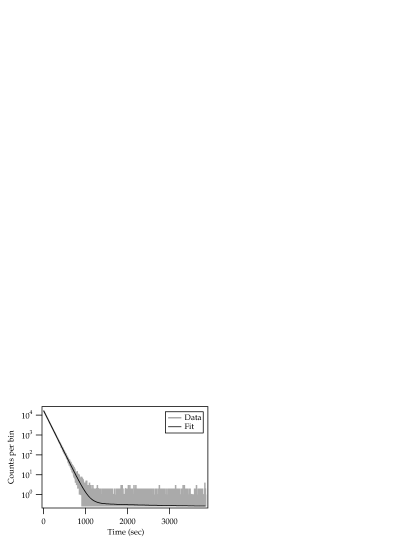
The data were analyzed by fitting to exponential decay curves and a flat background. The fits used maximum likelihood curve-fitting rather than chi-squared minimization, based on the arguments in Ref. baker84 , which argues that chi-squared minimization is unsuitable for data spanning a wide range of statistical uncertainty or when the number of data counts per bin becomes small. The free parameters in the fit function were the initial decay rates for 14O and potential contaminants, a constant background term, and the half-life of 14O. The dead times were fixed in the fits to the measured values. Contaminants which were produced in the target and could be transported as gas were 11C ( m), 13N ( m), and 15O ( s) via the reactions 12C(3He,)11C, 12C(3He,d)13N, and 13C(3He,n)15O. The mass resolution of the separating magnet in the ion beam line was , and ion beam contamination at the target was estimated to be less than one part per million of the next charge-to-mass ratio species. However, these emitters could be transported as neutral gas through the cryogenic trap at the entrance to the ion source, through the source (but not ionized), and into the counting chamber by molecular diffusion. We allowed the amounts of these activities to vary in the fits to the decay data, finding amounts of contaminant activity of to of the 14O activity (depending on the time bin in which the fits were started). The count rate in the fit function was calculated for the counting time of 0.4995 s and corrected for dead time loss to obtain a theoretical decay curve. The spacing of the time bins in the fits was 0.5 s, corresponding to the total time spent in each bin in the experiment. This theoretical decay curve was compared to the data to generate the maximum likelihood estimator in the fits. The data for each of three detectors (labeled B, C, and D) and three dead times were analyzed separately for each run. The final average was obtained from the unweighted mean of the half-life results from all 29 runs. We used an unweighted mean since the statistical uncertainty in the 14O determined by the fit was nearly identical for each run at a given initial count rate, while the variation in the fitted half-life exceeded the statistical uncertainty found by the fit. We varied the initial count rate (the “start time” of the fit) in the analysis to search for systematic errors. Detector (A) failed during the run when its high-voltage lead shorted. We observed intermittent data loss and high-voltage discharge for this detector in several runs, and we did not use this detector in the final analysis. A typical decay curve for a single run in one detector is shown in Fig. 2. The statistical uncertainty in the 14O half-life from a fit to a single run with an initial count rate of 20 kHz was about 65 ms.
Using a Monte-Carlo simulation, we investigated several potential systematic effects caused by instability in the detectors and electronics. We produced simulated decay data, including dead time losses. To study the effect of drifts, we introduced a linear time-dependent detector efficiency into the simulation. Simulated data were fit to determine the dependence of the half-life on the drift. We measured drifts in time and with temperature of the PMT high voltage power supplies, discriminator voltage set points, and PMT gains. In off-line tests using a radioactive 90Sr beta source, we measured the count rate shifts induced by these drifts, and then interpolated the results from the Monte-Carlo data to estimate a systematic uncertainty in the half-life. We also studied the effect of dead time uncertainty with this technique, finding a 2 ms uncertainty in the half-life (from fits at 20 kHz initial rate) caused by the uncertainty of 9 ns in the measured dead time. This agrees with the 2-5 ms differences observed in the averaged half-life measurements for the three different dead time channels. We neglect the effect of short, earlier dead times in series with the long dead time logic pulses sent to the scalers. This would cause an error of less than 1 ms in the measured half-life using data with an initial rate of 20 kHz. We observed fluctuations of 20-50% (with a period of about 45 s) in the average background rate in the detectors both during and after the runs. We modelled this behavior in Monte-Carlo generated data to determine the effect on the half-life, and assigned systematic uncertainties to each detector of 2 ms (B), 9 ms (C), and 3 ms (D). The average background rates were 0.106 Hz, 0.558 Hz, and 0.189 Hz, respectivly. The fluctuation of the PMT’s high voltage (of about 0.3 volts) causes an uncertainty of 2 ms in the half-life for the data with 20 kHz initial count rate.
We measured gain changes in the detectors as a function of the count rate. Before taking the data to measure the 14O half-life, we measured the pulse height spectra of the scintillators during a bombardment and counting cycle with the same initial count rates in the scintillators (up to 180 kHz in the front detectors) as in the half-life measurement data. The data for this run do not have a precise time base and were not used to determine the half-life. The most probable pulse height in the counters was smaller at high count rates than at lower rates. This caused a fraction of the counts to be lost below threshold at high rates. Figure 3 shows this count loss fraction as a function of rate. In the worst case (detector A), we estimate that 15% of the counts in the minimum-ionizing spectrum in the detector can be shifted below threshold at the highest rates observed during the experiment (200 kHz). We also performed an off-line test of the detectors to search for transient time behaviors of the gains. We used a 90Sr beta source placed behind a movable shutter to produce a rapid rate change in the detectors (from less than 1 Hz to 12 kHz in less than 0.1 seconds). We observed a small, transient change in the count rate in one of the detectors immediately after the change to high rate. The rate in detector D increased by 0.6% to its steady-state value in about 125 seconds. This transient effect was not present above 0.05% in a second detector we tested (detector C). To avoid systematic error in the half-life caused by the change in gain in the detectors as a function of time or rate, we restricted the analyzed data to count rates less than 20 kHz. This removed approximately the first 150 seconds of data in each run. In Fig. 3, this cut reduces the measured count loss fraction to less than of the total counts per bin. At this level, according to the simulations, the count loss from any remaining gain shift would change the half-life by less than 4 ms.
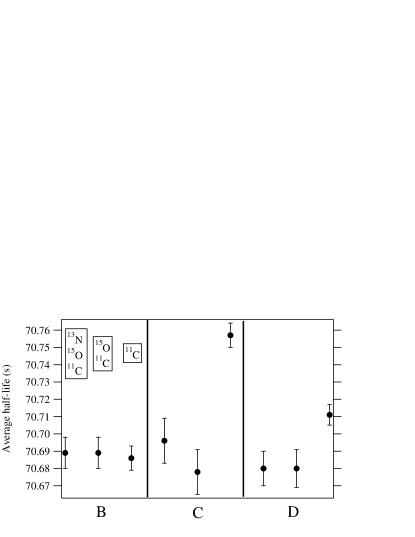
The largest sytematic uncertainty in our result is caused by the presence of contaminant decay activities. We performed several analyses which included different combinations of the possible contaminant species 11C, 13N, and 15O as fit terms. The amount of contaminant species identified by the fits ranged from of the initial 14O activity (for 11C) to (for 15O when using a starting time bin for the fits corresponding to count rates of 20 kHz in the detectors). When starting the fits at different time bins to limit the initial count rates in the detectors and to search for other rate-dependent effects, the amount of contaminant activity (extrapolated to the beginning of the counting cycle in the run) was consistent for each species as we varied the start time of the fits. The fraction of contaminant species varied among runs by about a factor of two, and the fraction of contaminant species identified by the fit routines agreed among the detectors in each run. We found no statistically significant difference in goodness-of-fit for fits using all three contaminants, fits using only 11C, and fits using 11C and 15O. The resulting averaged 14O half-life for these three different fit methods differed by 3 ms for detector B, 53 ms for detector C, and 13 ms for detector D, when the fits were restricted to data with a 20 kHz initial rate. This suggests that we should assign a systematic uncertainty to our inability to distinguish which of the contaminant contributions is the best fit. The averaged half-life for each detector is shown in Figure 4 for each of three analyses with different combinations of contaminant species allowed to vary in the fits. Detector B has no disagreement among the fits, while detector C shows a strong disagreement for the result of the fit with only 11C. This may be due to the relatively higher background rate in detector C (0.55 counts per second) compared to detector B (0.11 counts per second), as well as the fact that to achieve 20 kHz initial rate in C, we have to wait longer, so that the ratio of 14O activity to contaminant is necessarily lower. Our simulations (in which we artificially introduce contaminant species into the data, while not allowing these actvities to vary in the fits) bear out this explanation. To assign a systematic uncertainty, we take an unweighted average over the three fit methods with different contaminant combinations for each detector. For each detector, we could use the standard deviation of this mean as an uncertainty associated with our inability to fully determine the contaminant identities using only the fits to the decay data. This would be a 2 ms uncertainty for detector B, while detector C would have a 41 ms uncertainty, and an 18 ms uncertainty for detector D. In combining the data from different detectors for a final average, however, we believe that this would underestimate the contaminant identification uncertainty, since a final systematic uncertainty estimate would be dominated by the estimate in detector B. Instead, to estimate the systematic uncertainty from contaminant ambiguity, we use the average run-to-run difference in half-life among the three fit methods for each detector: 47 ms (detector B), 54 ms (detector C), and 55 ms (detector D). In general, restricting the analysis to low initial count rates to avoid the errors caused by gain shifts in the detectors forces accepting a large uncertainty from being unable to identify the contaminating beta activities (particularly 15O). For the final result, we use the half-life values from fits which allowed the amounts of all three possible contaminant species to vary.
The measured half-life for each detector is derived from an unweighted average of the fit results from the 29 runs. In this average, we arbitrarily select one of the dead time channels (since the results from the three dead time channels agree within 5 ms in this analysis and since the data in each channel are not statistically independent). We use an unweighted average since the chi-squared for a weighted average (with the half-life uncertainty for each run equal to the statistical error from the fit) over the 29 runs is high (). The large scatter among the run results is probably caused by variation of the amount and identity of contaminant activity and constant background rate (or its drift) from run to run. The statistical uncertainties in the unweighted averages (the standard deviation of the mean of the 29 runs) are 11 ms (detector B), 17 ms (C), and 11 ms (D). We apply the systematic uncertainties (added in quadrature) to each detector from deadtime uncertainty (4 ms); drifts in background and voltage (B, 2.5 ms; C, 9 ms; D, 4 ms); and contaminant identification (as above), and then average over the detectors. The result with statistical and systematic uncertainty for each detector are B: 70.698(11)(47) seconds, C: 70.697(17)(55) s, and D: 70.688(11)(55) s. We cannot average over all three detectors, because detectors C and D (front and back) count many of the same particles (which can trigger minimum ionizing pulses in both detetors) and are not statistically independent. We can only average detectors B and C or detectors B and D. To generate a final uncertainty, we reduce the statistical uncertainty component, while using the mean systematic uncertainty of the detectors. Averaging B and C yields 70.698(9)(51), while averaging B and D yields 70.693(8)(51). Our result is a mean of these two values (without reducing uncertainty), 70.696(52) s, with statistical and systematic uncertainties added in quadrature.
Our technique using a mass-separated radioactive beam produced samples with relatively low contamination and low background. Our result could be improved with the use of stabilized PMT counter systems to decrease the potentially large systematic error from changing gains. Avalanche photodiodes generally have a wider dynamic range in rate than PMTs and also seem promising. These approaches would allow an experiment to take advantage of the small statistical error when using fast counters and an intense source of activity. With stabilized gains, we could count more decades of decay activity and better resolve the contaminant contributions to the decay data.
Our result for is longer than the recommended average value 70.616(14) in Ref. hardy04 . The authors of Reference barker04 , who found , suggested that earlier half-life measurements (e.g. Clark et al. clark73 ) were subject to error from pileup effects in precise measurements performed with germanium detectors. Our result with faster scintillators and logic electronics supports this hypothesis. If we include our measured half-life in the average calculated by Towner and Hardy in Ref. hardy04 , we obtain an average half-life of 70.620(14) (following the prescription to renormalize the uncertainty when ). Selecting a different set of measurements (on the basis of avoiding rate-dependence or pileup error) to derive a “best value” for the half-life of 14O could arrive at a higher value. Using the average half-life value 70.620(14) and the rest of the data (including the recent measurement of the 14O Q-value by Tolich et al. in Ref. tolich03 ), the re-evaluated branching ratio in Ref. towner05 , the calculated corrections , , and the re-calculated electron capture probability for 14O summarized in Ref. hardy04 , we obtain . This is to be compared with the values calculated in Ref. savard05 for 14O of , and to the average value from the twelve most precisely measured superallowed transitions, . A recalculation of the unitarity sum is presented in savard05 , using a value for suggested in mescia04 .
Acknowledgements.
We thank the staff at the 88-Inch Cyclotron for their assistance during the project. S.W. Leman worked on early phases of the experiment and N.D. Scielzo assisted in data acquisition. This work was supported by the Director, Office of Science, Office of Basic Energy Sciences, of the U.S. Department of Energy under Contract No. DE-AC02-05CH11231.References
- (1) I.S. Towner and J.C. Hardy, Phys. Rev. C 66,035501 (2002).
- (2) J.C. Hardy, V.E. Iacob, M. Sanchez-Vega, R.G. Neilson, A. Azhari, C.A. Gagliardi, V.E. Mayes, X. Tang, L. Trache, and R.E. Tribble, Phys. Rev. Lett., 91, 082501 (2003).
- (3) M. Gaelens et al., Eur. Phys. J. A 11, 413 (2001).
- (4) G.J. Clark, J.M. Freeman, D.C. Robinson, J.S. Ryder, W.E. Burcham, and G.T.A. Squier, Nucl. Phys. A 215, 429 (1973).
- (5) P.H. Barker, I.C. Barnett, G.J. Baxter, and A.P. Byrne, Phys. Rev. C 70, 024302 (2004).
- (6) D. Wutte, M. Leitner, M. Williams, K. Leung, R. Gough, K. Saadatmand, and V. Benveniste, Rev. Sci. Instrum. 69, 712 (1998).
- (7) D. Osgood, J. Patterson, and E. Titterton, Nucl. Phys. 60, 503 (1964).
- (8) S. Baker and R. Cousins, Nucl. Instrum. Methods 221, 437 (1984).
- (9) J.C. Hardy and I.S. Towner, Phys. Rev. C 71, 055501 (2005).
- (10) N.R. Tolich, P.H. Barker, P.D. Harty, and P.A. Amundsen, Phys. Rev. C 67, 035503 (2003).
- (11) I.S. Towner and J.C. Hardy, Phys. Rev. C 72, 055501 (2005).
- (12) G. Savard et al., Phys. Rev. Lett. 95, 102501 (2005).
- (13) F. Mescia, hep-ph/0411097 (2004).