Enhancement of hyperon production at central rapidity in 158 GeV/ Pb–Pb collisions
Abstract
Results are presented on hyperon and antihyperon production in Pb–Pb, pPb and pBe collisions at 158 GeV/c per nucleon. , and yields have been measured at central rapidity and medium transverse momentum as functions of the centrality of the collision. Comparing the yields in Pb–Pb to those in pBe interactions, strangeness enhancement is observed. The enhancement increases with the centrality and with the strangeness content of the hyperons, reaching a factor of about 20 for the in the central Pb–Pb collisions.
1 Introduction
Collisions between heavy nuclei at very high energy provide a unique opportunity of producing and studying in laboratory the QCD-predicted phase transition from ordinary nuclear matter to a colour-deconfined Quark-Gluon Plasma (QGP) [1]. The plasma occurrence and its properties can only be inferred from a study of the characteristics of the colourless particles finally emerging from the collision. Several experimental signatures for the QGP have been proposed, among which the production of strange particles, in particular, is considered to be a powerful diagnostic tool [2]. If a QGP state is formed, an increased production of and quarks with respect to normal hadronic interactions is expected, because the production of pairs becomes competitive with that of and pairs due to partial chiral symmetry restoration and, at SPS energies, also because of the Pauli blocking of the production of light quarks in a and rich environment. The production of pairs is expected to equilibrate in a few fm/, comparable with the plasma lifetime. The net result, after statistical hadronisation, would be an enhancement of strange and multistrange particle production in ion–ion interactions with respect to nucleon-nucleon interactions.
An increased production of strange particles would also be possible in a purely hadronic scenario (hot and dense hadron gas) where the relative abundance of strange particles could grow gradually in a chain of rescattering processes. Such a mechanism is however hindered by the high threshold for associated production and, therefore, the characteristic time scale would be much longer than in a QGP, particularly for multistrange antibaryons.
The NA57 experiment [3] at the CERN SPS has been designed to study the strange baryon enhancement in Pb–Pb collisions already observed by its predecessor WA97[4] with the hierarchy expected in a QGP scenario: being more enhanced than and more than . In particular, the aim of NA57 is to investigate the dependence of the strangeness enhancement on the collision centrality (measured by the number of nucleons taking part in the collision) and also on the collision energy. For these reasons the NA57 experiment has extended the centrality range covered by WA97 towards lower centrality and has collected Pb–Pb data at two beam momenta, 158 and 40 GeV/. As a reference for the enhancement evaluation, we use hyperon production in pBe interactions, which provide a good approximation to elementary nucleon-nucleon interactions. NA57 has collected data on pBe interactions at 40 GeV/ only, while at 158 GeV/ the pBe data available from the WA97 experiment have been used. In this paper, results on strange baryon and antibaryon production at the upper energy are presented as function of the centrality. In addition, hyperon production in pPb interactions at 158 GeV/ (from the WA97 experiment) is presented for comparison.
The paper is organised as follows. The NA57 apparatus is described in section 2, along with that for WA97, as used for the pBe and pPb data taking. In section 3 the strange particle reconstruction procedure is explained and the extraction of clean samples of the hyperons under study is discussed. Section 4 deals with the evaluation of yields and enhancements as functions of the centrality. A discussion of the results is presented in section 5. Finally, conclusions are drawn in section 6.
2 The experiments
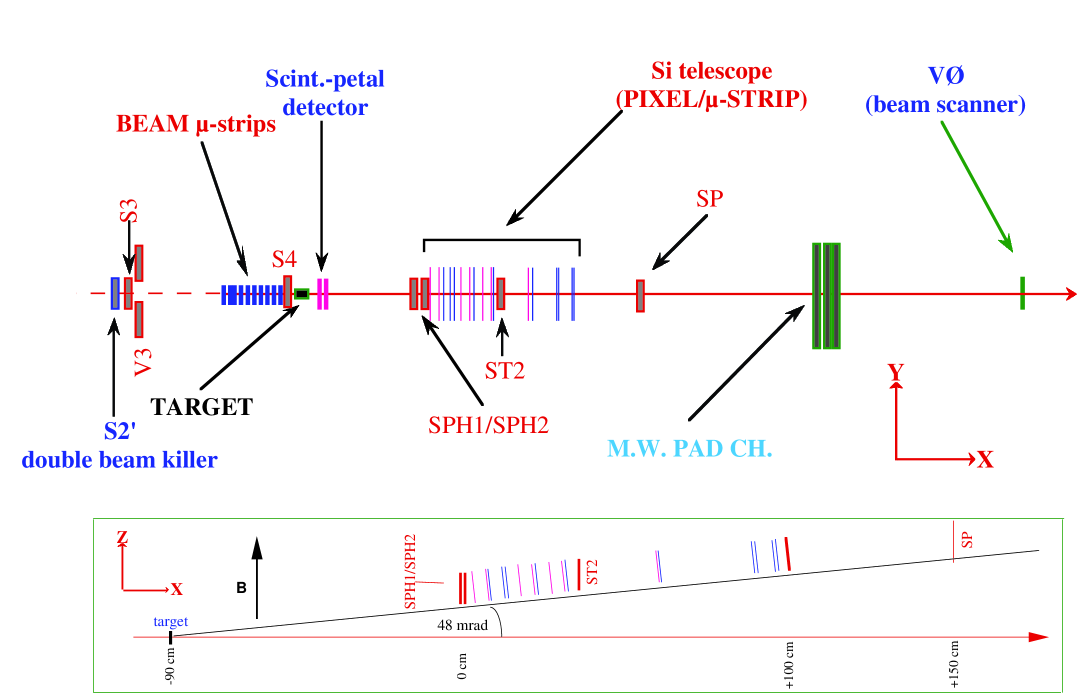
The layouts for the NA57 and WA97 experiments (figures 3,3) are conceptually similar [5, 6]. In both experiments the charged tracks coming from strange particle decays are reconstructed in a telescope made from an array of silicon detector planes of 5x5 cm2 cross-section placed in an approximately uniform magnetic field perpendicular to the beam line; the bulk of the detectors was closely packed in approximately 30 cm length, this compact part being used for pattern recognition. The telescope was placed above the beam line, inclined and aligned with the lower edge of the detectors laying on a line pointing to the target. The inclination angle and the distance of the first plane from the target are set so as to accept particles produced in about a unit of rapidity around mid-rapidity, with transverse momentum above a few hundred MeV/. In such conditions the track densities reach about for central Pb–Pb collisions at 158 GeV/. The detectors employed have good granularity and precision, allowing them to handle such high particle densities. The two experimental setups are outlined in the following.
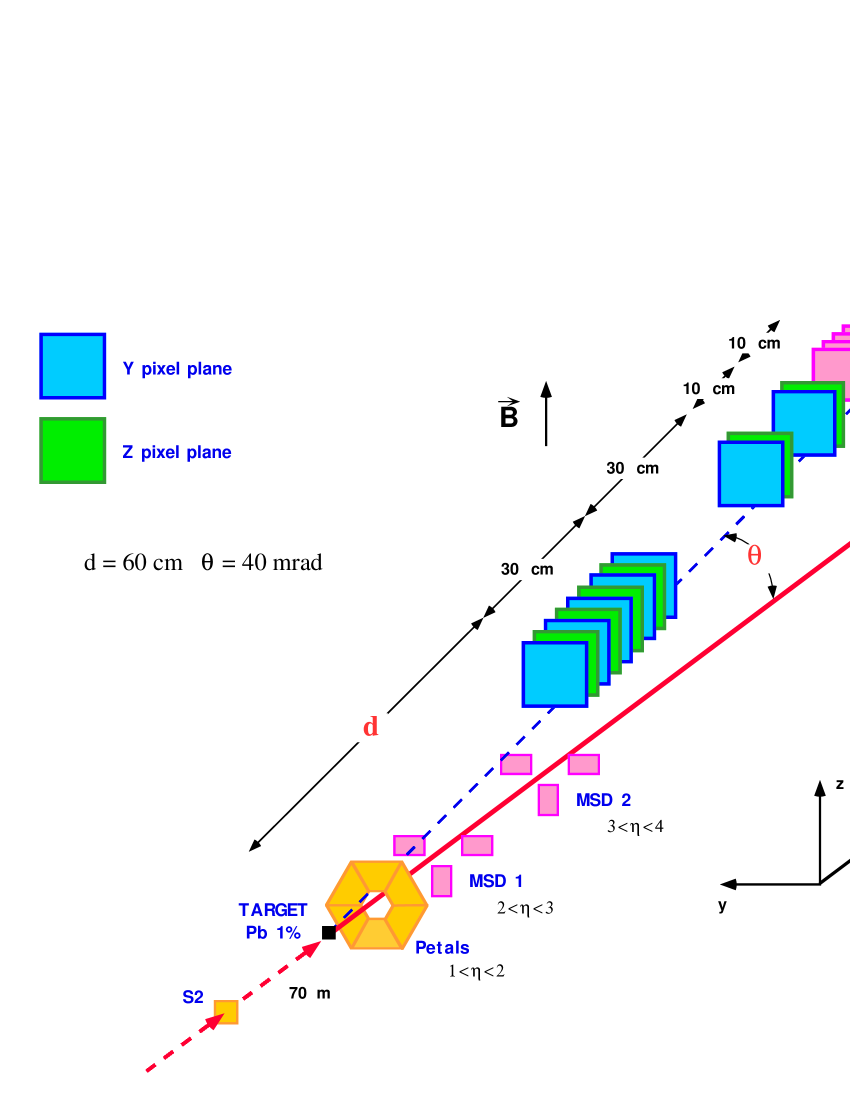
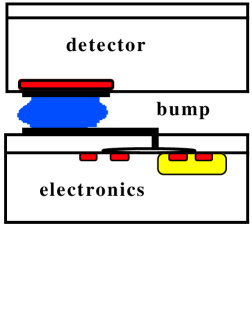
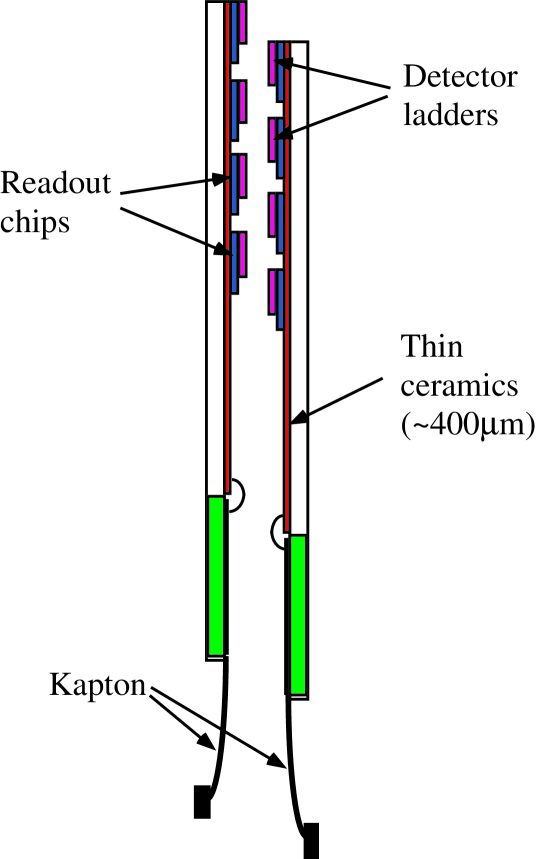
The NA57 telescope (figure 3) was entirely made of hybrid silicon pixel detectors. This technique was successfully pioneered by the WA97 experiment together with the RD19 collaboration [7]. A hybrid pixel detector is a matrix of reverse-biased silicon detector diodes, bump-bonded to front-end electronics chips, as sketched in figure 6. Two generations of silicon pixel detectors were used: Omega2 [8], with a pixel size of , and Omega3 [9], with a pixel size of . In both cases, six integrated front-end/readout chips were bump-bonded to a silicon sensor segmented into pixels, to form the basic building block of the detector, called a “ladder”. Several ladders, six for the Omega2 and four for the Omega3, were then glued on a ceramic carrier; each plane of the telescope consisted of two such arrays mounted face-to-face, suitably staggered, to hermetically cover a sensitive area of with active elements, as shown in figure 6. In total, the telescope contained seven Omega2 and six Omega3 planes, with the long pixel edge alternately oriented along the magnetic field and the bend direction (z and y respectively in figure 3), for a total of about channels. Nine of them were in the 30 cm long compact part of the telescope, while the remaining four pixel planes together with four double-sided silicon microstrip detectors (95 m pitch, stereo angle ) with analogue read-out formed a lever arm system, placed downstream in the magnetic field to improve the momentum resolution of the high momentum tracks. An array of 6 scintillation counters (Petals), located 10 cm downstream of the target, provided a fast signal to trigger on central collisions. The Petals covered the pseudorapidity region and their thresholds were set so as to accept events with track multiplicities above an adjustable limit. This was tuned so that the triggered event sample correspond to approximately the most central 60% of the Pb–Pb inelastic cross-section. The thickness of the Pb target was of 1% of the interaction length, which made the trigger rate and the data acquisition capability properly matched. The centrality of the collisions has been determined off-line by analysing the charged particle multiplicity measured by two stations of microstrip silicon detectors (MSD) which together sampled the pseudorapidity interval . The whole apparatus was placed inside the 1.4 T magnetic field of the GOLIATH magnet in the CERN North experimental Area. A total sample of about Pb–Pb interactions at 158 GeV/ has been recorded.
a)
 b)
b)
For the WA97 experiment the 1.8 T OMEGA magnet in the CERN West experimental Area was used. The telescope consisted of 10 silicon microstrip planes (50 m pitch with binary readout) with the strips oriented alternately in the horizontal and vertical direction, interleaved with seven pixel planes providing altogether detecting elements (figure 3). The compact part consisted of six pixel and five microstrip planes, while the lever arm system used the remaining pixel and microstrip planes distributed along the telescope line inside the magnet, followed by three multi-wire proportional chambers with pad cathode readout located just outside the magnetic field. In the pBe and pPb runs, scintillation counters placed before and behind the compact part of the telescope have been used in the trigger to require at least one track traversing the telescope; for most of the data taking, the additional condition of two tracks entering the telescope was applied in order to increase the recorded sample of hyperon events. The protons in the beam were selected using two Čerenkov CEDAR detectors [10]. In order to allow the event-by-event evaluation of the position of the main interaction vertex, an array of 10 microstrip detectors of 20 m pitch was mounted before the 8% interaction length beryllium target with the strips oriented alternately in the horizontal and vertical direction. This beam telescope was not present for the pPb run; in this case, however, a shorter target was used and therefore the position of the primary vertex was better constrained due to the smaller thickness of the target. The total recorded data sample consists of pBe and pPb interactions at 158 GeV/ beam momentum.
3 Data analysis
3.1 Extraction of the signals
The , , hyperons and their antiparticles were identified through their weak decays into charged particles only, namely:
| (1) |
with the corresponding charge conjugates for the anti-hyperons; all the secondary charged tracks were required to be reconstructed in the compact part of the telescope. The physical signals have been extracted using geometrical and kinematical constraints with a procedure similar to that explained in reference [11] and described below. Slightly different selection criteria have been employed for Pb–Pb, pBe and pPb analysis. In the following we discuss the most important ones. The complete sets of conditions and numerical values of the cuts for both and cascade selection are described in reference [12] for Pb–Pb, in [13] for pBe, in [14] for pPb.
The and hyperons111The apparatus being not able to detect the electromagnetic decay , in the following the symbol “” indicates the unresolved signal. (as well as the mesons) have been searched for by combining any pair of oppositely charged tracks in an event to find what is usually called a topology: the two tracks were required to cross in space within a predetermined tolerance (distance of closest approach smaller than 0.3 mm in the Pb–Pb sample, 1 mm in pBe and pPb), in a fiducial region located between the target and the telescope, whose actual dimensions were tuned separately for each experimental setup (e.g., 30 cm length in Pb–Pb). The line of flight was required to point to the vertex within a transverse region which extends, e.g. for Pb–Pb, to mm in and mm in . To improve the signal quality, only those s have been retained for which the tracks cross again in the bending-plane projection after leaving the decay vertex (“cowboy” topology). The () candidates were required to lie in the regions of the Podolanski-Armenteros plot [15] 555The variable is defined as where and represent respectively the positive and negative decay track momentum component along the direction of motion of the . A detailed description of the use of the Podolanski-Armenteros variables to separate , and can be found in references [16, 12]., eliminating the bulk of the contamination from decays; the remaining contamination was then removed by demanding that the effective mass combination of the pair, treated as a pair, differs by more than MeV/ from the nominal mass. Finally, to remove background from photon conversions the transverse momentum of the decay tracks with respect to the line of flight was required to be greater than a few tens of MeV/.
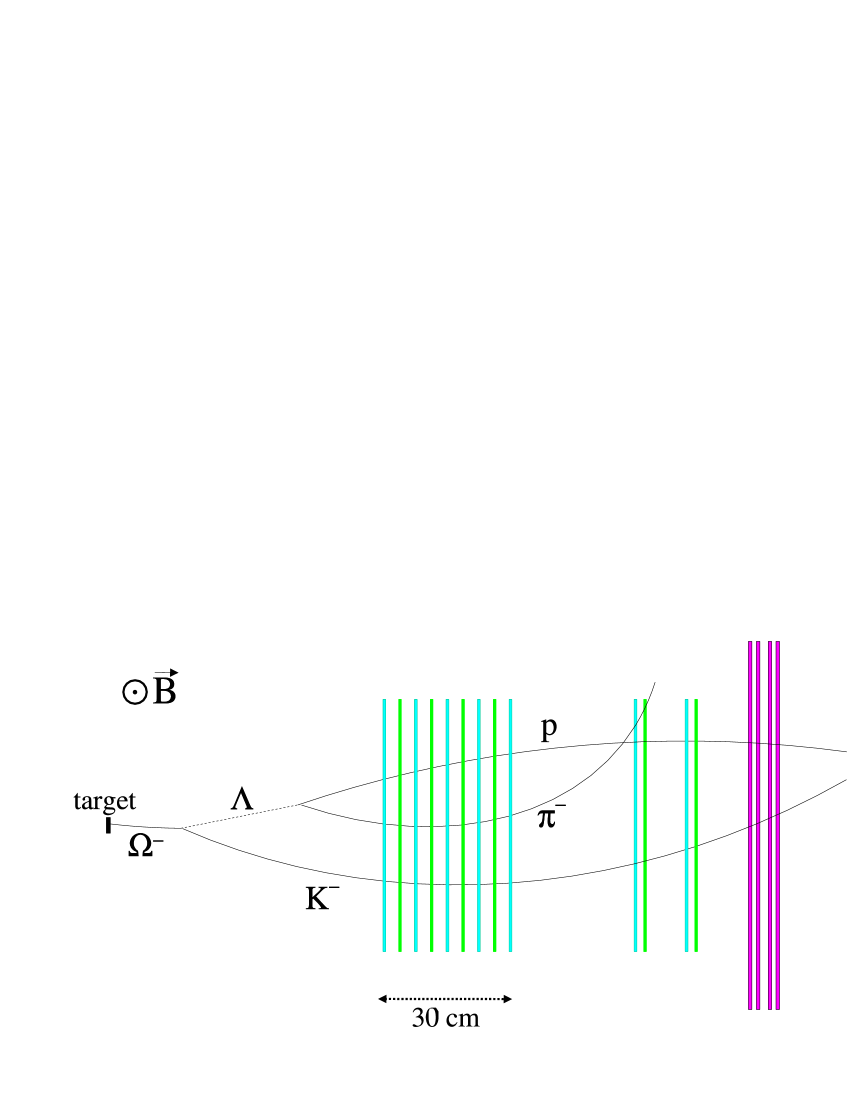
The cascade candidates were selected by combining a (required not to point to the vertex) with a charged track of the proper sign and requiring a set of conditions similar to those employed for the s (e.g., on the distance of closest approach between the and the charged track, on the fiducial region, on the impact parameter at the vertex). In addition, the decay vertex was required to be located downstream of the cascade decay vertex and the candidates were required not to be kinematically ambiguous with the decay of a . Figure 7 shows as an example a sketch of the reconstruction of the cascade decay for an .
Accurate knowledge of the position of the production vertex is crucial both for the selection analysis and for the subsequent correction procedure, explained in the next section. In the analysis of the pBe sample the vertex position has been calculated for each candidate by minimising the distance in space between the hyperon line of flight and the beam track measured by the beam telescope. In the Pb–Pb data sample, where the track multiplicity is large and a thinner target was used, the vertex has been determined on an event-by-event basis by averaging the intersections of the tracks extrapolated back to the target plane and then taking the average over a “run” (i. e., a data portion containing events). Finally, for the pPb data, where the track multiplicity is comparable to that for the pBe collisions but the longitudinal position of the vertex was better constrained due to the shorter target, the average over several events has been taken.
The quality of the NA57 data can be appreciated from figure 10, where the invariant mass spectra of p, , K combinations obtained after applying all the selection criteria are displayed.
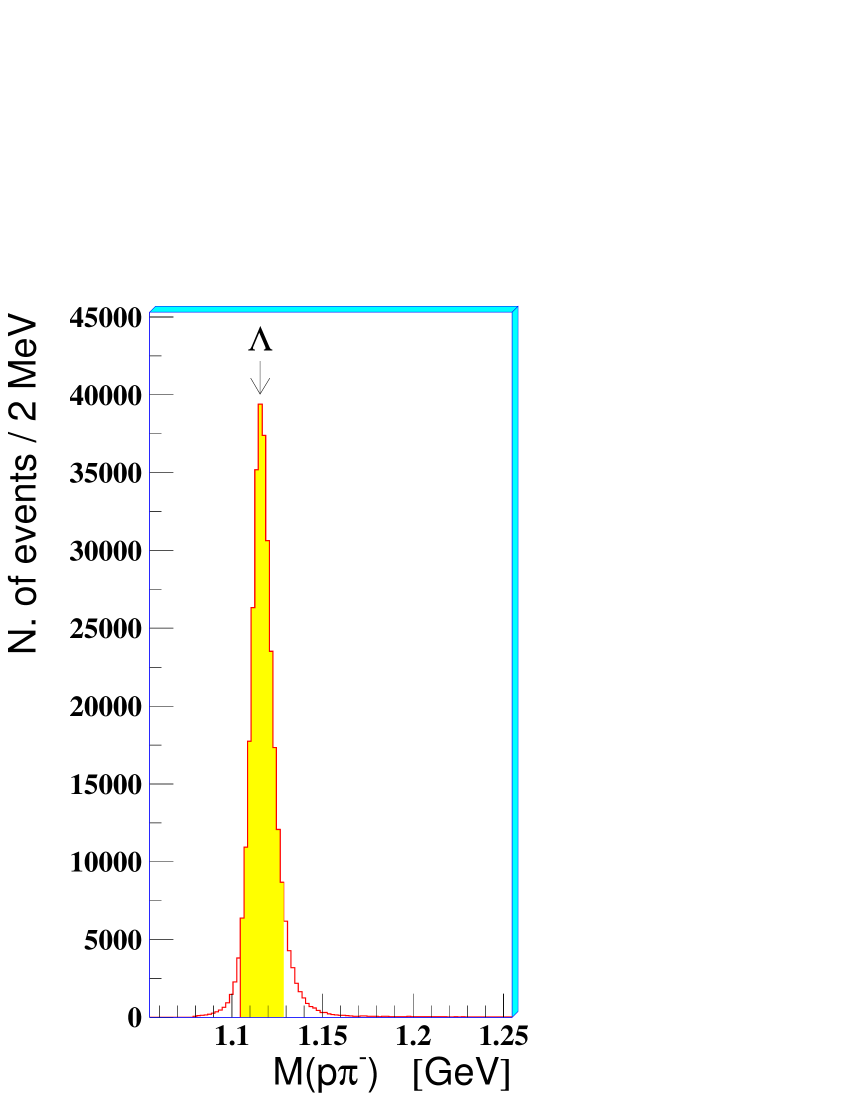
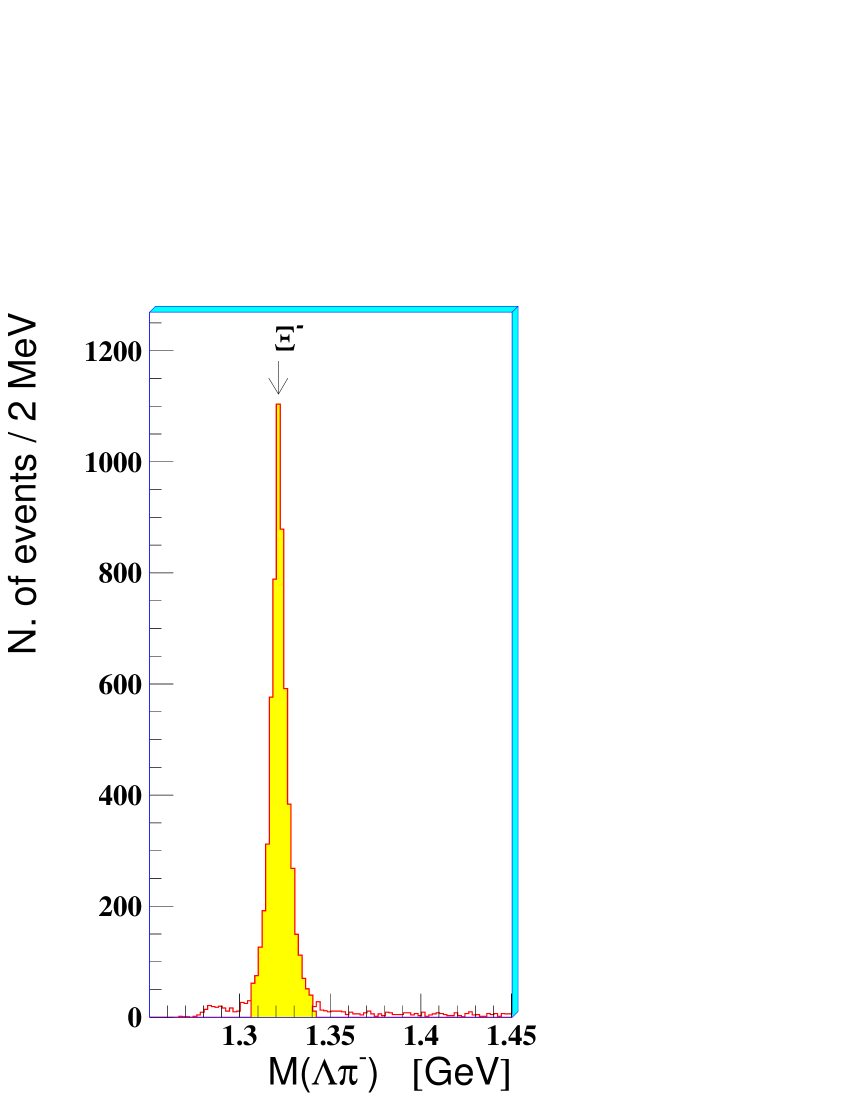
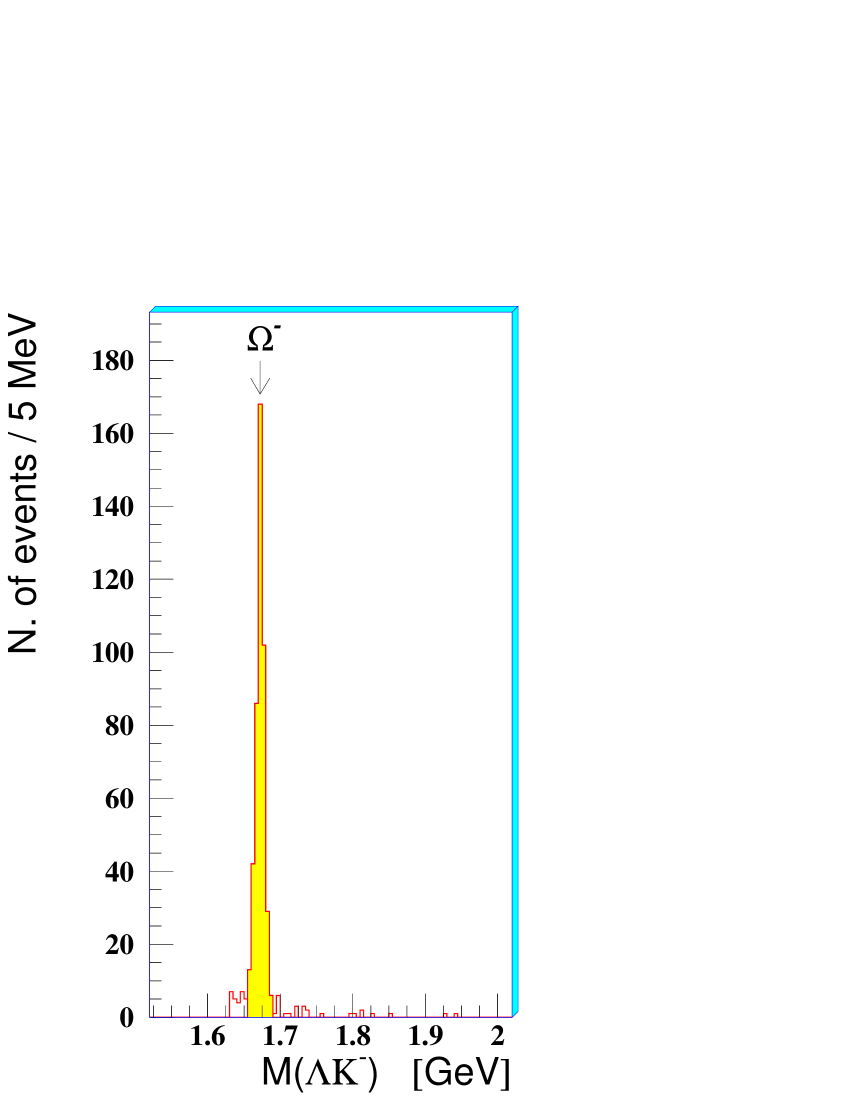
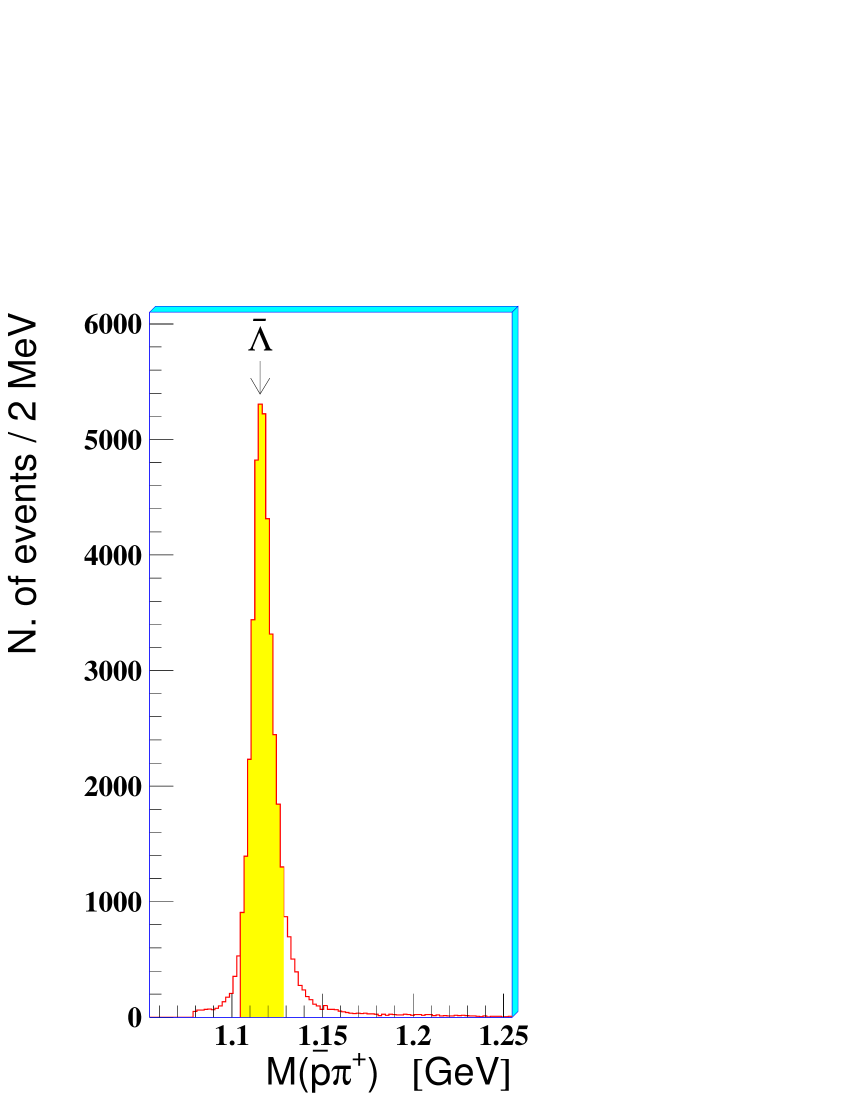

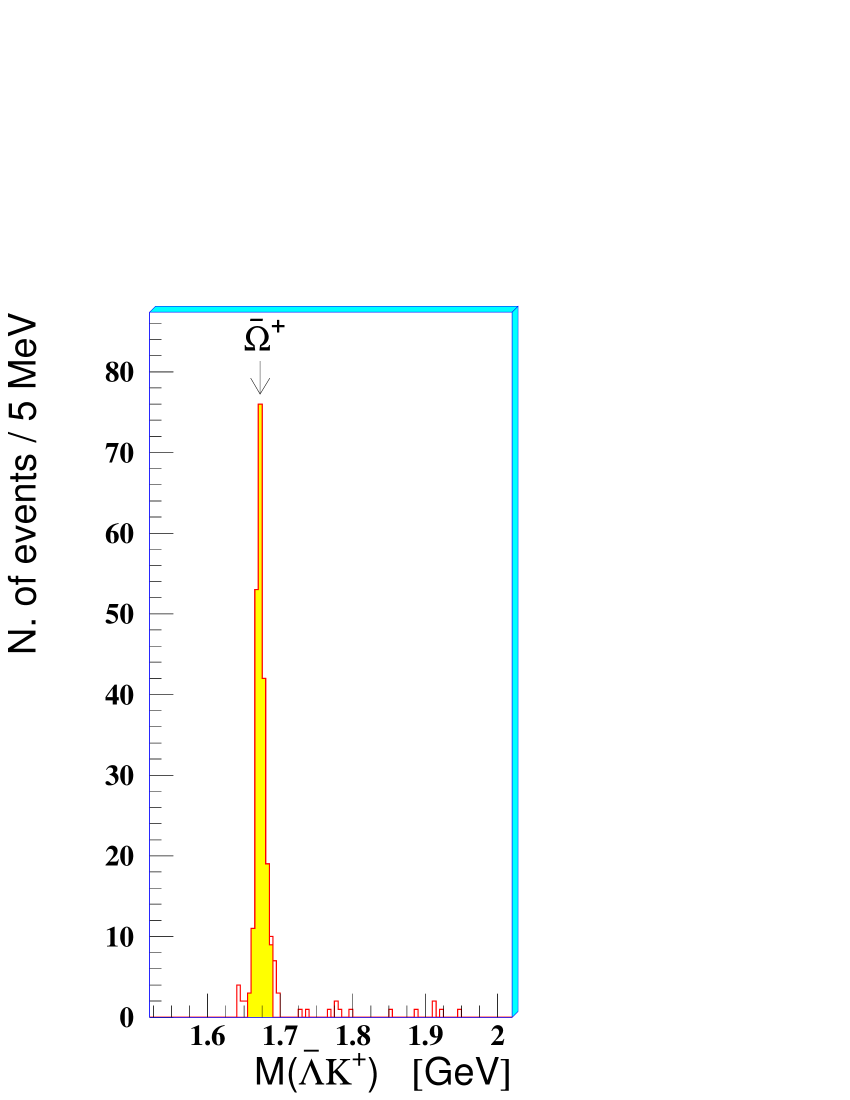
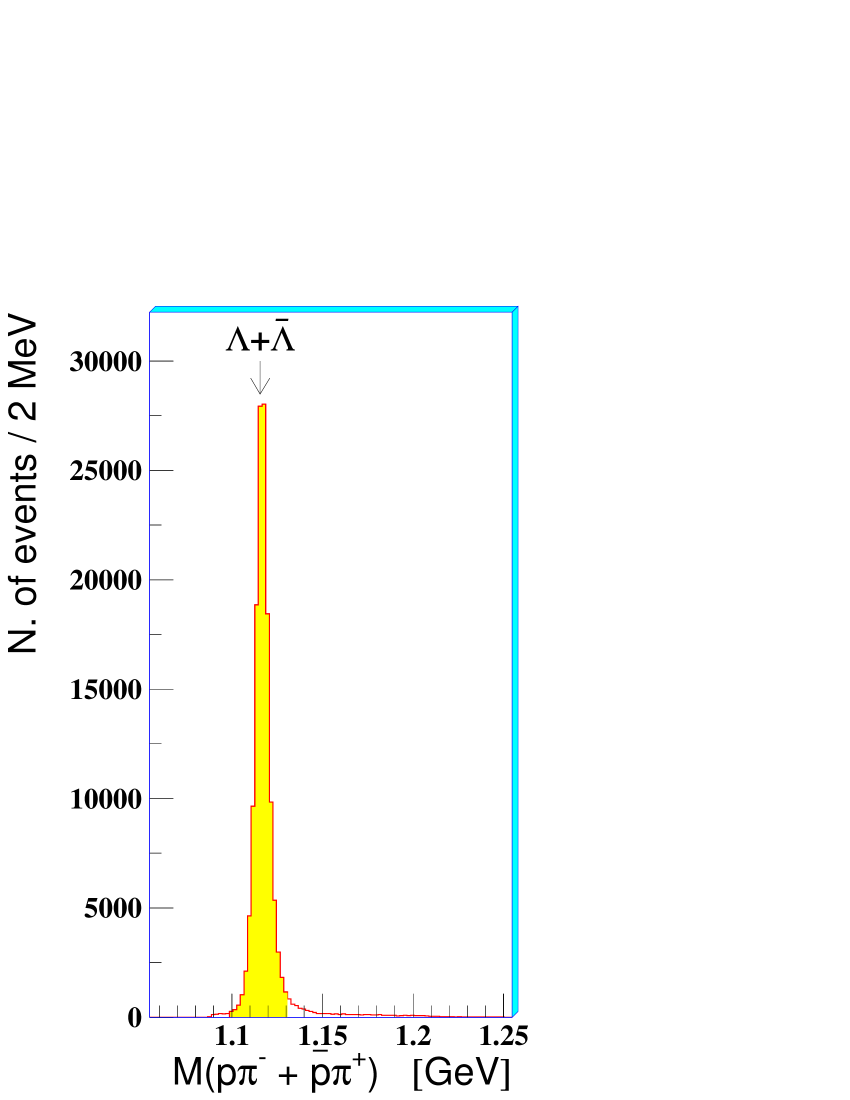

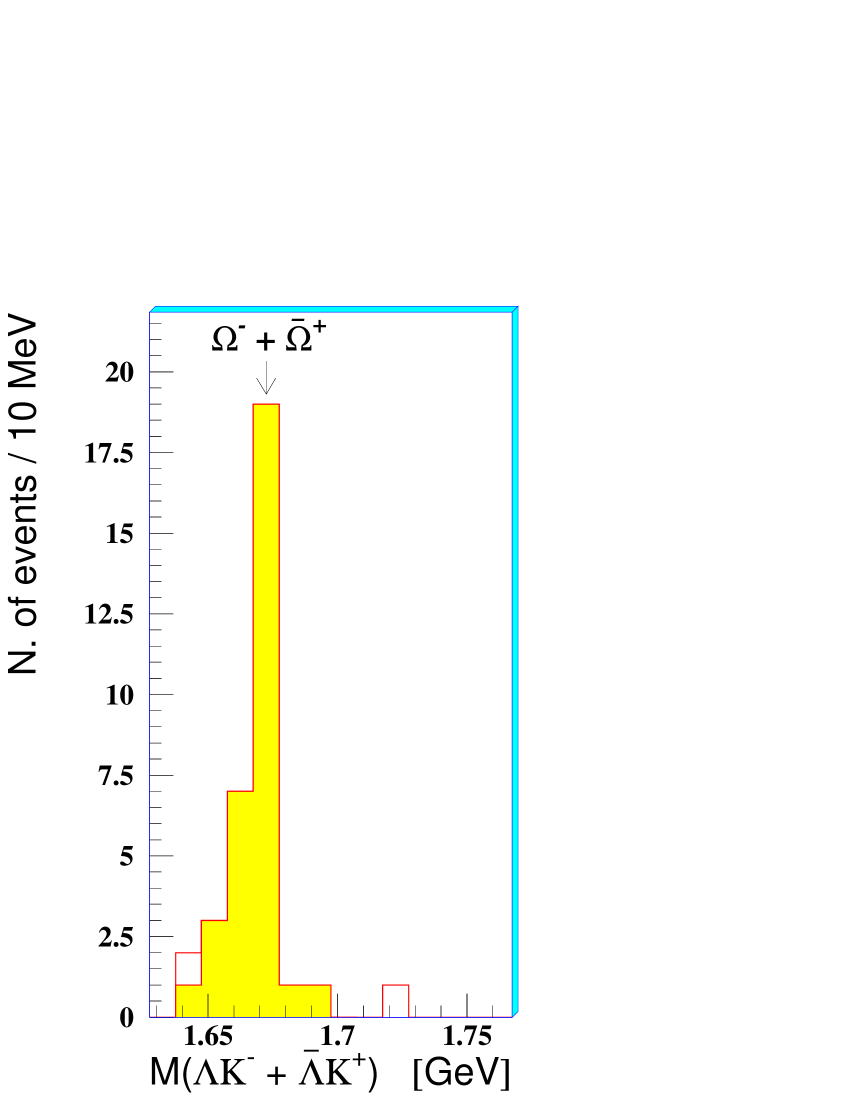
Hyperon peaks stand out over a small background; they are centred at the PDG values [17] with FWHM of about 10 MeV. The background level in figure 10 is very low; however a detailed study has been carried out, as explained in reference [18], in order to evaluate the residual combinatorial background. This has been found to be 0.3% and 1.2% for and respectively. For the cascade hyperons the background has been estimated to be less than 4% for and less than 6% for . It has been accounted for in the evaluation of the systematic errors.
The corresponding plots for the pBe data are shown in figure 10. The hyperon peaks are again well centred, with FWHM of about 6 MeV. Distributions of comparable quality were obtained for the pPb data.
3.2 Corrections for experimental biases
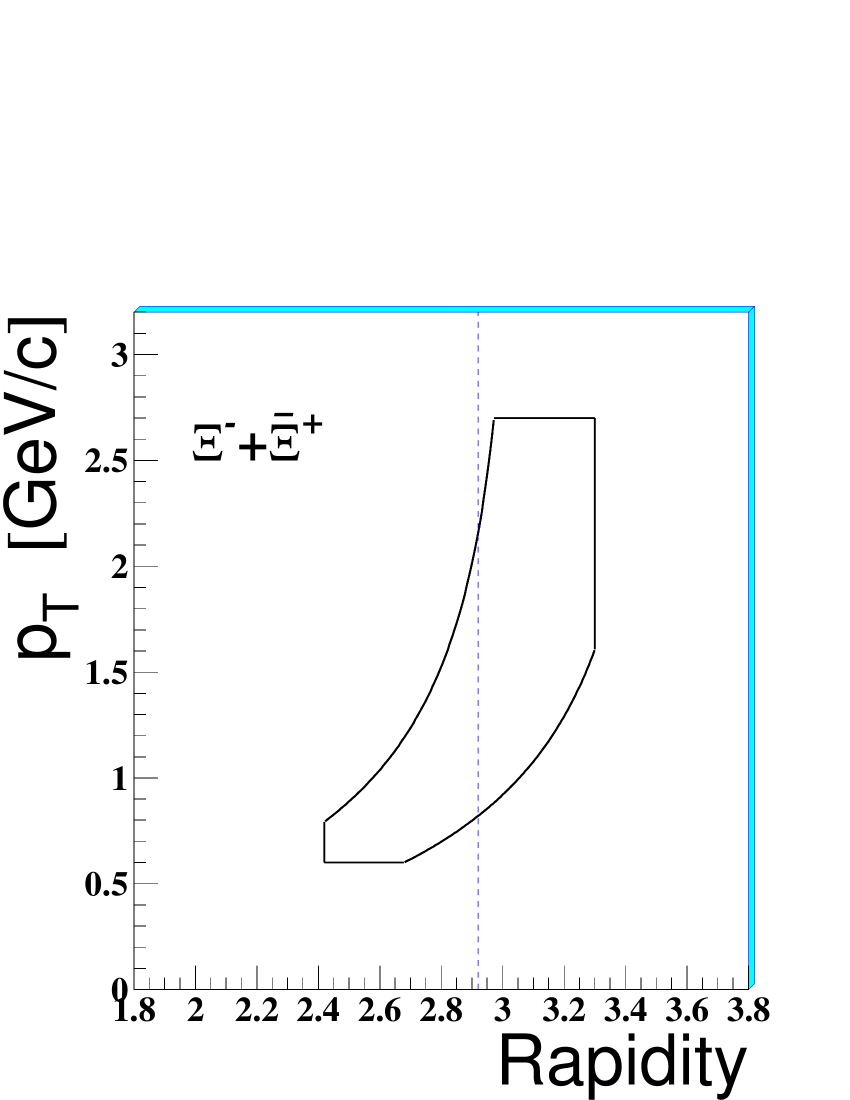
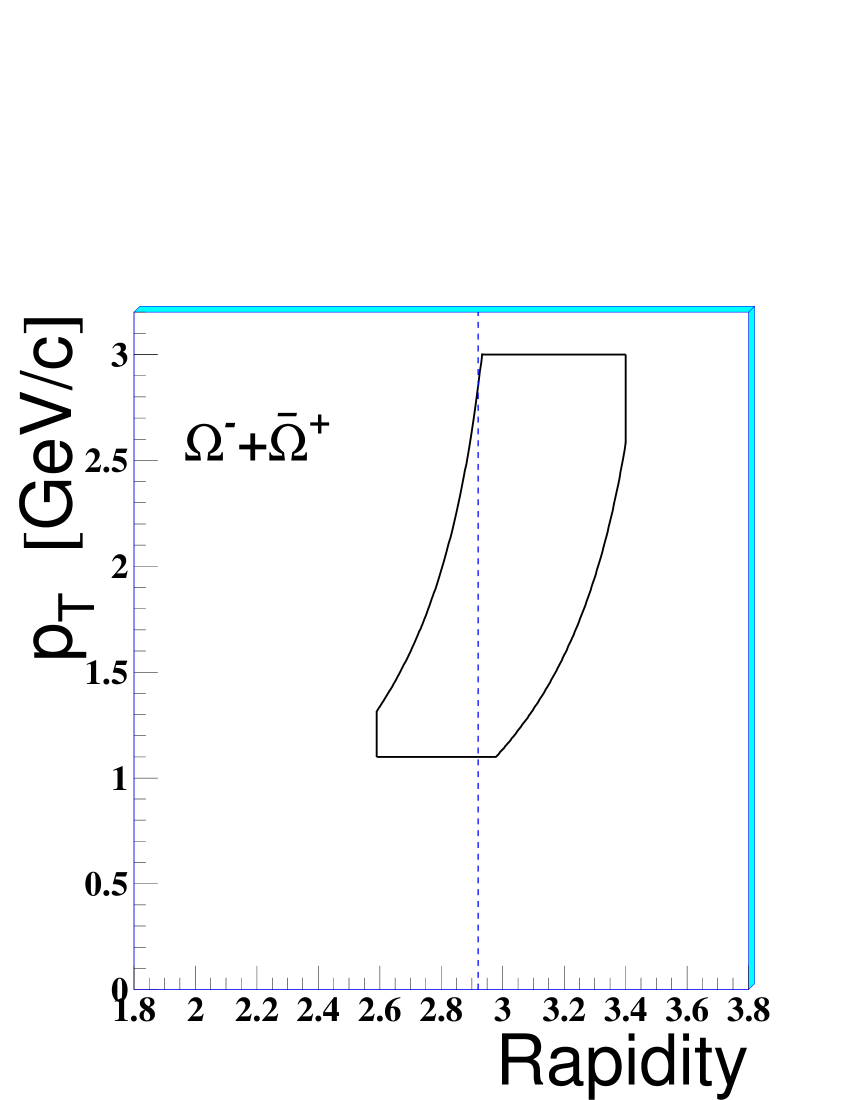
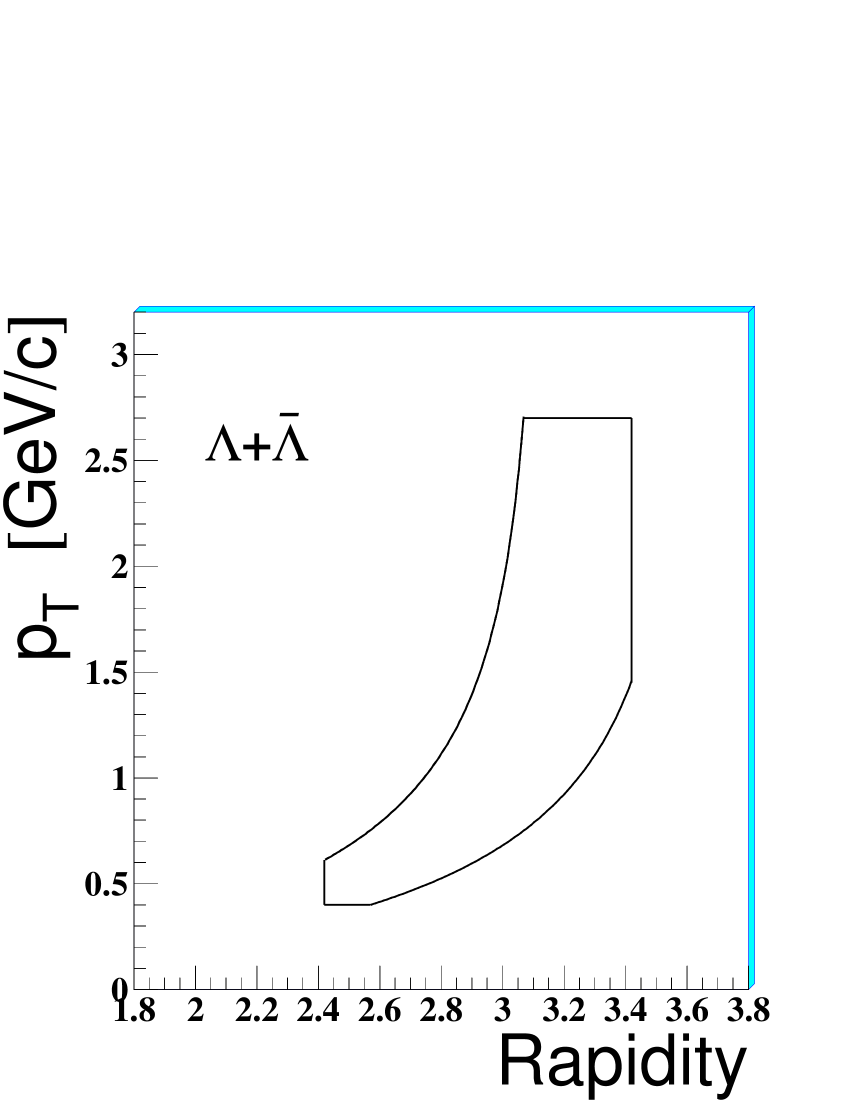
The NA57 and WA97 experiments have been designed to accept particles produced at central rapidity () and medium . The exact limits of the acceptance region depend on the particle species; they have been refined off-line using a Monte Carlo simulation of the apparatus in order to define fiducial acceptance windows excluding the borders where the systematic errors are more difficult to evaluate. Sketches of the – acceptance windows obtained for , and in Pb–Pb and pBe interactions are shown in figure 13 and 13, respectively. Those for pPb are similar to those for pBe interactions.


Data have been corrected for geometrical acceptance and for reconstruction and signal selection inefficiencies, using a Monte Carlo weighting procedure on a particle-by-particle basis. For each reconstructed hyperon, the measured values of rapidity and transverse momentum have been used to generate a large sample of Monte Carlo particles with random azimuthal angle and the primary vertex position distributed according to the measured beam profile. The generated particles were then propagated through the NA57 set-up, simulated using the GEANT3 detector description and simulation tool [19], and allowed to decay into the final states listed in equation 1 according to their lifetimes. The detector efficiencies have been determined individually for each read-out chip in the pixel planes and as an average for each microstrip plane, and were taken into account in the simulation.
For each Monte Carlo particle with all decay tracks passing the silicon telescope the influence of background tracks and of the electronic noise was simulated by embedding the hits generated by the Monte Carlo into a real event with hit multiplicity and reconstructed primary vertex position close to those of the original hyperon event. These mixed events were then processed by the same program chain (pattern recognition, track reconstruction, hyperon reconstruction and selection) as the real data. The resulting weight assigned to the real event was calculated as the ratio of the number of generated Monte Carlo events to the number of Monte Carlo events successfully reconstructed and passing through all the analysis criteria. An additional correction for the beam telescope efficiency has been applied for the pBe data.
The simulation program used for the calculation of the correction factors has been tested by comparing real and simulated distributions for all the main parameters used in the selection of the signals. A good agreement of real and simulated spectra has been found [18, 20].
We have calculated weights for all the reconstructed multi-strange particle candidates. However, the weighting procedure is very CPU intensive and therefore for the much more abundant and samples we only corrected a fraction of the total data in order to reach a statistical precision better than the limits imposed by the systematics.
Given the geometry of the two experiments the feed-down from weak decays is of minor importance. It has been estimated to be less than 5% for from and less than 10% for from ; for both and the feed-down from decays is less than 2%.
3.3 Centrality determination
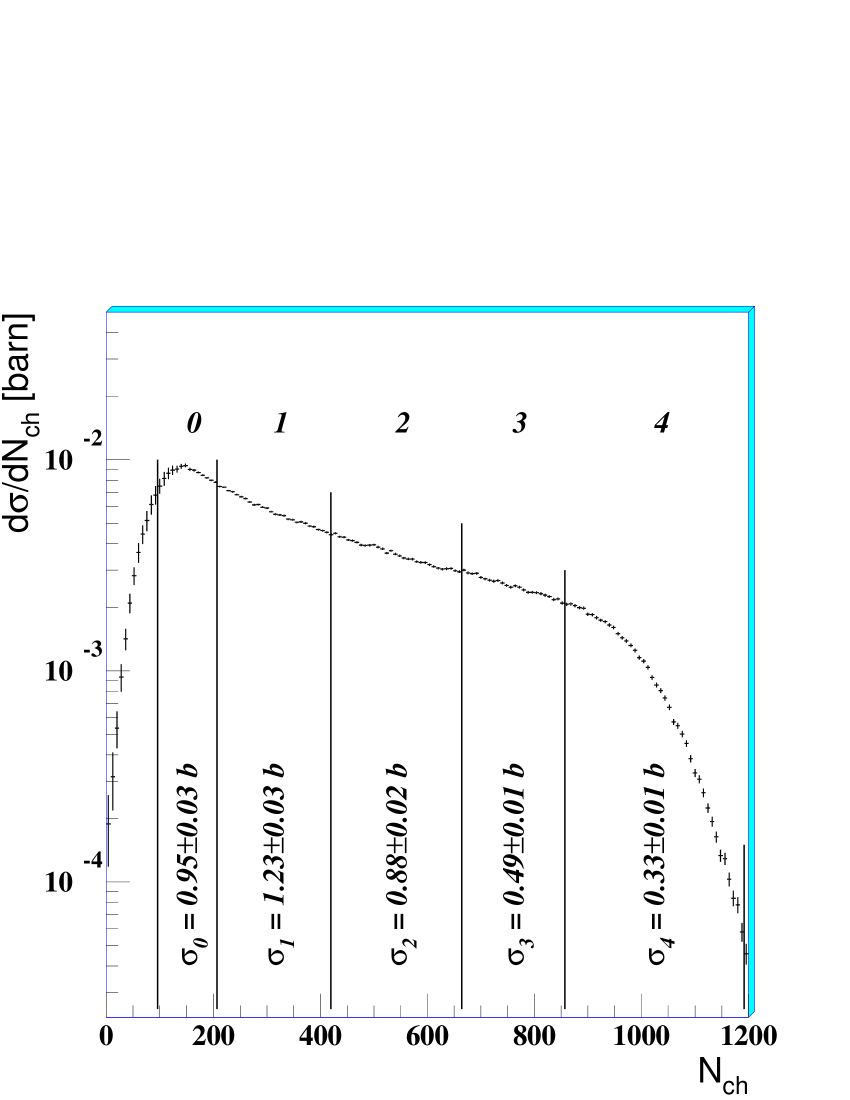
As a measure of the collision centrality we use the number of wounded nucleons [21, 22] extracted from the charged particle multiplicity measurement. The details of the multiplicity detector and reconstruction of the charged multiplicity distribution are described in [23, 24]. Figure 14 shows the charged particle multiplicity distribution for Pb–Pb collisions at 158 GeV/ as measured by the NA57 experiment. The drop at low multiplicities is due to the threshold of the centrality trigger. The data have been binned in five classes as indicated in figure 14. The events with multiplicity below class 0 have been excluded from the subsequent analysis; the final sample corresponds to the most central 53% of the Pb–Pb inelastic cross-section. The distribution of for the five multiplicity classes was computed from the measured trigger cross sections and a modified Wounded Nucleon Model fit to the multiplicity distribution using the Glauber model [21, 23]. The fractions of inelastic cross section for the selected classes, as well as the corresponding average numbers of wounded nucleons are shown in table 1.
| Class | |||||
|---|---|---|---|---|---|
| (%) | 40 to 53 | 23 to 40 | 11 to 23 | 4.5 to 11 | 0 to 4.5 |
The number of wounded nucleons in pBe collisions () and in pPb collisions () have been determined from a Glauber model calculation as an average over all inelastic collisions.
4 Particle yields and strangeness enhancements
The double differential cross sections for each particle under study were fitted using the expression
| (2) |
where is the transverse mass and is the rapidity. The inverse slope is interpreted as an apparent temperature due to the thermal motion coupled with a collective transverse flow of the fireball components [18, 25]. The fit was performed using the method of maximum likelihood, keeping as a free parameter. The complete results concerning the inverse slopes from the NA57 and WA97 experiments are given in references [18] and [26], respectively.
For the present analysis we assumed a flat rapidity distribution () in our acceptance region for all particles except in Pb–Pb; the rapidity distribution of the is significantly non-flat within our rapidity window and it has been parametrised as a Gaussian [27].
Using the parametrisation of the differential cross section given by equation 2 with the inverse slope values obtained from fits, we have determined the yield Y of each particle under study, extrapolated to a common phase space region covering the full range and one unit of rapidity centred at mid-rapidity :
| (3) |
Extrapolated yields were calculated for each centrality class (0–4) of Pb–Pb collisions. The resulting values are presented in table 2. We also report the yields for the pBe and pPb interactions measured in the WA97 experiment.The assumption of a flat rapidity distribution, in the case of asymmetric collisions (p–nucleus) induces a systematic error on the particle yields which is at most of order 5-6 % [28].
| 0 | 1 | 2 | 3 | 4 | |
|---|---|---|---|---|---|
| pBe | pPb | |
|---|---|---|
We have performed a number of stability tests, changing the choice of the acceptance region or the set of the analysis cuts, and analysing separately data samples taken with opposite magnetic field polarities and data samples recorded in different data taking periods [20, 12]. This study demonstrated good stability for the procedure for extracting yields. The overall systematic errors, both for particle yields and transverse mass distributions, are estimated to be about 10% for and and about 15% for .
Centrality classes 1 to 4 correspond to those of the WA97 experiment. In this common centrality range the yield values from the NA57 and WA97 experiments agree within 20-30%. This difference has been investigated [20] and has been understood as due mainly to a bias introduced by the treatment of the uncertainty in the position of the primary vertex in WA97. This comes about because of fluctuations in the beam-position. This bias has not affected the pBe and pPb data due to the greater stability of the proton beam; in addition, in the case of pBe the beam position was accurately measured with the beam telescope.
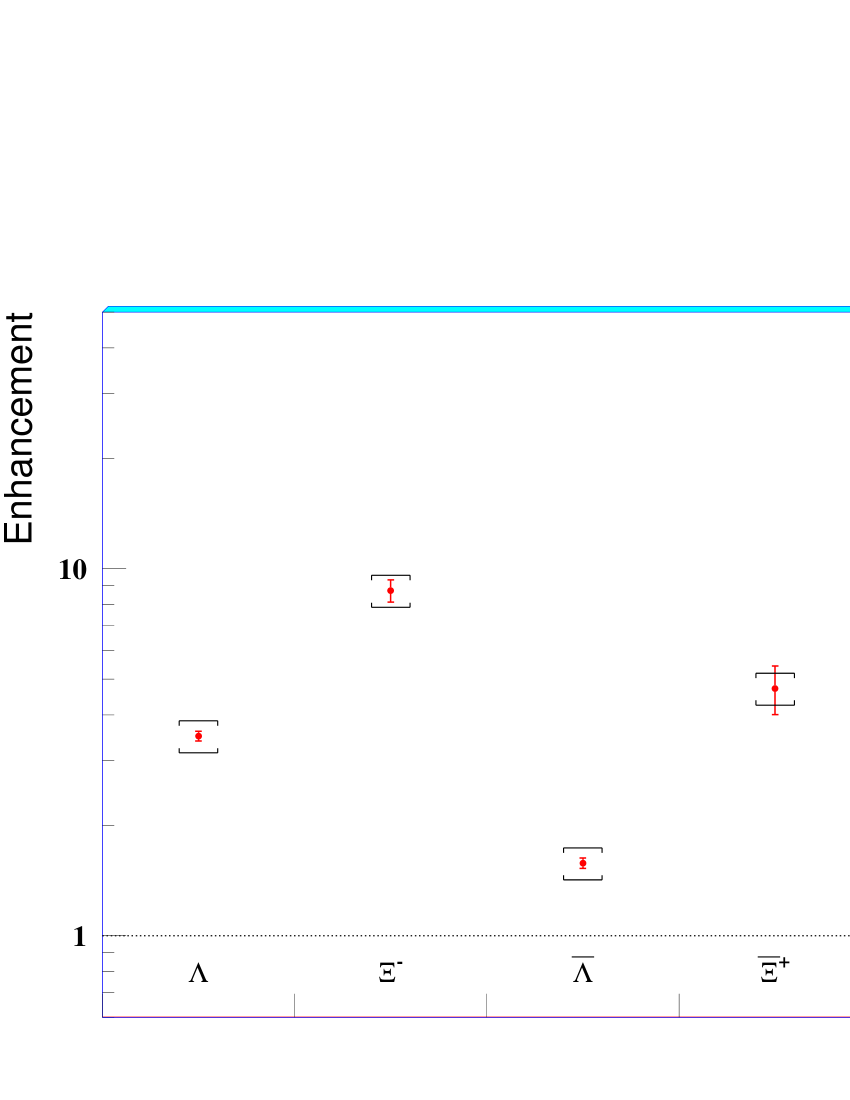
Using the extrapolated yields we have determined the strangeness enhancement E, which we define as the yield per participant in Pb–Pb (or pPb) collisions normalised to the yield per participant in pBe collisions:
| (4) |
The hyperon enhancements in the full centrality region (53% most central Pb–Pb events) are shown in figure 15 as functions of the strangeness content of the particle. A clear hierarchy of the enhancements is visible: they increase with the strangeness content of the particle, for both hyperons and antihyperons, reaching a factor of about 20 for the triply-strange .
The behaviour of the enhancements with the centrality of the collision is displayed in figure 16, where the NA57 data for the five centrality classes defined above are plotted as a function of the number of wounded nucleons, together with the pBe and pPb results from the WA97 experiment.
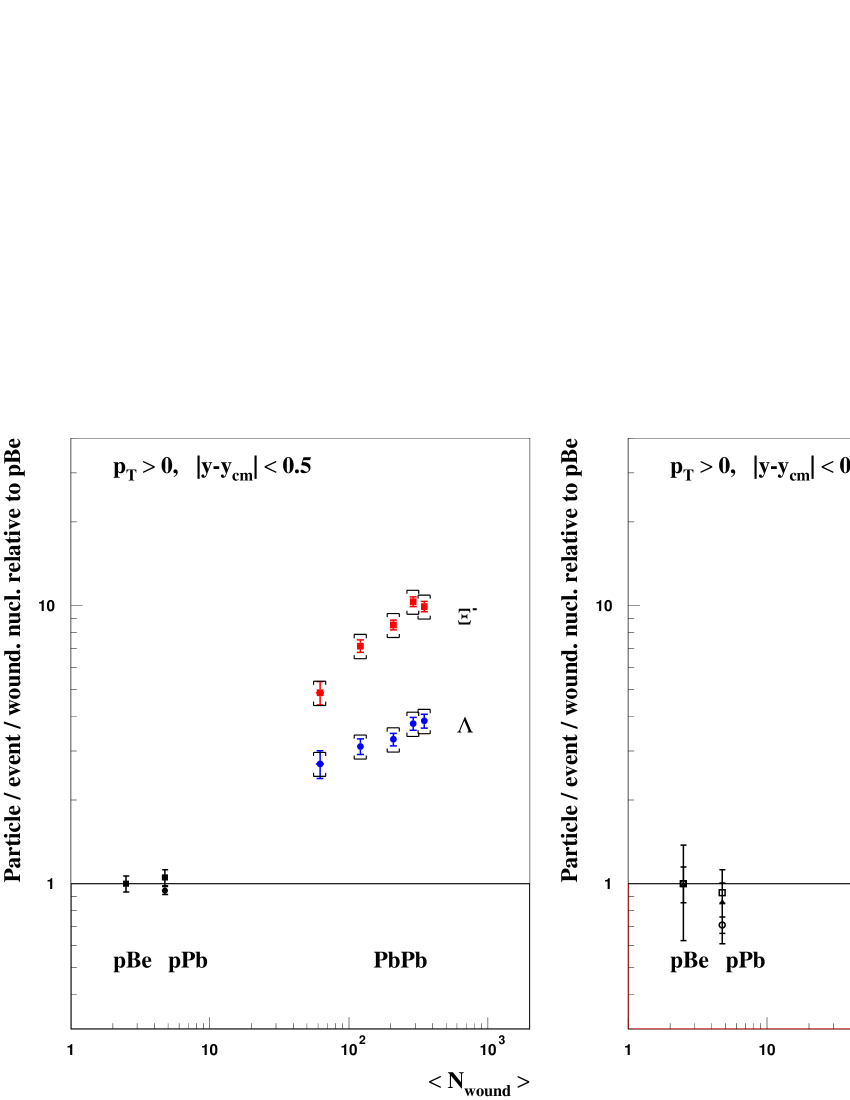
The enhancements are shown separately for particles containing at least one valence quark in common with the nucleon (left) and for the other particles (right), kept separate since in principle they may have different production features.
It is worth noting that the normalized yields for the pBe and pPb data are compatible with each other within the error limits, as expected from scaling.222For a discussion of the scaling in pA see reference [29]. The Pb–Pb data exhibit a significant centrality dependence of the enhancements for all particles except . However, for the two most central classes 3 and 4 ( of most central collisions) a saturation of the enhancements cannot be ruled out, in particular for and .
5 Discussion
The results presented above refine and extend the study of strangeness enhancements initiated by the WA97 experiment [28, 30]. In particular the increase of the magnitude of the enhancement with the strangeness content of the particles is confirmed, as expected in a QGP scenario [2]. The highest enhancement is measured for the triply-strange hyperon and amounts to about a factor 20 in the most central class.
In order to study the behaviour of the enhancements with the centrality of the collision, we have fitted the Pb–Pb data of figure 16 with a power law b Good fits were obtained for all particles except and , for which a possible saturation in the most central classes cannot be ruled out, as mentioned above. Excluding from the fit the two most central values gives good also for the and distributions. The results of the fits are shown in figure 17 superimposed on the enhancement distributions; the values of the exponent are given in table 3.
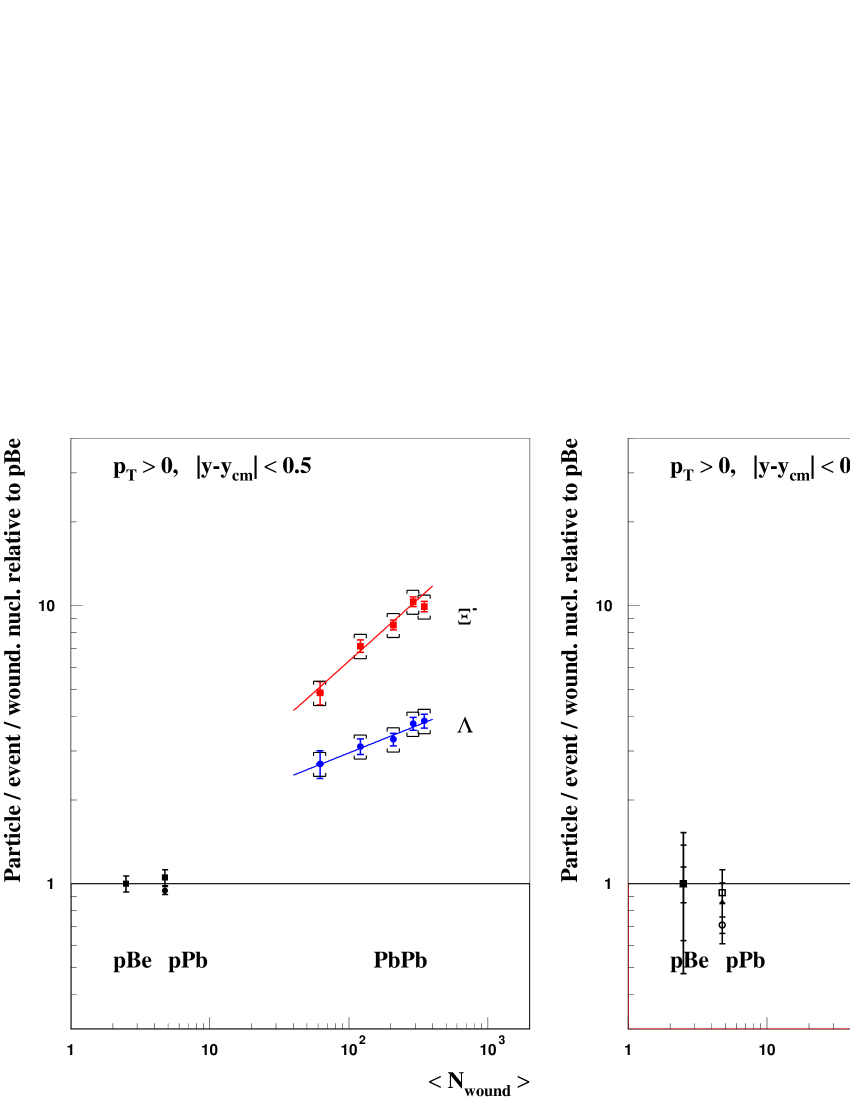
From figure 17 and table 3 one can see that for all multistrange hyperons and antihyperons we measure similar values of the exponent . The enhancement is slightly less centrality dependent, while the enhancement is compatible with being flat with centrality. Given the similarity of the behaviour of doubly and triply-strange hyperons and antihyperons, the difference between and is surprising. This could be due to a difference in the initial production mechanism, or it could be the consequence of, e.g., a centrality-dependent absorption in a nucleon-rich environment. It is worth recalling, as described in section 4, that within the NA57 acceptance is the only strange baryon for which we observe a significantly non-flat rapidity distribution, which we parametrised as a Gaussian [27].
Extrapolating down to 1 the curves of figure 17, all of them miss the pPb points by more than 6 standard deviations, with the exception of that of which is fully compatible with the pPb point. They also miss the pBe points by a number of standard deviations ranging from 2 to 27. As already mentioned, we observe scaling between pBe and pPb; therefore, our data disfavour the hypothesis of a regular increase (power law-type) of the enhancements with centrality starting from pA.
6 Conclusions
The hyperon yields per wounded nucleon at 158 GeV/ are enhanced with respect to pBe and pPb interactions, these two being compatible with scaling. As already observed by the predecessor WA97 experiment, the global enhancement in the full centrality region (53% most central Pb–Pb events) increases with the content of valence strange quarks, reaching a factor of about 20 for the triply-strange . This pattern is consistent with the QGP creation hypothesis, while it is hard to accomodate it into standard hadronic transport models. We observe a significant centrality dependence of the strangeness enhancement for all hyperons and anti-hyperons except for the . The enhancements increase with centrality according to a power law whose exponents are compatible for multistrange hyperons and antihyperons, a factor two smaller for the , while the enhancement exhibits no centrality dependence. A saturation of the yields per participant cannot be ruled out, at least for the most central collisions.
References
References
- [1] Cabibbo N and Parisi G 1975 Phys. Lett.B 59 67 For a recent review see Quark Matter Conference Proceedings 2004 J. Phys. G: Nucl. Phys.30 s633-s1430
- [2] Rafelski J and Müller B 1982 Phys. Rev. Lett.48 1066 Rafelski J and Müller B 1986 Phys. Rev. Lett.56 2334 Koch P, Müller B and Rafelski J 1986 Phys. Rep. 142 167 Rafelski J 1991 Phys. Lett.B 262 333
- [3] Caliandro R et al“NA57 Proposal”, 1996 CERN/SPSLC 96-40 SPSLC/P300
- [4] Armenise N et al“WA97 Proposal” 1991 CERN/SPSLC 91-29 SPSLC/P263
- [5] Manzari V et al1999 J. Phys. G: Nucl. Phys.25 473 Manzari V et al1999 Nucl. Phys.A 661 716c Virgili T et al2001 Nucl. Phys.A 681 165c
- [6] Alexeev G et al1995 Nucl. Phys.A 590 139c Andersen E et al1998 Nucl. Phys.A 630 582c Elia D et al1999 Nucl. Phys.A 661 470c
- [7] Heijne E H M et al1994 Nucl. Instrum. MethodsA 349 138 Antinori F et al1995 Nucl. Instrum. MethodsA 360 91 Middlekamp P et al1996 Nucl. Instrum. MethodsA 377 532
- [8] Campbell M et al1994 Nucl. Instrum. MethodsA 342 52
- [9] Heijne E H M et al1996 Nucl. Instrum. MethodsA 383 55
- [10] Bovet C et al1982 CERN Yellow Report CERN 82-13
- [11] Abatzis S et al1995 Nucl. Phys.A 590 317c Abatzis S et al1997 Phys. Lett.B 400 239 Sandor L et al1999 Nucl. Phys.B (Proc. Suppl.) 71 270
- [12] Bruno G E 2002 Ph.D. Thesis “Studio della produzione di particelle strane e della dinamica di espansione in collisioni nucleari ultra-relativistiche all’SPS” University of Bari (Preprint nucl-ex/0402014)
-
[13]
Norman P I 1999 Ph.D. Thesis
“Hyperon production in Lead-Lead and
Proton-Beryllium Interactions ” University of Birmingham
http://www.ep.ph.bham.ac.uk/publications/thesis/pin_thesis.ps.gz Thompson M 1999 Ph.D. Thesis “Hyperon Production in Proton-Beryllium Interactions at the WA97 CERN Experiment” University of Birmingham
http://www.ep.ph.bham.ac.uk/publications/thesis/mt_thesis.ps.gz - [14] Caliandro R 2000 Ph.D. Thesis “Produzione di particelle strane in interazioni piombo–piombo e protone–piombo a 160 GeV/ per nucleone” University of Bari (Preprint nucl-ex/0509029)
- [15] Podolanski J and Armenteros R 1954 Phil. Mag. 45 13
- [16] Abatzis S et al1990 Phys. Lett.B 244 130
- [17] Eidelman S et al2004 Review of Particle Properties Phys. Lett.B 592 1
- [18] Antinori F et al2004 J. Phys. G: Nucl. Part. Phys.30 823
- [19] GEANT, CERN Program Library Long Writeup W5013
- [20] Fanebust K et al2002 J. Phys. G: Nucl. Part. Phys.28 1607
- [21] Glauber R J 1959 Lectures in Theoretical Physics edited by Brittin W E and Dunham L G Interscience New York 1 315.
- [22] Białas A, Bleszyński M and Czyż W 1976 Nucl. Phys.B 111 461
- [23] Carrer N et al2001 J. Phys. G: Nucl. Part. Phys.27 391
- [24] Antinori F et al2005 J. Phys. G: Nucl. Part. Phys.31 321
- [25] Bearden I G 1997 Phys. Rev. Lett.78 2080
- [26] Fini R A et al2001 Nucl. Phys.A 681 141c
- [27] Antinori F et al2005 J. Phys. G: Nucl. Part. Phys.31 1345
- [28] Andersen E et al1999 Phys. Lett.B 449 401
- [29] Antinori F 2004 J. Phys. G: Nucl. Phys.30 s725
- [30] Antinori F et al1999 Nucl. Phys.A 661 130c