Application of the Time of Flight Technique for Lifetime Measurements with Relativistic Beams of Heavy Nuclei
Abstract
A novel method for picosecond lifetime measurements of excited -ray emitting nuclear states has been developed for fast beams from fragmentation reactions. A test measurement was carried out with a beam of 124Xe at an energy of 55 MeV/u. The beam ions were Coulomb excited to the state on a movable target. Excited nuclei emerged from the target and decayed in flight after a distance related to the lifetime. A stationary degrader positioned downstream with respect to the target was used to further reduce the velocity of the excited nuclei. As a consequence, the -ray decays from the excited state that occurred before or after traversing the degrader were measured at a different Doppler shift. The -ray spectra were analyzed from the forward ring of the Segmented Germanium Array; this ring positioned at 37∘ simultaneously provides the largest sensitivity to changes in and the best energy resolution. The ratio of intensities in the peaks at different Doppler shifts gives information about the lifetime if the velocity is measured. The results and range of the application of the method are discussed.
1 Motivation
Electromagnetic transition matrix elements are vitally important for nuclear structure studies. These matrix elements can be extracted if the information on the transition rate or lifetime is available for the state of interest. Picosecond-range lifetimes of excited nuclear states which decay by -ray emission can be reliably measured using Doppler shift methods; in particular, the Recoil Distance Method, also known as the plunger technique, see for example Refs. [1, 2].
Exciting research opportunities to study nuclei far from stability have opened recently at the National Superconducting Cyclotron Laboratory following the construction of the Coupled Cyclotron Facility [3]. These nuclei are produced in fragmentation reactions at primary beams energies of 140 MeV/u [4]. The fragments of interest are selected and identified on an event by event basis using the A1900 magnetic spectrograph [5]. The relativistic energies of secondary beams result in significant Doppler shifts for -rays following the secondary reactions. In fact, the Doppler broadening of -ray peaks resulting from momentum distribution of the secondary reaction products as well as from -ray detector opening angles is known to be the limiting factor in the application of high-resolution spectroscopy in relativistic beam facilities [6]. The current paper reports on a method of utilizing these large Doppler shifts for picosecond lifetime measurements using a relativistic plunger technique.
2 Experimental Method
In the reported experiment a beam of 124Xe at an initial energy of 140 MeV/u was provided by the Coupled Cyclotron Facility at the National Superconducting Cyclotron Laboratory [3]. The primary beam was degraded in the fragmentation target of the A1900 separator [5] and delivered at an average energy of 54.9 MeV/u to the plunger apparatus installed at the target position of the S800 spectrometer [7]. The A1900 momentum acceptance cut was set to 0.5% and it was estimated that the plastic scintillator detectors used downstream from the A1900 contributed less than 0.02% to the beam momentum spread.
In the plunger apparatus the beam ions were Coulomb excited to the 2 state on a movable 93Nb target with a thickness of 91.5 mg/cm2. Excited projectiles emerged from the target with velocity =0.278(1) and -decayed in flight after a distance governed by the lifetime of the 124Xe first excited state. A stationary 79.5 mg/cm2 27Al degrader positioned downstream with respect to the target was used to further reduce the velocity of these excited nuclei to =0.178(1). The -ray intensity measurements were carried out using the Segmented Germanium Array SeGA [8] centered on the degrader foil. Four target-degrader distances of =15.8 mm, 10.5 mm, 5.3 mm and a contact between target and degrader foils at =0 mm were investigated. The separation between target and the degrader was fixed using thin cylindrical aluminum spacers and the precision of the spacer length measurement was better than 0.1 mm.
Depending on whether the -ray decay occurred in flight between target and degrader or if the decay occurred after slowing down in the degrader, the -rays exhibited different Doppler shifts. The resulting -ray spectra shown in Fig. 1 exhibit two peaks; the higher-energy peak corresponds to the -rays emitted before traversing the degrader while the lower-energy peak corresponds to -rays emitted after the degrader. From the relative intensity of the peak areas as a function of target-degrader distance, the lifetime of the state can be inferred as discussed in Sec. 3.
After passing through the degrader the nuclei were analyzed in the S800 spectrometer. Coincidence events corresponding to a -ray detection in the SeGA array and a beam particle detection in the E1 plastic scintillator detector at the S800 focal plane [9] were recorded for off-line analysis. In addition, the number of particles detected by the S800 E1 plastic scintillator was monitored and stored in intervals of five-second; these data were used for normalization of -ray intensities measured at different target-degrader separations. The readouts from the S800 focal plane Ionization Chamber were present in the data stream and were used in the off-line analysis for particle identification discussed in Sec. 5.1. The average rates for the experiment were 23000 particles per second at the S800 focal plane and 1700 particles per second in SeGA with the SeGA/S800 coincidence rate of 60 per second. The average live time of the data acquisition system was 98% and constant for runs at different target-degrader separation.
An important difference between the plunger technique applications at intermediate energies of 55 MeV/u reported in this paper and the analogous technique near the Coulomb barrier energies of 5 MeV/u is a significant contribution from the reactions on the degrader to the measured -ray intensity. In the current work the experimental information on that contribution has been identified from a separate run with the 27Al plunger degrader foil in place but with the excitation target removed from the field of view of the SeGA detectors. To assure that the beam energy in this run is matched to that of the runs at smaller target-degrader separations the beam passed through the 91.5 mg/cm2 93Nb foil mounted 60 cm upstream of the plunger degrader. From these data it has been verified that the -rays following the reactions on the degrader are emitted at the Doppler shift corresponding to the velocity and thus are indistinguishable from the -ray decays from excitation on the plunger target which are emitted after traversing the degrader. The impact of the reactions on the degrader on the extracted lifetime is discussed further below.
3 Lifetime Measurement with the Time of Flight Technique
Coulomb excitation at the 55 MeV/u energy of interest for the current experiment is known to be predominantly a single step process [10]. For a case of a single level without any feeding, the number and of rays detected for states decaying between the target and the degrader and downstream from the degrader, respectively, are given by the relations:
| (1) | |||||
| (2) |
with and being related to the lifetime through:
| (3) |
| (4) |
Above, stands for the number of states excited in the target, while and are the efficiencies for detection of rays emitted at point for the decays between the target and the degrader and downstream from the degrader, respectively. For the distance parameters, is the measured target/degrader separation, the is the offset between the measured and the true target/degrader separation, the is the length by which the plunger degrader foil is misaligned with respect to the center of the -ray array, and is the degrader thickness. The upper integration limit in Eq. 2 corresponds to the largest distance from the target at which -ray decays can still be detected in the SeGA array. In the current experiment this distance is significantly larger than and and can safely be assumed. The symbols for the plunger target/degrader foil alignment are further explained in Fig. 2.
In Eq. 2 it has been assumed that the decays in the degrader occur at the projectile velocity . This approximation is valid for the current experiment since the thickness of the degrader mm is significantly smaller than mm. For thick degraders, the relevant correction has to be determined based on the energy loss of the beam nuclei in the degrader; however, it should be noted, that such a correction is not going to alter the dependence of on d, which is of interest for the lifetime measurement.
In Sec. 4 the efficiencies and simulated with the Monte Carlo GEANT4 code [11] are discussed; these simulations demonstrate that these efficiencies can be well approximated with a second order polynomial in
| (5) |
In this case:
| (6) | |||||
| (7) |
with
| (8) | |||||
| (9) | |||||
| (10) |
If a -independent contribution from reactions on the degrader is taken into account the final formula for reads:
| (11) |
It should be pointed out that the depends exponentially on the target/degrader separation , while there are -dependent efficiency corrections to the number of decays between the target and the degrader as given by Eqs. 6 and 9.
The above formulae demonstrate that the number of decays upstream and downstream from the degrader is defined by the target/degrader separation and the velocity between the target and the degrader. Thus, the lifetime of the state of interest can be extracted from the measured intensity variation of and as a function of if the velocity is measured at the same time. The intensity variations of and as a function of can be measured from the number of counts in the low- and high-energy component of the peak corresponding to the transition of interest normalized to the beam current integrated over the time of the run. The measurement of these experimental observables provides the basis for the current method of lifetime determination.
4 Efficiency of -ray detection
It is argued in the previous section that the dependence of the efficiency for -ray detection on the position of a decay along the beam axis is of importance for the application of the current method. Since relativistic effects have a significant impact on the -ray detection efficiency, this dependence has been studied for the purpose of the current experiment using a Monte Carlo GEANT4 [11] simulation code. The code was set up to include major parts of the plunger apparatus used in the experiment and provided segment energy deposits for detected -rays in a single simulated SeGA detector.
The following effects were taken into account in the simulations:
-
•
The dependence of the solid angle covered by the detector on the position of the decay.
-
•
Attenuation of the -ray flux by the elements of the plunger and the beam tube.
-
•
The Doppler shift of the -ray energy depending on the source velocity and the direction of the -ray emission.
-
•
The response of the detector to rays at Doppler shifted energies (monochromatic sources of radiation were assumed in the moving reference frame).
-
•
The angular distribution of -rays in the source reference frame.
-
•
The relativistic beaming of -ray in the laboratory reference frame from the source being in motion (so called “Lorentz boost”). The beaming can be seen from a relation between the -ray emission angle in the laboratory frame and the -ray emission angle in the frame of a nucleus:
(12) which result in the following relation
(13) between the differential solid angles and in the laboratory and the moving frame of a nucleus, respectively. The “Lorentz boost” results in increased probability of a -ray emission in the direction of motion of the source despite of the forward/backward symmetry of the angular distribution in the moving reference frame.
It should be pointed out here that for the above items only the response of the detector to -rays at non-Doppler shifted energies, the change of the solid angle and the attenuation of the -ray flux by the experimental setup can be measured with calibration sources. All other effects can not be measured directly and need to be calculated.
The -ray efficiency has been evaluated for the current experiment assuming three different cases of angular distributions in the moving reference frame.
-
•
The angular distribution with coefficients =-0.64 and =-0.22 resulting from the intermediate energy Coulomb excitation calculated for the current experimental conditions according to Ref. [12].
- •
-
•
Isotropic angular distribution.
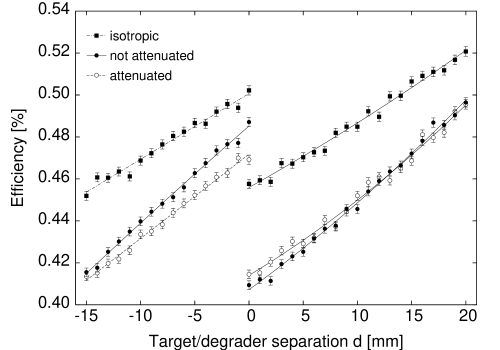
The results of calculations for the target/degrader separation mm are presented in Fig. 3. The discontinuity observed in this figure at mm arises predominantly from the change of relativistic beaming after slowing down in the degrader. The efficiency increase as a function of is understood from the fact that the points of decay in the considered range of are closer to the detector in the SeGA ring at 37∘ as increases. This is true at for states with lifetimes on the order of tens of picoseconds which decay within a few centimeters away from the target.This assumption, however, has to be verified if longer lifetimes are investigated with the current method. The trends observed in Fig. 3 justify the second order approximation for the efficiency dependence on employed in Sec. 3. The efficiency coefficients fitted to the simulation data are summarized in Tab. 1 and the resulting fits are plotted in Fig. 3.
5 Experimental Results
5.1 Particle Identification
Events that corresponded to the de-excitation process of 124Xe were selected using a combination of SeGA [8] and detectors at the focal plane of the S800 spectrometer [7, 9]. SeGA-S800 time coincidence was measured on an event-by-event basis starting when the SeGA array detected a -ray and stopping when the nucleus reached the E1 plastic scintillator at the focal plane of the S800 downstream from the degrader. The -ray energy dependent time gates compensating for a time-walk resulting from different signal amplitudes in the SeGA detectors were used off-line to improve the peak to background ratio. An S800 focal plane gate was created to select events that corresponded to a 124Xe nucleus based on the measured energy loss recorded by the E1 plastic scintillator and the ion chamber. The final particle identification (PID) gate was a combination of the time-energy gate and the S800 focal plane gate. The improvement in the signal to noise ratio from the initial value of 0.31 in the region corresponding to the two peaks to the final value of 0.50 after the application of the particle identification gate can be seen in Fig. 4.
5.2 Velocity Measurement
The precision and accuracy of the velocity measurement for the decays between the target and the degrader has a direct impact on the precision and accuracy of the lifetime measurement with the current technique, see Sec. 3. Below it is argued that from the Doppler shift of -ray energies emitted in flight, the error on the velocity measurement given by a standard deviation can be reduced to less than 0.3%, and a precise lifetime can be extracted.
The SeGA detectors are electronically divided into 32 segments which form 8 slices at different polar angles [8]. Gamma-ray energies recorded in each of the 8 slices of individual SeGA detectors were used to measure velocity of the 124Xe nuclei through the observed Doppler shift of the 354 keV transition depopulating the 2+ first excited state. The non-Doppler corrected spectra corresponding to the SeGA slices and the PID gate described in Sec. 5.1 were sorted for each target-degrader separation distance. The effect of the Doppler shift on the lower-energy peak corresponding to rays emitted after the degrader can be seen in Fig. 5 for a target-degrader separation =10.5 mm.
Spectra corresponding to the de-excitation events recorded by each slice in the SeGA detectors were summed over the azimuthal angle and the centroids of the gamma-ray peaks of interest were measured at the corresponding value of the polar angle . The centroid data from these spectra were used to determine velocities and for the peaks representing -rays emitted before and after the degrader, respectively, for each target-degrader separation. These data were fit using the relativistic Doppler equation:
| (14) |
by a least squares fitting method. The average decay position along the beam axis for the decays upstream and downstream from the degrader, and , respectively, were free parameters of these fits. The decay position is related to the polar angle in Eq. 14 by the target-detector separation distance cm and the detector segment angle in the array :
| (15) |
The result of the least squares fit for and is shown in Fig. 6 for a target-degrader separation of =10.5 mm. The contour plot shown in Fig. 7 provides evidence that velocity can be measured with 0.3% precision. The results of the / and / measurements are summarized in Tab. 2. The value of adopted based on the measurements at three target/degrader separations of =5.3, 10.5 and 15.8 mm is =0.278(1).
5.3 Normalized Intensity Measurement
For the intensity measurements as a function of target-degrader separation, the Doppler corrected spectra at a constant polar angle were summed over different azimuthal angles . Doppler corrections were performed separately for the high- and low-energy peaks with the corresponding measured values of and or and respectively. Fig. 8 demonstrates the improved energy resolution from the Doppler corrections for the spectrum corresponding to that shown in Fig. 5.
The number of counts in the high- and low-energy peaks were measured and recorded for each distance . These SeGA photo-peak counts were normalized to the total number of nuclei detected by the S800 E1 scintillator from the recorded scalers. Since the deadtime of the data acquisition system was small (2%) and equal for different target/degrader separations, no further corrections or normalizations were applied. The resulting normalized intensities are listed in Tab. 3.
5.4 Lifetime measurement for the 2 state in 124Xe
It is indicated by Eq. 11 that the lifetime of the 2 state in 124Xe can be extracted from the decay-curve data in the last column of Tab. 3 using an exponent plus a constant fit
| (16) |
with
| (17) |
In the above formulae all the efficiency and background factors are absorbed into the fitted constants. The results of the fit shown in Fig. 9 yield =5.6 mm which corresponds to =64 ps for =0.278(1) in excellent agreement with a recent measurement of =67.5(1.7) ps reported in Ref. [15].
The above procedure of extracting lifetime does not take into account the full experimental information provided by the measurement. A simultaneous fit to both components of the -ray transition of interest can be performed; it requires, however, a proper handling of the efficiency corrections which depend on the target/degrader separation for the decays upstream from the degrader.
For this simultaneous fit the formulae discussed in Sec. 3 can be written as
| (18) |
with
| (19) |
The total is then minimized as a function of , , , , , , , and constants.
In the current analysis the eight-parameter fit implied by Eqs. 5.4 to nine data points given in Tab. 3 is carried on as an exercise rather than a proper measurement. In practical applications additional data points at well chosen target/degrader separation are needed to constrain the fitted parameters. Here it was assumed that and that the slope of the function is zero at mm as suggested by the data points in Tab. 3.
The results of the simultaneous fit are sensitive to the parameter through the component. A fit with the parameter varied freely yields the =5.6(6) mm and =2.4(4) mm. This value of seemed too large for the current experimental conditions. A fit with the parameter constrained to less than 2.0 mm yields =5.5(7) mm, a value consistent with that obtained from the fit to the data alone. The results of the simultaneous fit with =2.0 mm are shown in Fig. 10 together with the curve expected in the absence of the -dependent efficiency corrections for the decays between the target and the degrader. The ratio from this fit is consistent with the results of the Monte Carlo simulations discussed in Sec. 4 and presented in Fig. 3 and Tab. 1.
Figure 10 indicates that in a plunger experiment with the stationary degrader the efficiency change as a function of the target/degrader separation has a significant impact on the detected number of counts for the decays upstream from the degrader. The efficiency corrections for the decays upstream from the degrader can be measured if a sufficient number of data points at is provided. On the other hand the data are essentially free from the efficiency corrections for a large range of lifetimes. These factors are of significant importance and need to be taken into account in planning and executing relativistic plunger experiments.
6 Range of application for the method
The factor which is limiting the application of the method for short lifetimes is related predominantly to the thickness of the plunger excitation target and the degrader foil. Certainly, the lifetime of a state being studied has to be long enough for the excited nuclei to emerge from the target and decay in vacuum. A typical target thickness for experiments with relativistic beams is 100 m which corresponds to 1 ps at .
If thin excitation targets can be used in an experiment the condition sets the limit for observing variations in as a function of according to Eq. 6. The minimization of is a well known challenge in plunger experiments; it requires that the target and the degrader foils are flat and parallel. This is achieved by careful stretching and alignment of the target and degrader foils. Currently the values of m, corresponding to 0.3 ps at , are routinely achieved. However, it must be stressed that the targets of 10 m thickness are essential for sub-picosecond lifetime measurements and that application of these targets necessarily results in reduced reaction yields.
The shortest lifetime which can be measured from the variation of is defined by the degrader thickness entering the condition from Eq. 7. The degrader thickness is selected to provide a change of the Doppler shift which is sufficient to resolve the components of the transition of interest emitted before and after traversing the degrader. For typical -ray detection resolution in relativistic beam experiments of 2% FWHM the degrader thickness of 300 m is required. This sets the lifetime limit of more than 3 ps at . However, for such short lifetimes the decays at changing velocity within the degrader contribute significantly and peak shape modeling based on the stopping power of the degrader seems to be needed to account properly for the intensity balances. The contribution of the decays in the degrader decreases for longer lifetimes and seem to be negligible in the current analysis as demonstrated from experimental spectra shown in Fig. 8.
For the short lifetime measurements discussed above the efficiency changes as a function of the target/degrader separation are essentially negligible. However, these efficiency changes limit the application of the method for states with long lifetimes. It is estimated that the forward ring of the SeGA array at 37∘ can be used to detect decays up to 20 cm downstream from the degrader foil. For a significant fraction of the decays of interest to occur with this length the has to be shorter by a factor of 4. This corresponds to the lifetime of ps.
Based on the above discussion, the current technique can be applied to -ray emitting states with lifetimes between 5 and 500 ps. The above estimates do not take into account the relativistic time dilation which is a 10% correction at which allows to investigate shorter lifetimes. It seems possible to extend the method to sub-picosecond lifetime measurement, however, further careful studies are needed for such applications.
7 Choice of the relativistic plunger target/degrader materials
An important issue for the application of the current technique is a choice of the target and degrader materials. The thickness of the degrader is directly related to the constant contribution to the intensity used to determine the lifetime from Eq. 11 and 16. This arises from the fact that relativistic beams have enough energy to react on both, the plunger excitation target and the degrader. This is one of the essential differences between the current method and plunger applications near the Coulomb barrier for which reactions on the degrader can be, for many cases, completely eliminated by a proper choice of the degrader material. The precision of the determination has a direct impact on the precision of the lifetime measurement. The precision of the lifetime measurement can be improved by minimizing the , however, it is not essential for the application of the method to eliminate completely.
The current approach for selecting the target and degrader material for relativistic plunger experiments is based on two principles:
-
•
The cross section for the excitation process of interest has to be maximized on the target and minimized on the degrader. For example, if Coulomb excitations are used, the target and the degrader should be made out of high-Z and low-Z material, respectively. On the other hand, if fragmentation is used to populate the states of interest then the target and the degrader should be made out of low-Z and high-Z material, respectively.
-
•
The thickness of the degrader has to be minimized preserving the change of velocity sufficient to resolve the Doppler-shifted components of the transition of interest emitted before and after traversing the degrader. Thus, the change of the Doppler shift from traversing the degrader has to be balanced against the -ray energy resolution for the peaks of interest. Since the energy resolution is determined by various factors [6] including solid angle for -ray detection and beam momentum spread, case by case studies are needed for planning a relativistic plunger experiment.
8 Conclusions
The experiment reported in the current paper provides a proof of principle for application of the time of flight technique for lifetime measurements with relativistic beams of heavy nuclei. The =64 ps lifetime for the first excited state in 124Xe measured with the above relativistic plunger method is in an excellent agreement with the most accurately known value of =67.5(1.7) ps from recent Ref. [15]. Further development of the method for experiments with rare isotopes produced in projectile fragmentation reaction at the NSCL are planned. In particular a plunger device optimized for the fast beams at the NSCL is being constructed by the collaboration between the NSCL and the University of Cologne.
The advantage of the plunger method is in its relatively simple dependence on reaction kinematics and in the fact that it does not depend on reaction dynamics. Thus, in a plunger experiment, any excitation mechanism can be used for populating the state of interest while the lifetime information is extracted from a decay curve measured directly. Moreover, the lifetime information results from a series of measurements for which only relative properties of the experimental set-up need to be known or calibrated. In particular, the knowledge of the absolute set-up efficiency is not critical for accurate lifetime measurement.
The plunger method is not limited by isomer contamination of the beam. This makes it an ideal tool to explore odd-even and odd-odd nuclei, investigating in particular single-particle electromagnetic moments near closed shells in neutron rich nuclei for which the available information is scarce at present. It is estimated that plunger experiments require beam intensities of only 106 particle per second, so that knockout reactions with rare isotopes are possible.
Current applications of the plunger technique near the Coulomb barrier provide the most accurate electromagnetic transition rate measurements for picosecond lifetimes. Successful application of the relativistic plunger technique in fragmentation facilities provides an opportunity to explore new and untouched areas of rare isotopes far from stability.
9 Acknowledgments
This work has been partially supported by the (US) National Science Foundation Grant No. PHY01-10253 and by the BMBF (GERMANY) under contract No. 06K167.
References
- [1] D. B. Fossan and W. K. Warburton, in Nuclear Spectroscopy and Reactions, Part C, ed. J. Cerny, Academinc Press, New York and London, (1974) p. 307.
- [2] R. Krücken, J. Res. Natl. Inst. Stand. Technol. 105 (2000) 53.
- [3] F. Marti, D. Poe, M. Steiner, J. Stetson, X.Y. Wu, Proceedings of the 2001 Particle Accelerator Conference, Chicago, IL, IEEE 01CH37268,(2001) 2557.
- [4] A. Stolz, T. Baumann, T. N. Ginter, D. J. Morrissey, M. Portillo, B. M. Sherill, M. Steiner, and J. W. Stetson, Nucl. Instr. and Meth. Phys. Res. B 241 (2005) 858.
- [5] D. J. Morrissey, B. M. Sherrill, M. Steiner, A. Stolz and I. Wiedenhoever, Nucl. Instr. and Meth. Phys. Res. B 204 (2003) 90.
- [6] T. Glasmacher, Ann. Rev. Nucl. Part. Sci. 48, 1, (1998).
- [7] D. Bazin, J.A. Caggiano, B.M. Sherrill, J. Yurkon and A. Zeller, Nucl. Instr. and Meth. Phys. Res. B 204 (2003) 629.
- [8] W.F. Mueller, J.A. Church, T. Glasmacher, D. Gutknecht, G. Hackman, P.G. Hansen, Z. Hu, K.L. Miller and P. Quinn, Nucl. Instr. and Meth. Phys. Res. A 466 (2001) 492
- [9] J. Yurkon, D. Bazin, W. Benenson, D.J. Morrisey, B.M. Sherrill, D. Swan, R. Swanson and Nucl. Instr. and Meth. Phys. Res. A 422 (1999) 291.
- [10] A. Winther and K. Alder, Nucl. Phys. A 319 (1979) 518.
- [11] S. Agostinelli, J. Allison, K. Amako, J. Apostolakis, H. Araujo, P. Arcel, M. Asai, D. Axen, t, S. Banerjee, G. Barrand, F. Behner, L. Bellagamba, J. Boudreau, L. Broglia, A. Brunengo, H. Burkhardt, S. Chauvie, J. Chuma, R. Chytracek, G. Cooperman, G. Cosmo, P. Degtyarenko, A. Dell’Acqua, G. Depaola, D. Dietrich, R. Enami, A. Feliciello, C. Ferguson, H. Fesefeldt, G. Folger, F. Foppiano, A. Forti, S. Garelli, S. Giani, R. Giannitrapani, D. Gibin, J. J. G mez Cadenas, I. Gonz lez, G. Gracia Abril, G. Greeniaus, W. Greiner, V. Grichine, A. Grossheim, S. Guatelli, P. Gumplinger, R. Hamatsu, K. Hashimoto, H. Hasui, A. Heikkinen, A. Howard, V. Ivanchenko, A. Johnson, F. W. Jones, J. Kallenbach, N. Kanaya, M. Kawabata, Y. Kawabata, M. Kawaguti, S. Kelner, P. Kent, A. Kimura, T. Kodama, R. Kokoulin, M. Kossov, H. Kurashige, E. Lamanna, T. Lamp n, V. Lara, V. Lefebure, F. Lei, M. Liendl, W. Lockman, F. Longo, S. Magni, M. Maire, E. Medernach, K. Minamimoto, P. Mora de Freitas, Y. Morita, K. Murakami, M. Nagamatu, R. Nartallo, P. Nieminen, T. Nishimura, K. Ohtsubo, M. Okamura, S. O’Neale, Y. Oohata, K. Paech, J. Perl, A. Pfeiffer, M. G. Pia, F. Ranjard, A. Rybin, S. Sadilov, E. Di Salvo, G. Santin, T. Sasaki, N. Savvas, Y. Sawada, S. Scherer, S. Sei, V. Sirotenko, D. Smith, N. Starkov, H. Stoecker, J. Sulkimo, M. Takahata, S. Tanaka, E. Tcherniaev, E. Safai Tehrani, M. Tropeano, P. Truscott, H. Uno, L. Urban, P. Urban, M. Verderi, A. Walkden, W. Wander, H. Weber, J. P. Wellisch, T. Wenaus, D. C. Williams, D. Wright, T. Yamada, H. Yoshida and D. Zschiesche, Nucl. Instr. Meth. A506, 250 (2003).
- [12] H. Olliver, T. Glasmacher, and A. E.Stuchbery, Phys. Rev. C68 (2003) 044312.
- [13] A.E. Stuchbery, A.N. Wilson, P.M. Davidson, A.D. Davies, T.J. Mertzimekis, S.N. Liddick, B.E. Tomlin and P.F. Mantica, Phys. Lett. B611 (2005) 81.
- [14] G. Goldring, in Heavy Ion Collisions, vol. 3, ed. R. Bock, Noth-Holland, Amsterdam, New York, Oxford, (1982) p. 483.
- [15] B. Saha, A. Dewald, O. Möller, R. Peusquens, K. Jessen, A. Fitzler, T. Klug, D. Tonev, P. von Brentano, J. Jolie, B. J. P. Gall, and P. Petkov, Phys. Rev. C 70 (2004) 034313.
| angular distribution | ||||||
|---|---|---|---|---|---|---|
| Coulex | 0.4852(5) | 0.00451(6) | -0.000011(5) | 0.4072(5) | 0.00376(4) | 0.000038(3) |
| attenuated Coulex | 0.4718(5) | 0.00404(6) | 0.000002(5) | 0.4140(5) | 0.00310(4) | 0.000048(3) |
| isotropic | 0.5007(6) | 0.00313(6) | 0.000000(5) | 0.4559(5) | 0.00289(4) | 0.000019(3) |
| [mm] | [mm] | |||
|---|---|---|---|---|
| 0.0 | 0.1784(2) | 7.6(3) | ||
| 5.3 | 0.2771(5) | 1.3(5) | 0.1784(3) | 7.9(4) |
| 10.5 | 0.2778(3) | -1.1(3) | 0.1792(3) | 8.3(4) |
| 15.8 | 0.2774(5) | -6.7(5) | 0.1792(4) | 8.3(5) |
| 0.1779(4) | 7.2(7) |
| / | / | |
|---|---|---|
| 0.0 | 20(2) | 80(1) |
| 5.3 | 34(2) | 53(2) |
| 10.5 | 42(2) | 44(1) |
| 15.8 | 42(2) | 38(1) |
| 38(2) |