Energy dependence of directed flow over a wide range of pseudorapidity in Au+Au collisions at RHIC
Abstract
We report on measurements of directed flow as a function of pseudorapidity in Au+Au collisions at energies of 19.6, 62.4, 130 and 200 GeV as measured by the PHOBOS detector at the Relativistic Heavy Ion Collider (RHIC). These results are particularly valuable because of the extensive, continuous pseudorapidity coverage of the PHOBOS detector. There is no significant indication of structure near midrapidity and the data surprisingly exhibit extended longitudinal scaling similar to that seen for elliptic flow and charged particle pseudorapidity density.
PACS numbers: 25.75.-q
The study of collective flow in ultrarelativistic nuclear collisions provides insight into the equation of state, degree of thermalization, and the early stages of the hot, dense matter created. The elliptic flow parameter, , has been studied extensively over a wide range of collision energies and pseudorapidity phwp ; stphwp . The directed flow parameter, , however, has been studied in less detail at RHIC energies starv1v4 ; starflow ; star62v1 .
The PHOBOS detector is composed of several subsystems (see Ref. phobos_det for details). The most important for this analysis were the silicon multiplicity array, which consists of an octagonal multiplicity detector (OCT), a silicon vertex detector (VTX), and three annular ring multiplicity detectors (RINGS) located on each side of the collision point. PHOBOS has the ability to measure nearly all charged particles due to the solid angle coverage and to record particles with transverse momenta down to about 35 MeV/c (140 MeV/c) for pions (protons) at and 4 MeV/c (10 MeV/c) for 4–5.
This analysis is based on data sets for Au+Au collisions at 19.6, 62.4, 130, and 200 GeV, as used in the elliptic flow study v2limfrag . All data sets were taken with the spectrometer magnetic field off, except for data taken at 130 GeV, where field-on data was included to maximize statistics. Details on event selection and signal processing can be found in phwp ; phobos_det . The results are shown in the most central 40% of the total inelastic cross-section for which the trigger system was fully efficient at all four energies. More information on triggering and centrality determination can be found in phwp . Monte Carlo simulations of the detector performance were based on the Hijing event generator hijing and the GEANT 3.211 geant simulation package, folding in the signal response for scintillator counters and silicon sensors.
The analysis is based on the anisotropy of the azimuthal distribution of charged particles detected in the silicon pads of the PHOBOS multiplicity array. The analysis uses a subevent technique where hits produced in one area of the detector are correlated with an event plane angle found from hits in another region pandv .
Directed flow is quantified by measuring the first harmonic, , of the Fourier decomposition of the particle azimuthal angle distribution,
| (1) |
where is the true reaction plane angle defined by the impact parameter and beam axis.
Measuring directed flow using a subevent technique is associated with several pitfalls because global momentum conservation can produce non-flow correlations between the subevent and the particle under study flowmomcons . This analysis circumvents this correlation by using subevent windows that are symmetric about midrapidity BDO , thereby canceling the back-to-back momentum conservation recoil because each subevent is composed of two equal sections in the negative and positive hemispheres. The subevent regions used in the event plane calculations are located in the OCT () and RINGS () subdetectors. The OCT subevent is used to find in the RINGS region (). Likewise, the RINGS subevent is used to find in the OCT () region. For each -symmetric subevent window, a resolution correction is applied that was equal to
| (2) |
where the N and P labels denote event planes found in the negative and positive halves of each subevent window. The centrality averaged resolution correction for the octagon subevent was 4.1 for 19.6 GeV and 3.5 for the other three energies. The centrality averaged ring subevent resolution correction was 1.9, 3.3, 4.5, and 3.8 for the 19.6, 62.4, 130 ,and 200 GeV data sets, respectively.
This analysis accepted collisions within cm of the nominal vertex position. In this detector region there exist holes in the octagon acceptance to avoid shadowing the vertex and spectrometer detectors. The detector was symmetrized using the procedure described in v2limfrag .
In addition, weights were applied to the pads in the symmetrized detector hit map to correct for phase space differences between the detector pads, as well as to account for instances where more than one track passes through a pad. The weighting procedure is the same as applied in the analysis of elliptic flow v2limfrag .
Monte Carlo studies showed a suppression of the reconstructed flow signal that is dominated by background particles that do not carry flow information, as well as the loss of sensitivity due to the hit map symmetrization and the occupancy correction algorithm. As in the elliptic flow analysis v2limfrag , this suppression is corrected using the ratio of reconstructed to input flow from the simulation. Typical correction levels were in the 25-30% range for the results shown.
In the subevent method described above, while the flow itself is measured using symmetric subevents, the resolution correction correlates portions of the detector that lie in the forward and backward regions. Thus, it is possible that a small non-flow correlation due to momentum conservation affects the final result through the resolution correction. In order to estimate the potential size of this and any other non-flow correlations contributing to the signal, we also analyzed the data using a mixed harmonic event plane analysis BDO2 . In the mixed harmonic analysis, the reaction plane, , is determined using the elliptic flow information and the directed flow signal perpendicular to (out-of-plane) is subtracted from that which is in the plane of (in-plane). Since the true directed flow signal is in-plane, the assumption is that the directed flow signal out-of-plane is due to non-flow correlations.
Specifically, in our implementation of the mixed harmonic analysis, was found in two subevents from and and used along with the -symmetric event planes defined above to find as outlined in starflow . Two event plane angles and two angles were necessary in order to find in all regions of pseudorapidity such that the particle under study did not fall into the regions where either or event plane angles were determined.
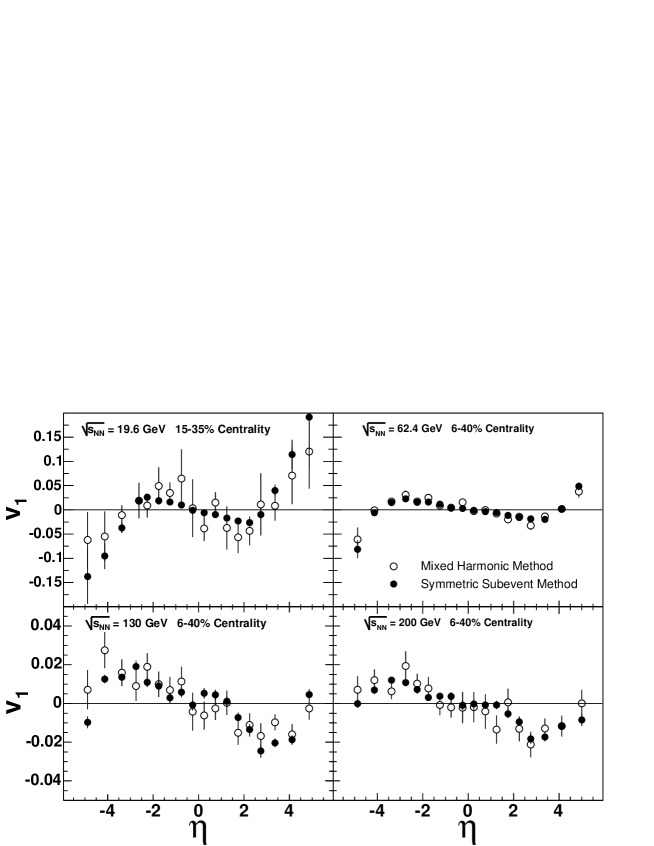
Fig. 1 shows the fully corrected signal for the directed flow at all energies as a function of pseudorapidity for both analysis methods. The 1 statistical errors are shown as solid bars. In both methods, the statistical errors exhibit a point-to-point correlation due to shared event plane and event plane resolution determination. The mixed harmonic method gives results which are consistent with the symmetric subevent method at 62.4, 130, and 200 GeV. At 19.6 GeV the mixed harmonic analysis results are in reasonable agreement with the symmetric subevent method; however, the analyzing power of the mixed harmonic method is diminished at this energy due to the weak elliptic flow signal, as well as a very small event sample.
The agreement between these methods implies that the reaction plane determined by elliptic flow is the same as that determined by directed flow, within errors. This in turn means that the flow and the reaction plane that we see in Au+Au collisions is dominated by a global flow of the particles with minimal effects from “non-flow correlations”. Furthermore, since the reaction plane is dominated by near zero and by high , this result indicates that the reaction plane orientation is consistent over the entire pseudorapidity range.
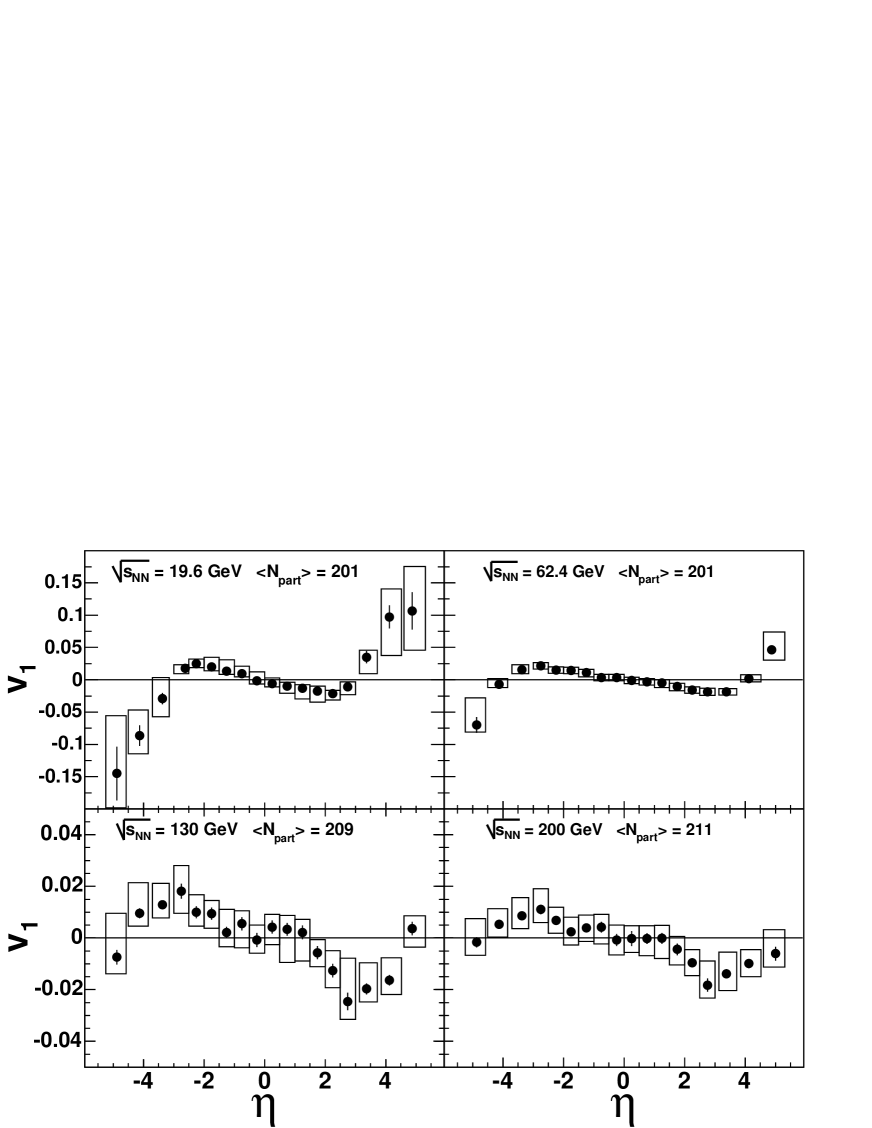
Fig. 2 shows the results from the symmetric subevent method with the 90% C.L. systematic errors. Several aspects of the analysis were studied in order to establish the systematic errors. These include hit definition, hit merging, subevent definition, knowledge of the beam orbit relative to the detector, distribution, hole filling procedure, consistency of result when rotated by 180 degrees, magnetic field configuration and the suppression correction determination. The systematic error from each source was estimated by varying that specific aspect within reasonable limits and quantifying the change in the final as a function of . Also, the difference between the results from the symmetric subevent method and an odd-order polynomial fit to the mixed harmonic method was included in the systematic error. The individual contributions were added in quadrature to obtain the final systematic errors.
Historically, has been defined to be positive (negative) at high positive (negative) where spectator matter is thought to dominate the signal na49flow . We have preserved that convention here, although it is important to note that the spectator region falls outside of our acceptance at the higher energies. Consequently, the regions of used to find the direction of have varying spectator content as the collision energy increases. Thus, it is necessary to invert the sign of at 130 and 200 GeV in order to preserve the sign convention from the lower energies and make a direct comparison of the shapes as a function of energy, as shown in Fig. 2.
The results in Fig. 2 show the evolution of as the collision energy increases. All four energies exhibit a signal passing smoothly through zero at as expected, indicating that there are no momentum conservation biases in the data. The becomes more negative with at each energy, until a “turnover” point is reached, and the from both 19.6 and 62.4 GeV becomes positive at very high pseudorapidities. This turnover at all energies and the large signal seen at high for the lower energies are features uniquely observed by PHOBOS. These effects may be due to protons and nuclear fragments taking over from pions as the dominant contributors to the directed flow signal at high .
The results at 62.4 and 200 GeV are in qualitative agreement with results from STAR starflow ; star62v1 . Both experiments show 0 for an extended region about midrapidity at 200 GeV, while increases as increases. At 62.4 GeV, PHOBOS observes a turnover of the signal that occurs at smaller pseudorapidity than what is reported in the STAR data. This may indicate that at high is sensitive to the transverse momentum range included in the measurement. Recall that PHOBOS measures protons down to MeV/c while STAR has a cutoff at MeV/c.
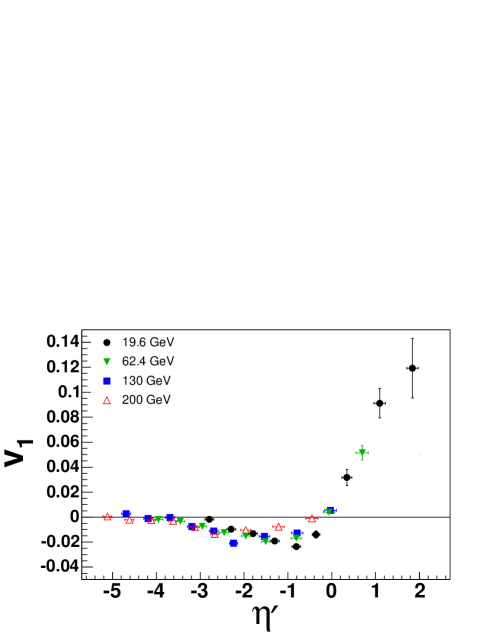
Fig. 3 shows the directed flow where data points from the positive and negative regions have been averaged together and plotted as a function of . Since the directed flow curves are odd functions, the negative region was multiplied by -1 before the averaging was performed to avoid cancelation. Within the systematic errors (shown in Fig. 2), it appears that all curves scale throughout the entire region of overlap, showing that, within errors, the directed flow exhibits the longitudinal scaling behavior already observed in the elliptic flow v2limfrag and charged particle multiplicity limfrag . This confirms and expands on an earlier observation of this scaling in the directed flow between RHIC and SPS results star62v1 .
In summary, the pseudorapidity dependence of directed flow has been measured for several collision energies. At each energy, the signal is small at midrapidity and grows with increasing . At very high , a turnover of is observed, possibly due to protons and nuclear fragments dominating the flow signal in this range. When studied as a function of , appears to scale throughout the entire overlap region at all energies.
Acknowledgements: This work was partially supported by U.S. DOE grants DE-AC02-98CH10886, DE-FG02-93ER40802, DE-FC02-94ER40818, DE-FG02-94ER40865, DE-FG02-99ER41099, and W-31-109-ENG-38, by U.S. NSF grants 9603486, 0072204, and 0245011, by Polish KBN grant 1-P03B-06227, and by NSC of Taiwan Contract NSC 89-2112-M-008-024.
References
- (1) B.B. Back et al., Nucl. Phys. A757, 28 (2005).
- (2) J. Adams et al., Nucl. Phys. A757, 102 (2005); K. Adcox et al., Nucl. Phys. A757, 184 (2005).
- (3) J. Adams et al., Phys. Rev. Lett. 92, 062301 (2004).
- (4) J. Adams et al., Phys. Rev. C 72, 014904 (2005).
- (5) J. Adams et al., submitted to Phys. Rev. C (Rapid Comm.) [nucl-ex/0510053].
- (6) B.B. Back et al., Nucl. Instrum. Meth. A 499, 603 (2003).
- (7) B.B. Back et al., Phys. Rev. Lett. 94, 122303 (2005).
- (8) X.N.Wang and M.Gyulassy, Phys. Rev. D 44, 3501 (1991). We used standard Hijing v1.35.
- (9) GEANT 3.211, CERN Program Library.
- (10) A.M. Poskanzer and S.A. Voloshin, Phys. Rev. C 58, 1671 (1998).
- (11) N. Borghini, P.M. Dinh, J.-Y. Ollitrault, A.M. Poskanzer and S.A. Voloshin, Phys. Rev. C 66, 014901 (2002).
- (12) N. Borghini, P.M. Dinh, and J.-Y. Ollitrault, Phys. Rev. C 62, 034902 (2000).
- (13) N. Borghini, P.M. Dinh, and J.-Y. Ollitrault, Phys. Rev. C 66, 014905 (2002).
- (14) C. Alt et al., Phys. Rev. C 68, 034903 (2003).
- (15) B.B. Back et al., Phys. Rev. Lett. 91, 052303 (2003).