Status of the Standard Solar Model Prediction of Solar Neutrino Fluxes
Abstract
The Standard Solar Model (BP04) predicts a total neutrino flux that is 17.2% larger than measured in the salt phase of the SNO detector (and if it were significant it will indicate oscillation to sterile neutrinos). Hence it is important to examine in details uncertainties (and values) of inputs to the SSM. Currently, the largest fractional uncertainty is due to the new evaluation of the surface composition of the sun. We examine the nuclear input on the formation of solar [] and demonstrate that it is still quite uncertain due to ill known slope of the measured astrophysical cross section factor and thus ill defined extrapolation to zero energy. This yields an additional reasonably estimated uncertainty due to extrapolation of eV-b (). Since a large discrepancy exists among measured as well as among predicted slopes, the value of is dependent on the choice of data and theory used to extrapolate . This situation must be alleviated by new measurement(s). The ”world average” is driven by the Seattle result due to the very small quoted uncertainty, which we however demonstrate it to be an over-estimated accuracy. We propose more realistic error bars for the Seattle results based on the published Seattle data.
pacs:
25.20.Dc, 25.70.De, 95.30-K, 26.30.+K, 26.65.+tI Introduction
The high precision measurement of neutral current interactions of ” solar neutrinos” in the SNO detector (with added salt) SNO , yields the measured flux: = 4.94 0.21 (stat) (syst) x cm-2 sec-1, with a total uncertainty of +8.8 -8.1%. The most realistic Standard Solar Model (SSM) prediction for the flux, labeled as BP(04) in BP04 , is 5.79 x cm-2 sec-1, hence:
(1)
It is important to examine if this discrepancy is significant as it could for example indicate (further) oscillation of (solar) electron neutrinos to sterile neutrinos. The uncertainties of the SSM prediction of solar neutrino fluxes were studied by Bahcall and Serenelli BS05 as listed in Table 1.
| Source | ||
|---|---|---|
| 1% | 0.4% | |
| 2% | 2% | |
| 8% | 8% | |
| 4% | 0 | |
| Composition (Z/X) | 12% | 5% |
| Opacity | 5% | 3% |
| Diffusion | 4% | 2% |
| Luminosity | 3% | 1% |
| Total: | 16.7% | 10.4% |
Currently the largest fractional uncertainty of the solar neutrino flux is due to the chemical composition (Z/X) which is a consequence of the new evaluation of the abundance of heavy elements (mainly oxygen and neon) on the surface of the sun. The new evaluation leads to doubling the uncertainty (from 6% to 12%) and to what was recognized as a new ”standard solar model problem” vis-a-vis the predicted convective zone BSP , and it was shown to be in conflict with SSM predictions based on helioseismology Basu . Hopefully this large uncertainty due to Z/X will be resolved soon, and there is progress in reducing the error due to , see Table, leading to a considerably smaller total error. But in the same time the errors of nuclear inputs are far from resolved. In this paper we address the error of a crucial nuclear input, the formation of solar via the reaction and its associated astrophysical cross section factor at zero energy, .
The value of = 21.4 eV-b and the (impressive) accuracy of 4% listed in Table 1 is adopted from the Seattle group Seatt . It should be compared to the previously quoted value of = 19 +4 -2 eV-b Adel . The new quoted value of leads to an increase of 12.6% in the predicted solar neutrino flux. We examine in details the claims of accuracy as well as the quoted value. We demonstrate that the ”world average” value of is driven by the Seattle result with an over estimated accuracy, and more realistic error bars are proposed. Due to large discrepancy between measured slopes of (mostly DC) data, and since theories also disagree on the predicted slopes, the value of is dependent on the choice of data and theory that one uses to extrapolate . This situation must be alleviated by new measurement(s).
I.1 Direct Capture
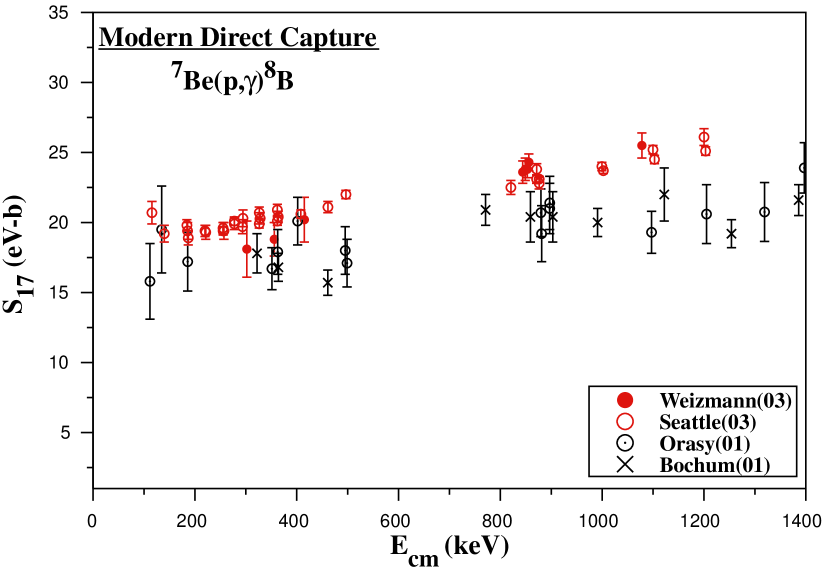
It is well known that the ”old” data on Direct Capture (DC) reaction Fil83 ; Vaughn ; Parker ; Kav exhibit major systematic disagreements. But the situation is not improved with ”modern” data on DC Seatt ; Ham01 ; Str01 ; Weiz , as we show in Fig. 1. The data of the Orsay group Ham01 and Bochum group Str01 do not agree with that of the Seattle group Seatt and Weizmann group Weiz . As can be seen from Fig. 1 the disagreements among individual data points are by as much as five sigma and there is not a single measured data point of the Bochum group that agrees with a data point measured by the Seattle group. Most disturbing is the systematic disagreement at low energies of the two ”modern” high precision measurements of the Seattle Seatt and Weizmann Weiz groups. These two measurement are in good agreement at higher energies (around 1 MeV), but the Weizmann data are systematically below the Seattle data at low energies (300 - 500 keV), indicating a different slope.
The large discrepancies between measured individual DC data points shown in Fig. 1, demonstrate large systematical differences between ”modern” DC data. These large systematical differences must be resolved before these data are used to extract from DC world data. The systematically disagreeing DC data can not be handled algebraically using statistical methods to extract average properties of DC data and in this case chi-square tests are meaningless.
II The Slope Measured Between 300 - 1,400 KeV
The slope of the measured astrophysical cross section factor between 300 and 1400 keV is essential for extracting the d-wave contribution to measured data. This contribution must be subtracted from the data in order to extrapolate to zero energy Ham where the s-wave dominate (approximately 95%). But so far we can only rely on theoretical estimates of the d-wave component Ham ; DB ; Jen ; D and these models can be tested only by a precise measurement of the slope.
The Seattle group extracted the average slope of DC data with high precision (4.5%), as shown in Fig. 19 of their paper Seatt . But three of the five DC data points selected to be shown in Fig. 19 Seatt (note that not all available DC data are shown in Fig. 19) have central values that disagree by a factor of 2.5 and almost three sigma. Furthermore, the quoted high precision is in fact driven by the claimed high precision of Seattle experiment hence in the next section we examine this precision in details.
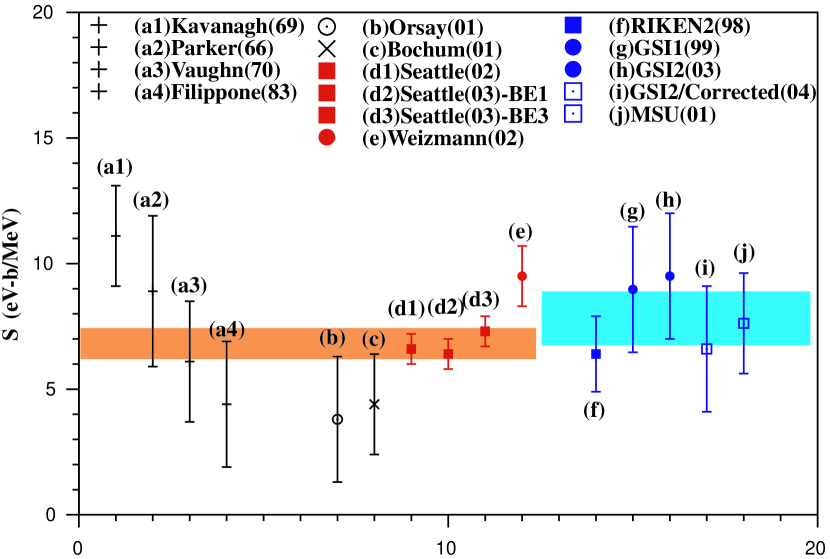
In Fig. 2 we show the slope of all available DC data measured between 300 - 1400 keV, including the data of Vaughn Vaughn , Parker Parker , and Kavanagh Kav that were omitted in Fig. 19 of Seatt . We also show all thus far measured CD data Kik ; Iw99 ; Dav01 ; Sch03 .We conclude that the slope parameter can not be extracted from DC data with the (impressive) accuracy of 4.5% Seatt , unless one excludes some of the DC measurements discussed above. An error which is at least a factor of 2 larger seems like a more reasonable choice. In the same time it is obvious from Fig. 2 that there is no evidence for large disagreement of the slopes of CD and DC data as claimed in Seatt . In any case the large dispersion of measured slopes shown in Fig. 2 can not allow us to determine the slope from either CD or DC data with sufficient precision and this question must be addressed by future experiments. Lack of accurate determination of the slope must lead to an additional uncertainty due to the ill defined subtraction of the d-wave and the extrapolation to zero energy.
III Accuracy of the Seattle Data
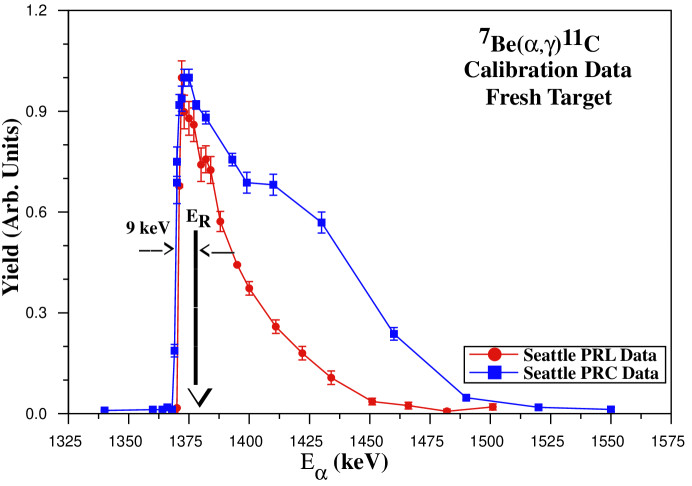
Since the claimed high precision of the Seattle measured data points and quoted extracted Seatt drive the value and the error of so called ”world average” it seems reasonable to examine it in detail, especially at low energies. In Fig. 3 we show the results of the target-beam calibration data shown by the Seattle group using the reaction. As can be seen in Fig. 3 both calibration spectra published in the Phys. Rev. Lett. and the Journal Phys. Rev. C (which where measured with different targets) exhibit a resonance energy which is off by 9 keV from the known energy in . This 9 keV shift is intolerable and the authors as yet did not explain this discrepancy in a published erratum. The repeated publication of the same mistake first in the PRL paper and a year later in the PRC long paper does not lend credence to the claimed high precision experiment.
Furthermore, in their paper they show the target profile measured in the middle (PF2) and at the end (PF3) of the experiment Seatt . These profiles are superimposed on top of each other in Fig. 4a, from which it becomes clear that we can not support the claim Seatt that ”they are similar”. In fact there is evidence that the moved further into the target in the intervening period between these two measurements. The unstable nature of the during the experiment must be reflected in a systematic uncertainty due to variation of the expected yield, as we discuss below. Another systematic uncertainty that is not considered here is associated with the evaluation of the effective center of mass energy.
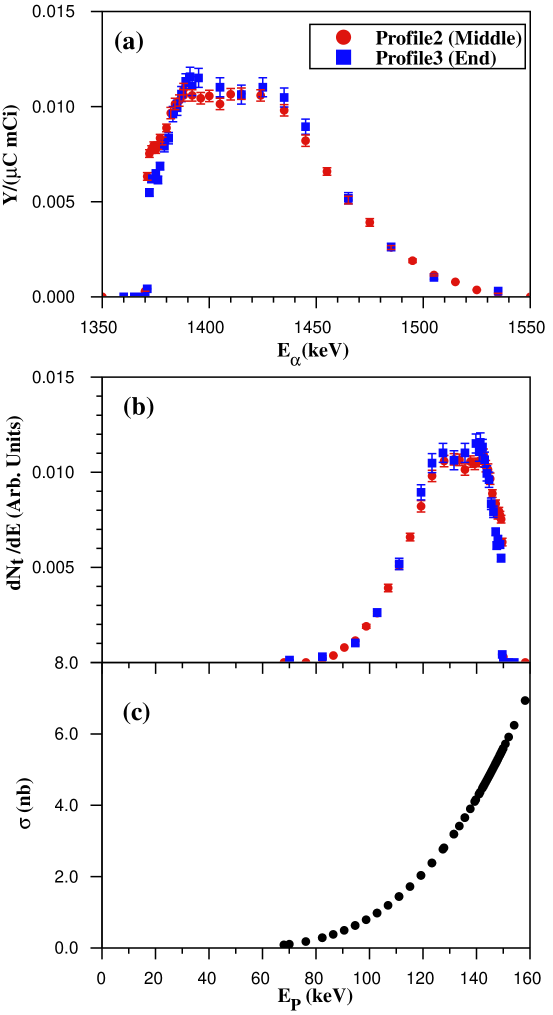
These profiles are measured with alpha-particle beams with energies of approximately 1.4 MeV in steps of E = Eα - ER which can be translated to steps of E = (Eα - E/ for proton beams. Note that the ratio / is almost independent of the exact mixture of the target Seatt , as well as variation among the various tabulated individual energy loss. Hence for an incoming proton beam (Ep) the target profiles during the reaction measurement is given by:
Profile (equ. 2)
The so obtained profile is shown in Fig. 4b, it leads to very large target thickness, for example of the order of 35 keV at a beam energy of approximately 130 keV. Over such a thick target the cross section varies by almost a factor of five, as shown in Fig. 4c. A convolution of the so obtained target profile with the expected variation of the cross section leads to the expected yields:
Yield (equ. 3)
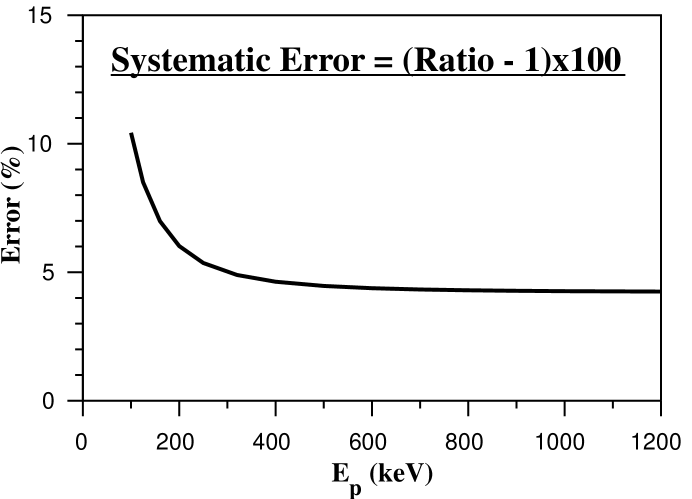
The yields evaluated for the two shown profiles measured in the middle (PF2) and at the end (PF3) of the experiments differ by 7.5% at the lowest measured energy, almost a factor of 3 larger than the quoted systematic uncertainty Seatt . In Fig. 5 we show the differential yields = Y(PF2)/Y(PF3) - 1 evaluated for all incoming proton beam energies. This differential yield must be considered a lower limit of the systematical uncertainty. This uncertainty is a factor of 3 larger than the quoted varying systematical uncertainty Seatt . Clearly the most troubling uncertainty is at energies below 400 keV. This energy range was emphasized in the Seattle paper as most useful for extracting , but it is measured with the largest systematical uncertainty.
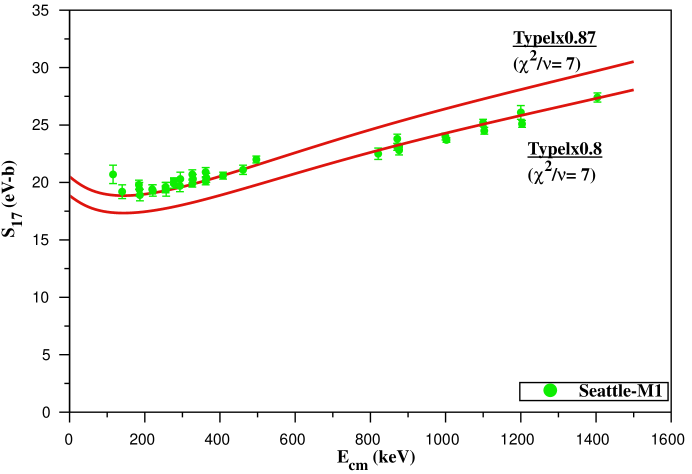
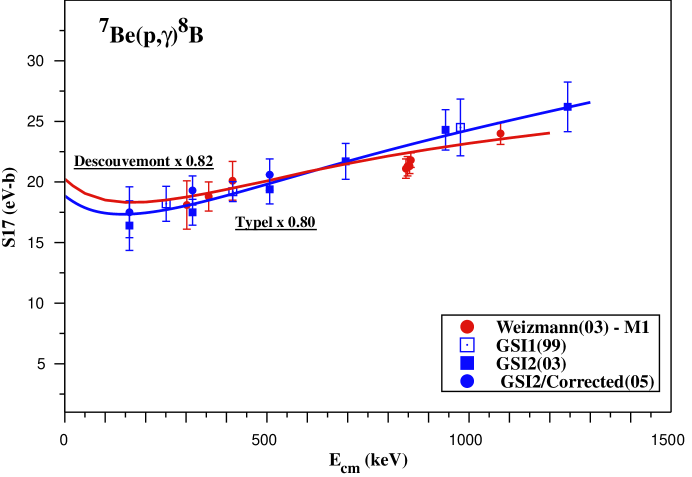
The large systematical uncertainty of Seattle data at low energies is particularly bothersome vis-a-vis the exclusion of theoretical models such as the potential model of Typel Sch03 . In Fig. 6 we show a comparison of that model to the Seattle data where we find that the model reproduce well the high energy data but not the low energy data (or vice versa). The large systematical error at low energies shown in Fig. 5 cast doubt on the claim that the Typel model is ”rejected” by the data. This model fits well all other data and consistently yield extrapolated values of which are approximately 3 eV-b smaller, as shown in Fig. 7.
We conclude that in the absence of an accurate measurement of the slope we must add an extrapolation error to the quoted . And in view of the fact that the Typel model is consistent with all existing data except the Seattle data, and in view of the large systematical error of the Seattle data at low energies, a reasonable estimate of an extrapolation error is of +0.0 -3.0 eV-b. Such an a large error implies the discrepancy of the SSM shown in equ. 1 is not significant solely due to nuclear uncertainty even if the uncertainty due to chemical composition will be reduced.
References
- (1) S.N. Ahmad et al.; Phys. Rev. Lett. 92, 181301 (2004), B. Aharmim, et al.; nucl-ex/0502021.
- (2) J.N. Bahcall and M.H. Pinsonneault; Phys. Rev. Lett. 92, 121301 (2004).
- (3) J.N. Bahcall and A.M. Serenelli; in press ApJ, 2005, astro-ph/0412096.
- (4) J.N. Bahcall, A.M. Serenelli, and M.H. Pinsonneault; astro-ph/0403604.
- (5) S. Basu and H.M. Antia; ApJ 606, L85 (2004).
- (6) A.R. Junghans et al.; Phys. Rev. Lett 88, 041101 (2002), ibid Phys. Rev. C68, 065803 (2003).
- (7) E.G. Adelberger et al.; Rev. of Modern Phys. 70, 1265 (1998).
- (8) B.W. Filippone et al.; Phys. Rev. C28, 2222 (1983).
- (9) F.J. Vaughn et al., Phys. Rev. C2, 1657 (1970).
- (10) P.D. Parker, Phys. Rev. 150, 851 (1966).
- (11) R.W. Kavanagh, T.A. Tombrello, T.A. Mosher, and D.R. Goosman, Bull. Amer. Phys. Soc., 14, 1209 (1969).
- (12) F. Hammache et al.; Phys. Rev. Lett. 86, 3985 (2001).
- (13) F. Strieder et al.; Nucl. Phys. A696, 219 (2001).
- (14) L.T. Baby et al., Phys. Rev. Lett. 90, 022501 (2003), ibid Phys. Rev. C67, 065805 (2003), ER C69, 019902(E) (2004).
- (15) R.G.H. Robertson; Phys. Rev. C7, 543 (1973).
- (16) P. Descouvemont and D. Baye; Nucl. Phys. A567, 341 (1994).
- (17) B.K. Jennings, S. Karataglidis, and T.D. Shoppa; Phys. Rev. C58, 3711 (1998).
- (18) P. Descouvemont; Phys. Rev. C70, 065802 (2004).
- (19) T. Kikuchi et al.; Phys. Lett. B391, 261 (1997), ibid E. Phys. J. A3, 213 (1998).
- (20) N. Iwasa et al.; Phys. Rev. Lett. 83, 2910 (1999).
- (21) B.S. Davids et al.; Phy. Rev. 63, 065806 (2001).
- (22) F. Schumann et al.; Phys. Rev. Lett. 90, 232501 (2003).