Results of a search for 2-decay of 136Xe with high-pressure copper proportional counters in Baksan Neutrino Observatory
Ju.M. Gavriljuka, A.M. Gangapsheva,111Talk at
5th International Conference on Non-Accelerator New Physics
(NANP’05), Dubna, Russia, 20–25 June 2005., V.V. Kuzminova,
S.I. Panasenkob, S.S. Ratkevichb
a Baksan Neutrino Observatory, INR RAS, Russia
b Karazin Kharkiv National University, Ukraine
Abstract
The experiment for the 2-decay of 136Xe search with two high-pressure copper proportional counters has been held in Baksan neutrino observatory. The search for the process is based on comparison of spectra measured with natural and enriched xenon. No evidence has been found for 2(2)- and 2(0)-decay. The decay half lifetime limit based on data measured during 8000 h is T1/28.51021yr for 2-mode and T1/23.11023yr for 0-mode (90C.L.).
Introduction
The experimental investigation of the 2-decay of 136Xe has been started more then 20 years ago. But till now both two neutrino and neutrinoless modes of this process are not observed yet. The results of last experiments are presented in tab.1. The theoretical estimations of half lifetime for -decay are presented in tab.2. It is necessary to mention that in [4] only one spectrum (measured with enriched 136Xe) was obtained. To calculate their limit it was assumed that at any effect/background ratio in the energy range under investigation the effect did not exceed the actually measured background increased by a systematic error given in units ( is a standard deviation). Actually, in the case of search of 2(2)-decay, this method does not allow one to find the effect and could be used only to find a limit. To discover such an effect it is necessary either to measure directly the background of the installation under the same conditions or to simulate the background. In DAMA/LXe experiment such work has not been done. In our work the measurements were performed with enriched xenon (93 of 136Xe) and natural xenon simultaneously.
Experimental setup
The measurement was carried out with two copper proportional counters (CPC and CPC ). When one of them was filled with enriched xenon, the other one was filled with natural xenon with extracted light isotopes (9.2 of 136Xe). Both CPC-s are surrounded by passive shield consisting of 20 cm of copper, 8 cm of borated polyethylene and 15 cm of lead (see fig.1). The installation is located in the deep underground laboratory of the BNO INR RAS at the depth 4900 m w.e, where the flux of muons is decreased by factor 107 and evaluated as cm [9]. The parameters of the CPC-s are: working pressure - 14.8 , fiducial volume - 9.16 l, applied voltage - 3800 V. Signals PC1 and PC2 were read out from both ends of the anode wire through preamplifiers. Then they were supplied to the digital oscilloscope through amplifiers. (see fig.2). Such a scheme of read out system allowed us to determine a relative coordinate () of the events along the anode wire by the following equation , where A1 and A2 amplitudes of pulses PC1 and PC2. Parameter is used to reject both events of microdischarges in the outward high voltage circuits and those on the anode insulator surfaces. To exclude the influence of capacity charge decay on the pulse amplitude each pulse is reconstructed by software taking into account this decay. The value of reconstructed pulse at the point of initial pulse maximum was used as a amplitude to construct the energy spectrum. For detailed analysis the following pulse shape parameters was used: the pulse rise time () and parameter defined as
Where the is value of differential of reconstructed pulse at the point i, - value of gaussian at the same point, - mean value of the differential of pulse in fitting region. The region of fitting by gaussian of the differential of pulse is restricted by point of pulse beginning and point where the initial pulse has a value . In fig.3 samples of the pulses are shown.
Results
From previous experiment [3] it was seen that significant part of the counters background is due to -particles produced in gas volume. To define parameters of -particle events the measurement of background of one CPC-s filled with xenon with admixtures of 222Rn (-particles with energy of 5.49 MeV, 6.02 Mev and 7.69 Mev) was done. The results of this measurement are presented in [10]. To define parameters of events from -rays the measurement with 232Th-source was carried out. Before measurements with 222Rn and 232Th and during main measurements the calibration of both CPC-s by 22Na-source was done. The energy resolution was determined as 13.5, 9.5 and 8.1 for 511 keV, 1275 keV and 1592 keV, respectively.
Main measurements consist of 5 runs. In the first run CPC was filled with enriched xenon and CPC with natural xenon. Duration of the run was 3000 h. Then first CPC was refilled with natural xenon, second one with enriched xenon, after each run the refilling procedure was repeated. Such a procedure allows elimination of systematic error from possible differences between counters. For analysis the even number of runs was used. To exclude the contribution of 222Rn (which goes from gas cleaning system) to the CPC-s background the data of the first 500 h of measurements were not used for analysis. During this time radon decays almost completely. The calibration of the counters was carried out every 2 weeks ( 300 h).
Distribution of the background (2000 h of measurements), 22Na, 232Th and 222Rn events versus energy, and are presented in fig.4, 5 and 6. It is seen that distribution of the 232Th events differ from 222Rn events significantly. This difference is clearly seen in distribution of events versus energy and for energy greater then 800keV (see fig.6.). It was used to separate -particle events and electron events (pulses from -particles have =100, pulses from electron have 100). By rejecting of events with =100 we exclude -particle events (produced in 222Rn decay chain in gas volume and coming from internal surface of CPC) from background spectra. The transformation of the background spectrum after such rejection is seen in fig.7. For total analysis the runs 1,2,4 and 5 were used. The effect value caused by 2(2)-decay of 136Xe is determined with comparison of total spectra measured with enriched and natural xenon (see fig.8). Number of events in the energy region 0.82.48 MeV registered by CPC and CPC in each run during 2000 h of measurements are presented in tab.3. The evaluated effect is . The total deviation is . So effect is . Taking into account efficiencies and the different percentages of 136Xe in two gases and the recommendation given in [11], we obtain for the lifetime of 2-decay a lower limit:
Where: t=8000 h=0.913 - measurements time, - difference in 136Xe, - efficiency after rejection of events with and - efficiency of -events registration.
To evaluate the -effect the energy spectra in region keV were analyzed. This energy region is determined from recalculated energy resolution for 2479 keV or 174 keV) electrons and systematic error in definition of peak position (41keV). Number of events in the energy region 23172641 keV registered by CPC and CPC in each run during 2000 h of measurements are presented in tab.4. The evaluated effect is . Using recommendation given in [11] and assuming that mean background is 7 events and measured one is 5 events, we obtain:
where ,
The work was supported by RFBR (grants: 01-02-16069 and 02-02-06136mas).
References
- [1] R. Bernabei, P. Belli, F. Cappella et al., Phys. Lett. B546, 23 (2002).
- [2] R. Luescher, J. Farine, F. Boehm et al. Phys. Lett. B434, 407 (1998).
- [3] Ju. M. Gavriljuk, V.V. Kuzminov, N. Ya. Osetrova, S.S. Ratkevich, Phys. Rev. C61, 035501 (2000).
- [4] R. Bernabei, P. Belli, F. Cappella et al., Phys. Lett. B546, 23 (2002).
- [5] E. Caurier, F. Nowacki, A. Poves, J. Retamosa, Nucl. Phys. A654, 973 (1999).
- [6] O.A. Rumyantsev, M.G. Urin, JETP Lett 61, 361 (1995).
- [7] A. Staudt, K. Muto, H. Klapdor-Kleingrothaus, Europhys. Lett. 13, 31 (1990).
- [8] P. Vogel and M.R. Zirnbauer, Phys. Rev. Lett. 57, 3148 (1986)
- [9] V.N. Gavrin, V.I. Gurentsov, V.N. Kornoukhov et al, Intensivnost muonov kosmicheskikh luchei v laboratorii glubokogo zalozheniya GGNT, Preprint INR RAS, P-698 (1991) Moskva.
- [10] Yu. M. Gavriljuk, V.V. Kuzminov, N. Ya. Osetrova, S.S. Ratkevich, Yad. Phys. 67, 11, 2039 (2004).
- [11] G.J.Feldman, R.D.Causins, Phys. Rev. D57, 3873 (1998).
0.3mm \onelinecaptionstrue\captionstyleflushleft
0.3mm \onelinecaptionstrue\captionstyleflushleft .
0.5mm \onelinecaptionstrue\captionstyleflushleft
| run | CPC | CPC |
|---|---|---|
| 1 | 1681 (136Xe) | 1108 (natXe) |
| 2 | 1734 (natXe) | 1182 (136Xe) |
| 4 | 1316 (natXe) | 783 (136Xe) |
| 5 | 1204 (136Xe) | 756 (natXe) |
0.5mm \onelinecaptionstrue\captionstyleflushleft
| run | CPC | CPC |
|---|---|---|
| 1 | 3 (136Xe) | 3 (natXe) |
| 2 | 3 (natXe) | 1 (136Xe) |
| 4 | 1 (natXe) | 0 (136Xe) |
| 5 | 1 (136Xe) | 0 (natXe) |
5mm \onelinecaptionstrue \captionstylenormal \captionstyleflushleft
5mm \onelinecaptionstrue \captionstylenormal
\captionstyleflushleft
\captionstylenormal
\captionstyleflushleft
5mm \onelinecaptionstrue \captionstylenormal
5mm \onelinecaptionstrue \captionstylenormal \captionstyleflushleft
5mm
\onelinecaptionstrue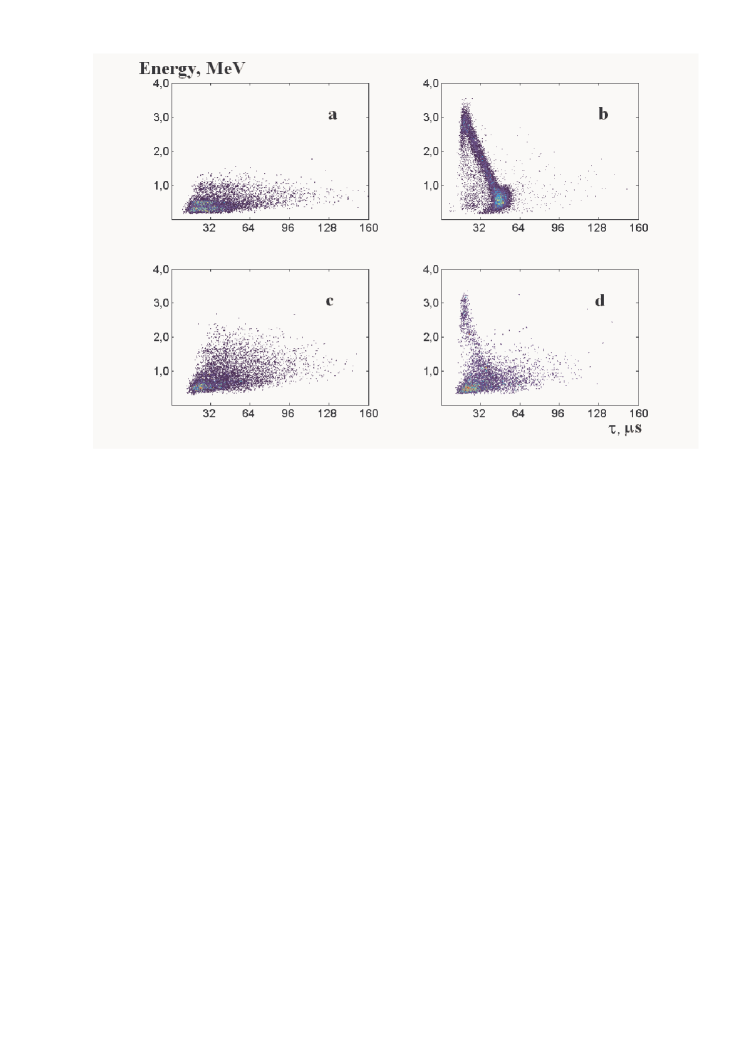 \captionstylenormal \captionstyleflushleft
5mm
\onelinecaptionstrue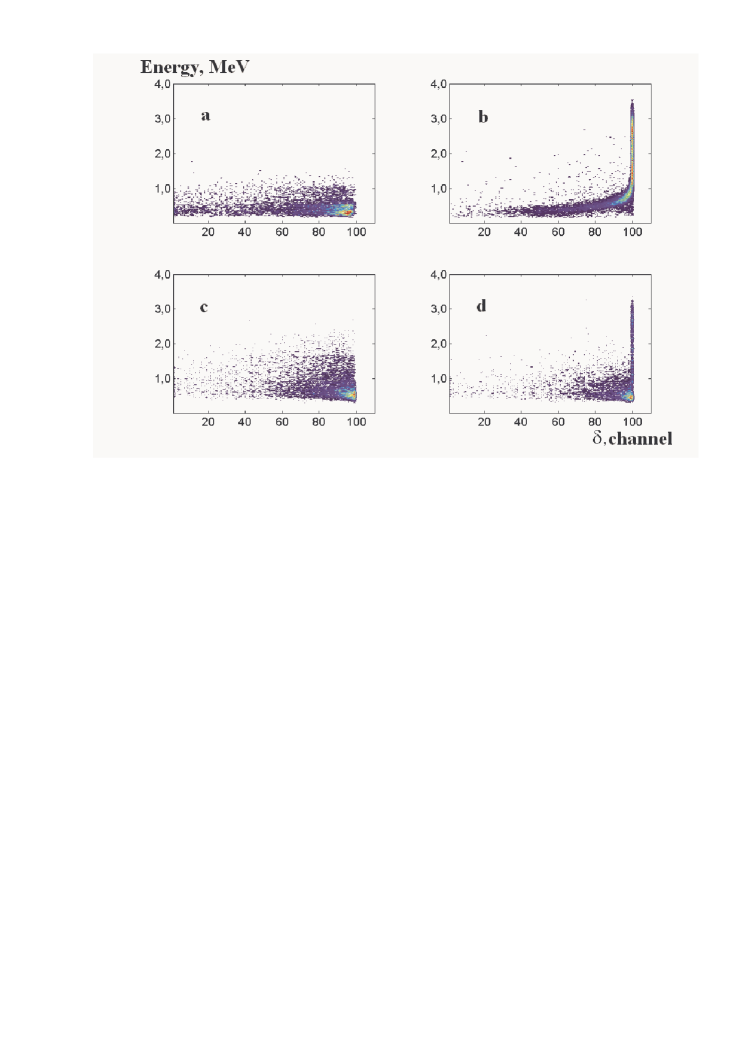 \captionstylenormal \captionstyleflushleft
5mm
\onelinecaptionstrue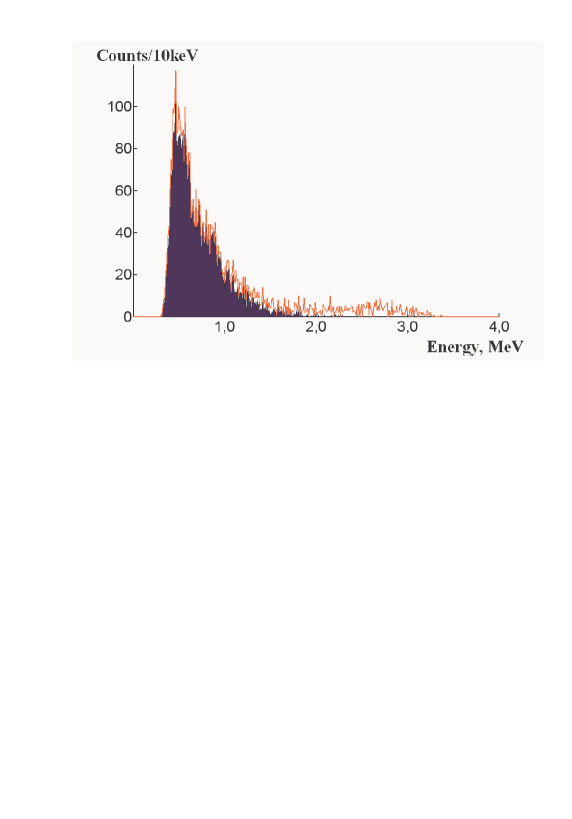 \captionstylenormal \captionstyleflushleft
5mm
\onelinecaptionstrue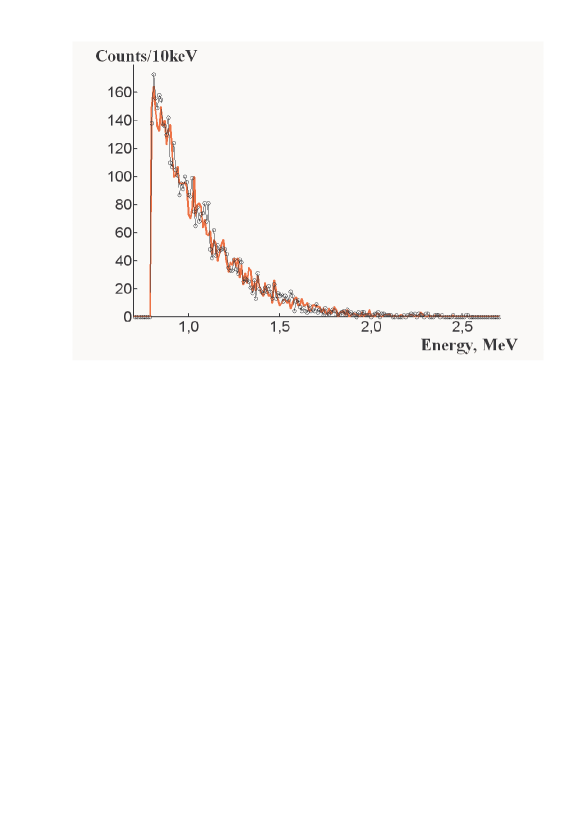 \captionstylenormal \captionstyleflushleft