Evidence for a long range structure in the pion emission source in Au+Au collisions at RHIC
Abstract
The PHENIX experiment has recently acquired 1 billion minimum bias Au+Au events at AGeV during the year-2004 run. This high statistics data set, coupled with a state-of-the-art analysis technique, allows for the extraction of 3D emission sources for various particle types. These 3D sources lend fresh insight into the nature of a long-range source previously reported by PHENIX. The new results indicate an anisotropic pion emission source in the pair center of mass system (PCMS) having an extended space-time extent oriented in the outward direction. The two-proton emission source from the same data set is essentially isotropic in the PCMS. These results provide a “window” for viewing the evolution dynamics of the high energy density nuclear matter created at RHIC.
1 Introduction
A de-confined phase of nuclear matter is expected to be formed at the high energy densities created in Au+Au collisions at RHIC[1]. An observation of the presence (or absence) of an emission source of large space-time extent for particle emission can provide important constraints for understanding the nature of this phase transition.
In recent measurements, the PHENIX Collaboration has observed a long range structure in the 1D two-pion emission source function for Au+Au collisions at AGeV [2]. This long range structure was resolved using the 1D Source Imaging technique of Brown and Danielewicz[3, 4]. The 1D technique does not give crucial directional information so a detailed analysis of the dynamical origin of this structure was not possible. To address this shortcoming, Danielewicz and Pratt introduced the more powerful technique of decomposing correlation functions into correlation moments using a cartesian surface-spherical harmonics basis [5]. In this representation, each moment (of a particular order) corresponds to a specific deformation ( i.e dipole, quadrupole etc ) of the 3D source function, and their extraction provide detailed 3D information about the emission source.
In this paper, we present the first application of the moment decomposition technique for the analysis of and pp pairs produced in Au+Au collisions at AGeV.
2 Experimental Setup and Data Analysis
The data presented here were taken by the PHENIX Collaboration during the year-2004 run. The colliding beams ( AGeV) were provided by the RHIC accelerator. Charged tracks were detected in the two central arms of PHENIX [6], each of which subtends 90 degrees in azimuth and 0.35 units of pseudo-rapidity. Tracking information was provided by a drift chamber followed by two layers of pad chambers. Particle identification was performed by an electromagnetic calorimeter and a time-of-flight wall.
3D correlation functions , C(), were obtained as the ratio of foreground to background distributions in relative momentum for and pp pairs. Here, is half of the relative momentum between the two particles in the PCMS frame. The foreground distribution was obtained using pairs of particles from the same event and the background was obtained by pairing particles from different events. The events used have a z-vertex position within cm from the center of the PHENIX spectrometer. Track merging and splitting effects were removed by appropriate cuts in the relevant coordinate space on both the foreground and background distributions. There was no significant effect on the correlation functions due to the momentum resolution of 0.7.
In the cartesian harmonic decomposition, the 3D correlation function is expressed as
| (1) |
where , , are cartesian harmonic basis elements ( is solid angle in space) and are cartesian correlation moments given by
| (2) |
The cartesian coordinate system is oriented such that z is parallel to the beam (longitudinal), x points in the direction of the total momentum of the pair in the PCMS frame (outward) and y is perpendicular to the other two axes (sidewards).
3 Results
Fig. 2 shows the l=0 moment (solid stars) and 1D correlation function C(q) (open stars) for pairs with GeV/c, from Au+Au collisions in the centrality range 0-30 of total cross section. Here, is the mean tranverse momentum of the two particles in the particle pair. The l=0 moment is essentially identical to the 1D correlation function as expected. We conclude that fig. 2 serves as a good consistency check of the moment calculation procedure.
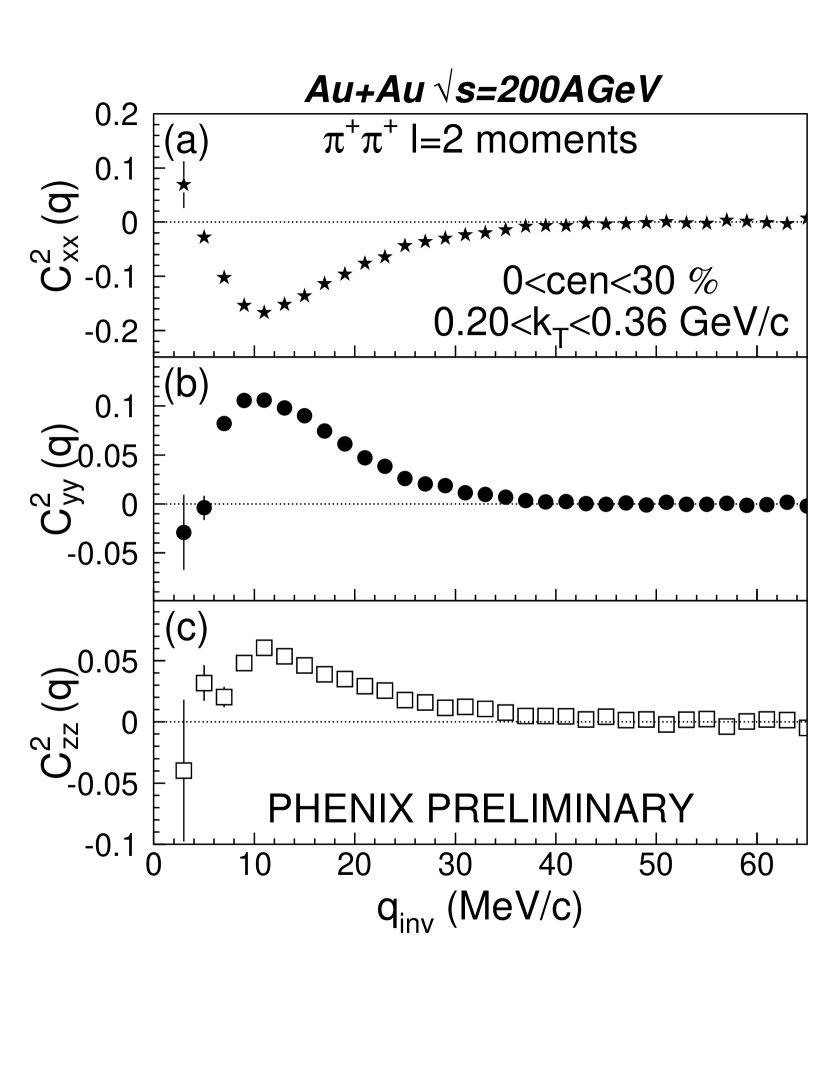
Figs. 2(a),(b) and (c) show the l=2 moments , and respectively for pairs with GeV/c, from Au+Au collisions in the centrality range 0-30. The non-zero values for the l=2 moments represent source anisotropies of a quadrupole nature and point to specific deformations in the direction specified by the moment. More specifically, the fact that is negative for all values indicates a negative contribution to the correlation function in the x (outward) direction. This is to be compared to the results for and which are both positive and hence represent positive contributions to the correlation function in the y (sideward) and z (longitudinal) directions. Thus, the overall correlation function, obtained by adding the l=0 and l=2 moments, is narrower in x and broader in the y and z directions, indicating the 3D source size is larger in x and smaller in y and z directions, as compared to the angle-averaged source size.
Fig. 4 shows the l=0 moment (solid stars) and 1D correlation function C(q) (open stars) for pp pairs for GeV/c, from Au+Au collisions in the centrality range 0-90. Again, the very good agreement between the l=0 moment and the 1D correlation function attests to the reliability of the moment calculation procedure.
Figs. 4(a),(b) and (c) show the l=2 moments , and respectively for pp pairs, with GeV/c, from Au+Au collisions in the centrality range 0-90. In contrast to the moments, the l=2 moments for the pp correlation function are all consistent with 0 within statistical fluctuations. Hence, the overall pp correlation function is the same in all 3 directions, namely the angle-averaged l=0 moment .


4 Discussion
Analysis of the 1D correlation function indicates a long range structure in the angle-averaged pion source function [2]. The cartesian moments, shown in Fig. 2, indicate that the correlation function is narrower in the outward direction compared to the sideward and longitudinal directions. The consequence of this is a source function which is more elongated in the outward direction in the PCMS frame.
This elongation must necessarily be due to prolonged emissions in the PCMS. A source isotropic in its rest frame, but breaking up instantaneously in the PCMS frame, would have been shortened in the outward direction by Lorentz factor . On the other hand, a source breaking up instantaneously in its own rest frame would lead to a source elongated in the PCMS by the factor in the outward direction. Here, non-simultaneity of emission and movement of the source would lead to overcompensation of the Lorentz contraction. The most extreme Lorentz elongation factor would be obtained under the assumption of a source freezing out instantaneously in the locally co-moving frame. However, such a source would be unlikely. Instead, a more plausible source might be one with a radial velocity along the pair momentum, that freezes out over a finite time in its frame. Further conclusions await the results of detailed model studies with global and/or dynamic parametrization of the emission.
In contrast to the pions, the cartesian moments for pp pairs, shown in Figs. 4 and 4, indicate that the proton source function is isotropic in the PCMS. This suggests a proton emission source having a velocity close to that for the pair velocity.
The current results constitute an important model constraint because a basic requirement will be to explain the pion and proton emission differences and the associated correlation anisotropies simultaneously.
5 Acknowledgements
The authors are grateful to Drs. P. Danielewicz and S. Pratt for fruitful discussions.
References
- [1] QM2002, Nucl. Phys. A 715, 1c (2003)
- [2] P. Chung et al, Nucl. Phys. A 749, 275c (2005)
- [3] D.A. Brown and P. Danielewicz, Phys.Lett.B 398, 252 (1997)
- [4] D.A. Brown and P. Danielewicz, Phys.Rev.C 57, 2474 (1998)
- [5] P. Danielewicz and S. Pratt, arXiv:nucl-th/0501003 (2005)
- [6] K. Adcox et al., Nucl.Instrum.Meth.A 499, 469 (2003)