PHENIX Collaboration
Jet Structure from Dihadron Correlations in d+Au collisions at =200 GeV
Abstract
Dihadron correlations at high transverse momentum in + Au collisions at = 200 GeV at midrapidity are measured by the PHENIX experiment at the Relativistic Heavy Ion Collider (RHIC). From these correlations we extract several structural characteristics of jets; the root-mean-squared transverse momentum of fragmenting hadrons with respect to the jet , the mean sine-squared of the azimuthal angle between the jet axes , and the number of particles produced within the dijet that are associated with a high- particle ( distributions). We observe that the fragmentation characteristics of jets in + Au collisions are very similar to those in collisions and that there is also little dependence on the centrality of the + Au collision. This is consistent with the nuclear medium having little influence on the fragmentation process. Furthermore, there is no statistically significant increase in the value of from to + Au collisions. This constrains the effect of multiple scattering that partons undergo in the cold nuclear medium before and after a hard-collision.
pacs:
25.75.-q,13.87.-a,24.85.+pI Introduction
Jet production in high energy collisions is a useful tool to study the passage of scattered partons through a nuclear medium. A dominant hard-scattering process is two partons scattering to produce two high- partons which then fragment to produce a dijet. In a nuclear environment the partons that participate in the collision can undergo multiple scattering within the nucleus, potentially changing the structure of the dijet. Such changes can provide information on the interaction of colored partons with the cold nuclear medium.
Some information on this interaction is already available at RHIC energies via the Cronin enhancement of the spectra Cronin et al. (1975). In + Au collisions at RHIC Adler et al. (2003a) Adams et al. (2003) Back et al. (2003) the cross-section for high- particle production in + Au collisions is enhanced compared to collisions, consistent with multiple scattering in the cold-nuclear medium increasing the transverse momentum of the partons. In this paper we report on a complimentary observable to the Cronin effect: the broadening of dijet distributions. Such broadening is directly related to the additional transverse momentum delivered to the partons during multiple scattering, and hence provides a complementary handle for comparison between experiment and theory.
Interpreting both + Au and Au + Au collisions requires solid knowledge of baseline collisions, especially those dijet events at midrapidity that contain two, nearly back-to-back, jets produced from a hard (large ) parton-parton interaction. Experimentally the jets are not exactly back-to-back and the acoplanarity momentum vector, , was measured in collisions at ISR energies to have a magnitude, , on the order of 1 GeV/cDella Negra et al. (1977). This was much larger than the expectation that was due to intrinsic parton transverse momentum governed by the hadron size, which would lead to 300 MeV/c. It was realized early Feynman et al. (1978) that additional gluon radiation either before or after the hard scattering will increase the value of and the dijet acoplanarity.
In collisions involving nuclei, multiple scattering within the nucleus increases the parton transverse momentum. E557 Stewart et al. (1990), E609 Corcoran et al. (1994), and E683 Naples et al. (1994) have all measured an increase in the dijet acoplanarity with atomic mass of the target. In the case of E683, they measured an dependence of for both and collisions. This dependence is expected since the number of scatterings should be proportional to the length traversed in the nucleus (). For large the extracted values are about 50% above that for collisions with the hydrogen target, implying that the multiple-scattering effects are as important to the broadening of the dijets as are the initial state effects at that energy. In the case of reactions, the measured values increase more slowly than Corcoran et al. (1994). Since the values show a strong energy dependence Naples et al. (1994), we need to establish the initial and multiple-scattering contributions to for p+A reactions at RHIC energies. The values are also known to be dependent on the of the parton-parton interaction, increasing with rising Angelis et al. (1980); Adams et al. (1994).
No model is currently available that can reproduce all data on the Cronin effect and dijet broadening although most include multiple scattering as the underlying mechanism. A recent review Accardi (2002) considered two large classes of models, 1) soft or Glauber scattering where the multiple scattering is either at the hadronic or partonic level and 2) semi-hard multiple scattering where the multiple scattering is at the partonic level.
In both the soft and hard scattering models, the increase is proportional to the product of the scattering cross section and the nuclear thickness function,
| (1) |
where is the number of interactions, is the impact parameter of the collision, is the multiple scattering cross-section, and is the nuclear thickness function. For the soft scattering models, is defined to be , the nucleon-nucleon scattering cross section, while for the semi-hard models is , the parton-nucleon semi-hard cross-section. In the specific case of hard sphere nucleon scattering Wang (2000) , where is the nuclear radius, which gives an increase in .
Both types of these models give the same trend in centrality and the same dependence on the target’s atomic mass. The difference between them is in the strength of the increase with respect to and how this changes with beam energy. We will compare the data in this paper to two specific implementations of the hard-scattering models from Qiu and Vitev Qiu and Vitev (2004), and Barnafoldi et al. Barnafoldi et al. (2004).
An alternative view of the Cronin effect was recently proposed by Hwa and Yang Hwa and Yang (2004a). These authors calculate the recombination of hard partons with soft partons released during the multiple collisions. Because this model reproduces the measured Cronin effect at RHIC without imparting successive transverse momentum kicks to the scattered partons, the authors suggest that there may be little to no increase in from to + Au collisions.
We also use jet-fragmentation observables to probe multiple scattering in cold nuclei, in particular , the RMS of the mean transverse momentum of hadrons with respect to the fragmenting parton, and the fragmentation function of the parton, , where is the fraction of the parton’s momentum that a hadron carries. If the parton suffers semi-hard inelastic collisions within the nuclear environment, the parton will lose energy and its subsequent hadronization will produce fewer high- fragments and more low- fragments. We cannot directly measure fragmentation functions via dihadron correlations, but we do measure the distribution of hadrons produced in association with a high- trigger particle. We plot these distributions as a function of , where is defined as
| (2) |
The motivation for the variable can be most easily seen in the simple case where for the trigger particle and the two hadrons are emitted back-to-back. In this case, is the transverse momentum of the scattered parton () and for the far-side . Relaxing the assumption on , there is still a simple relation between and for back-to-back jets at high-, where . Hence the distribution for hadrons emitted back-to-back from the trigger hadron can be related to the fragmentation function: for more details see the end of Section II.
There is considerable information on distributions from collisions. The CCHK collaboration Della Negra et al. (1977) demonstrated that the distribution scaled, i.e. the distribution was approximately independent of . Scaling at higher was also established by Fisk et al. Fisk et al. (1978), and the CCOR collaboration Jacob (1979); Angelis et al. (1979), providing support for the idea that fragmentation of high- partons is independent of the momentum of the parton.
This scaling is however approximate and scaling violation was understood by Feynman et al. Feynman et al. (1978) to be caused by the radiation of semi-hard gluons. Scaling violation of the fragmentation function is now well established experimentally (Abbiendi et al. (2004) and references therein). For the range considered in this paper ( GeV/c2), the fragmentation functions used in NLO calculations Kniehl et al. (2000) drop by 25% for over the range GeV/c2. At higher the fragmentation functions are less dependent on , e.g. the fragmentation drops by less than 20% at over the much larger range of GeV/c2.
In this paper we quantify the extent to which our measured distributions in + Au collision scale and compare the distributions to those from collisions at RHIC. The goal is to establish whether inelastic scattering in the cold medium or the recombination mechanism changes the effective fragmentation function. The distributions provide a stringent test the recombination model from Hwa and Wang Hwa and Yang (2004b). This model reproduces the Cronin effect in + Au collisions through shower thermal recombination mechanism and predicts an increase in jet associated multiplicity Hwa and Yang (2004b); Hwa and Tan (2005), i.e. an increase in the near-angle , in + Au relative to collisions.
The measured distributions in + Au also serve as a critical baseline for Au + Au collisions, where the strong energy-loss in the dense, hot medium is expected to dramatically change the shape of these distributions.
Our three goals for this paper are 1) to report the characteristics of jet structures in + Au collisions at RHIC energies, 2) to establish the extent to which multiple scattering changes these structures as a function of centrality and by comparison with data from collisions, and 3) to establish the baseline for jet-structure measurements in heavy ion reactions. Any difference between jet properties in Au + Au and + Au collisions should be attributable to the hot, dense nuclear matter created in the heavy ion collisions. The main results in this paper are presented in Section IV which details the measured values of , , and the , and distributions from + Au collisions at =200 GeV. These results are derived from the fitted widths and yields of two-particle azimuthal correlations which are reported in Section IV. The experimental methods used to obtain these correlations are described in Section III and the jet quantities we use throughout the paper are fully defined in Section II.
II Jet Angular (Azimuthal) Correlations
II.1 Two particle correlation
The defining characteristic of a jet is the production of a large number of particles clustered in a cone in the direction of the fragmenting parton. Traditionally, energetic jets are identified directly using standard jet reconstruction algorithms Huth et al. (1992); Catani et al. . In heavy-ion collisions, due to the large amount of soft background, direct jet reconstruction is difficult. Even in or collisions, the range of energy accessible to direct jet reconstruction is probably limited to GeV/c, below which the jet cone becomes too broad and contamination from the ‘underlying event’ background is significant. Jet identification is even more complicated for detectors with limited acceptance, such as the PHENIX central arms, due to leakage of the jet cone outside the acceptance.
The two-particle azimuthal angle correlation technique provides an alternative way to access the properties of jets. It is based on the fact that the fragments are strongly correlated in azimuth () and pseudo-rapidity (). Thus, the jet signal manifests itself as a narrow peak in and space. Jet properties can be extracted on a statistical basis by accumulating many events to build a distribution or a correlation function. Furthermore, we assume that the soft background is isotropic. Distributions in were initially used in the 70’s to search for jet signals in collisions at CERN’s ISR facility Angelis et al. (1980, 1982); Della Negra et al. (1977). More recently, distributions and correlation functions have been exploited for analysis of jet correlations at RHIC Adler et al. (2003b, c); Rak (2004); Adler et al. (2005a); Ajitanand (2003). A detailed discussion of the two-particle correlation method can be found in Jia (2005). These approaches overcome problems due to background and limited acceptance, and extend the study of jet observables to lower .
In the correlation method, two classes of particles are correlated with each other – trigger particles, and associated particles. Although the distinction between these two classes is artificial, trigger particles are typically selected from a higher range. In this work, we distinguish between two primary categories of correlations:
- Assorted- correlation (AC)
-
, where the ranges of trigger and associated particle do not overlap.
- Fixed- correlation (FC)
-
, where the ranges for trigger and associated particles are identical.
In this paper, correlations are further categorized via a scheme which uses the identity of the trigger and associated particles. Four different types of such correlations are presented. Denoting the trigger particle as and associated particle as ,
-
•
FC
The range of both the trigger and associated particle is GeV/c. -
•
AC
There are three different selections,-
1.
GeV/c with GeV/c
-
2.
GeV/c with GeV/c
-
3.
GeV/c with GeV/c
-
1.
-
•
AC
The trigger particle is a neutral pion and the associated particle is a charged hadron, where GeV/c with GeV/c. -
•
AC
The trigger particle is a charged pion and the associated particle is a charged hadrons, where GeV/c with GeV/c.
For each type of correlation, we study jet structures as a function of centrality and the momentum of the trigger and associated particles.

II.2 Extraction of , from the Correlation Function
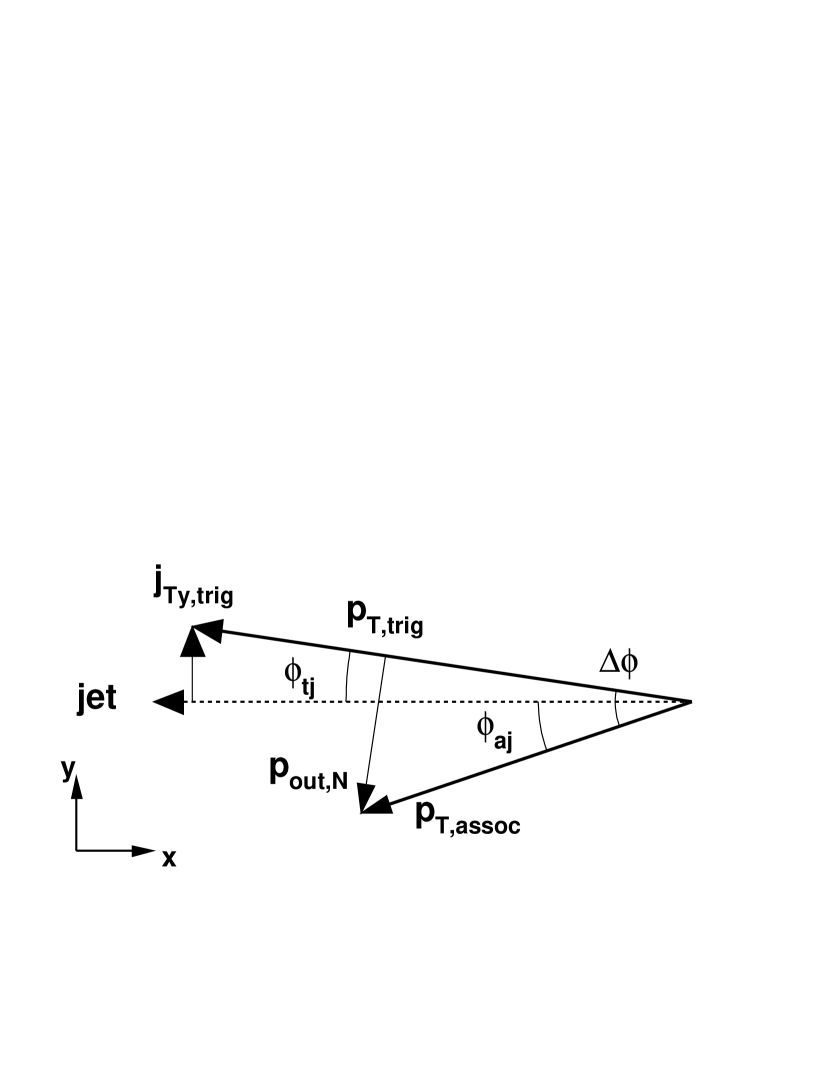
In this section, we discuss the framework for the two particle correlation method. Figures 1 and 2 illustrate the relation between the two particles and their parent jets, for the case when the parents are the same jet or the dijet, respectively. The figures also show the relationship between , and the kinematic variables describing the trigger and associated particle. is the component of the particle momentum perpendicular to the jet momentum. Its projection into the azimuthal plane is . The quantity (denoted with or for near- or far-side, respectively) is the component of the associated particle’s that is perpendicular to the trigger particle’s . The vector sum of and produces the dijet acoplanarity and the azimuthal angle between the jet axes is .
The RMS value of can be derived from the correlation functions. For the single jet fragmentation of Fig. 1, if we denote , , and as the angles between trigger-associated, trigger-jet and associated-jet, respectively, then the following relations are true:
| (3) | |||||
Assuming and are statistically independent, we have (cross terms average to 0) for the near-side,
| (4) |
Substituting the and terms from Eq. 3 into Eq. 4, we obtain the equation for the RMS value of
| (5) |
where .
In the gaussian approximation for the near-side azimuthal distributions, a simple Taylor expansion connects with the jet width, :
Since Eq. 5 contains the variable that depends on , we should calculate iteratively. In cases when trigger and associated particle are much larger than the typical value, the near-side jet width is small and . Hence Eq. 5 can be simplified as,
Since is the projection of hadron perpendicular to , is necessarily less than . So, for any given range, there is always a upper kinematic cut off on the distribution. This effect, known as the seagull effect, leads to a reduction on the observed from the expected value. It is important at low and becomes negligible once . The seagull effect can be parameterized and removed from the values Constantin (2004).
For the far-side correlation from Fig. 2 we have
| (8) | |||||
where is the azimuthal angle between the two jet axes. Expanding and dropping all cross terms (which average to 0), we get
| (9) | |||||
Note that since is the azimuthal angle between the jet axes, is one measure of the extent to which the jets are not back-to-back, and is hence a quantity that is sensitive to any additional scattering in + Au collisions. We express the right side in terms of the observables and , the rms widths of distribution that we measure by expanding the sine term
| (12) |
which is good to 2% for rms widths at 0.5 rad and good to 0.6% for rms widths of 0.2 rad. Therefore
| (13) |
The right hand side is now in terms of experimental observables which we will use to extract .
We have attempted to extract from . This requires assumptions on the scattered quark distribution, the magnitude of the momentum asymmetry between the partons due to the kt-kick, as well as the detailed shape of the fragmentation function. The current paper is focussed on the comparison between and + Au collisions, which can be made with . Hence we leave the extraction of to future work.
In this paper we report the RMS values of and , where In the literature, a value is sometimes reported as the geometrical mean, . The relation to the RMS value is .
II.3 Conditional Yields
We also present in this paper the associated yield per trigger particle, referred to as the conditional yield (CY), as a function of and . The CY is the number of particles produced in the same or opposite jet associated with a trigger particle
| (14) | |||||
| (15) |
and can be directly extracted from the measured Gaussian yields in the correlation functions.
To emphasize the importance of the , we note that it is related to the single- and two-particle cross sections:
| (16) |
The interpretation for the two-particle cross section depends on whether one is studying the near- or far-side jet correlations. The conditional yield for particles from the near-side jet depends on the dihadron fragmentation function, while the conditional yield from the far-side jet depends on two independent fragmentation functions: one parton fragments to produce a hadron with , while the other scattered parton on the far-side fragments to produce a hadron with . For the far-side conditional yield at high-, (see Eq. 2). Hence, and the slope of the far-side is times the slope of the fragmentation function .
III Experiment and Data Analysis
III.1 Data Collection
The data presented in this paper were collected by the PHENIX experiment at the Relativistic Heavy Ion Collider during the + Au and run of January – May 2003. During that time integrated luminosities were recorded of 2.7 nb-1 for + Au collisions and pb-1 for collisions each at =200 GeV.
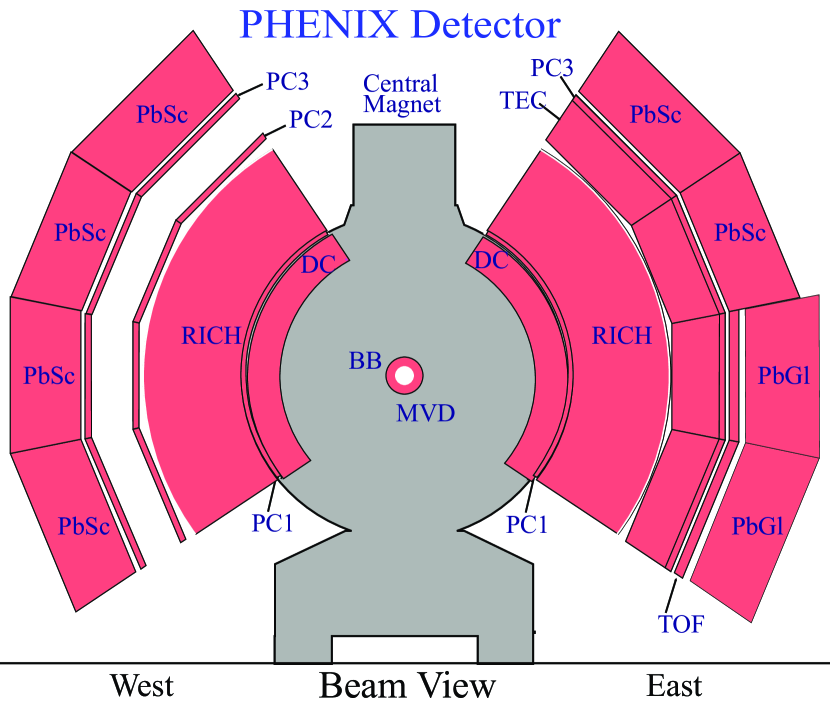
The PHENIX detector consists of two central spectrometer arms, two forward muon arms and several global detectors used for triggering, vertex detection, and centrality selection. This analysis utilizes the two central spectrometer arms that each cover a region of units of pseudorapidity and in azimuth. The spectrometer arms are not exactly back-to-back in azimuth, so while there is large acceptance for the detection of two particles separated by there is also finite acceptance for two particles separated by . Figure 3 shows a beam cross-section view of the PHENIX central spectrometer arms. A complete overview of the whole PHENIX detector is found in reference Adcox et al. (2003a). In this section we will only focus on those subsystems relevant for the analysis of the dihadron data.
III.1.1 Global Event Characteristics
For event characterization the Beam-Beam Counters (BBCs) Allen et al. (2003) are utilized. The BBCs are sets of 64 Cherenkov counters placed symmetrically along the beam line, covering units of pseudorapidity and located 144 cm from the center of the interaction region. The BBCs determine the event vertex and the initial collision time, , from the time difference between particles reaching each BBC. For this analysis we include only events with an offline cut of 30 cm.
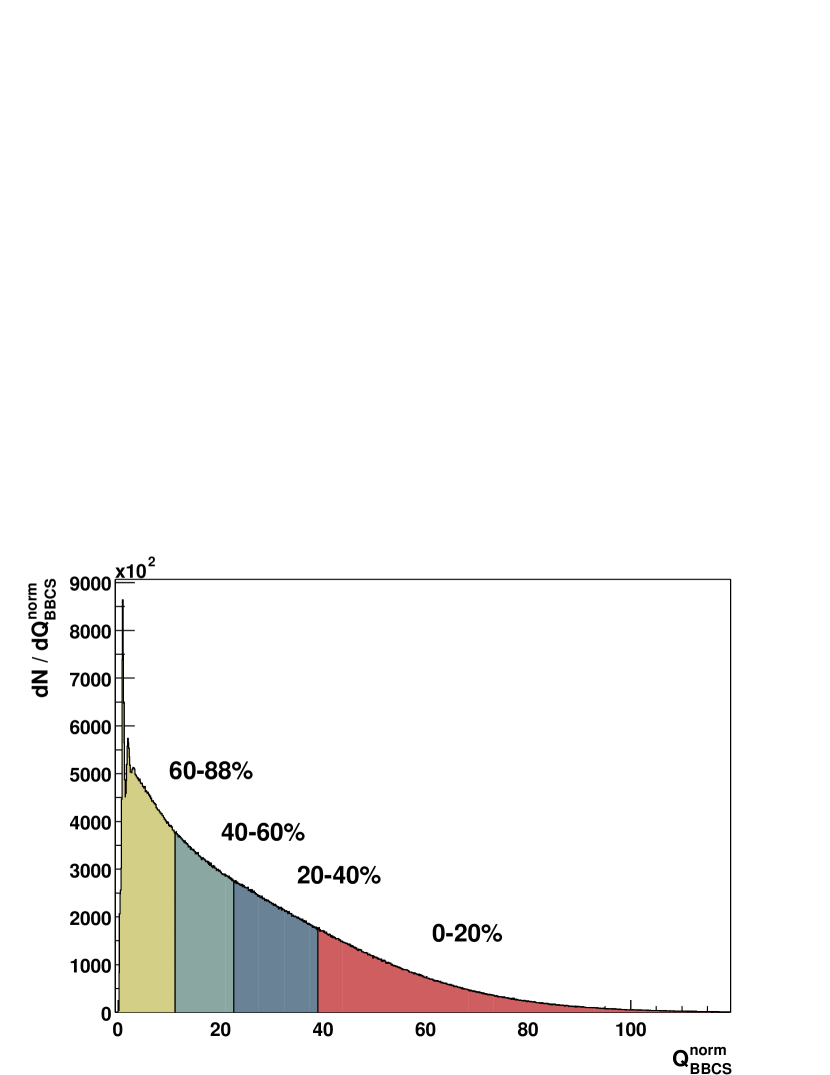
The BBC facing the direction of the Au beam was used to determine the centrality. Fig. 4 shows the BBC charge distribution and the centrality classes used in this analysis. The centrality is defined as
| (17) |
where frac is the fraction of the total BBC charge distribution integrated from zero to and is the efficiency of the minimum bias trigger. This centrality can be related to the mean number of Au participants, , and mean number of collisions, . To determine the centrality we model the BBC charge distribution as a negative binomial distribution with a width and mean proportional to . So, for a given centrality, there are several negative binomial distributions (defined by ) that contribute to the overall distribution and as such is not uniquely defined. We calculate a weighted average of , where the weight is given by the negative binomial distribution for a given and the probability for having a collision with . The latter probabilities were computed using a Glauber model, with a Hulthen wave function for the deuteron and an inelastic cross section of 42 mb. Finally, the was determined for a given from the same Glauber model. The resulting centrality bins and used in this analysis are outlined in Table 1.
| Percent | ||
|---|---|---|
| 0–20% | ||
| 20–40% | ||
| 40–88% |
The dihadron events were recorded using several different Level-1 triggers. The minimum bias trigger required at least one hit in each of the BBCs and that the collision vertex (computed online) satisfies 75 cm. It was sensitive to 88.5% of the inelastic + Au cross section. PHENIX also employed a series of Level-1 triggers to select electrons, photons and, with lower efficiency, high- hadrons. These triggers are called the ERT triggers and they utilized the Ring Imaging Cerenkov (RICH) for electron identification, together with the Electromagnetic Calorimeter (EMC) Aphecetche et al. (2003), which consists of 8 sectors, 6 of which are Lead-Scintillator (PbSc) sampling calorimeters and 2 are Lead-Glass (PbGl) Cherenkov counters. The EMC has excellent timing and energy resolution for electromagnetic showers. The ERT triggers were produced by summing signals from tiles, where a tile was 4x5 photo-multipliers (PMTs) in the RICH and either 2x2 or 4x4 PMTs in the EMC.
The electron trigger was defined by the coincidence between the minimum bias trigger and the RICH and EMC 2x2 trigger where the threshold for the RICH tile was 3 photo-electrons and the EMC threshold varied between 400–800 MeV. Three different thresholds were available for the 4x4 photon triggers. These thresholds differed between the PbGl and PbSc and varied within and between the and + Au runs. The lowest threshold setting (1.4 GeV–2.8 GeV) was most sensitive to hadron showers in the EMC. The threshold values and rejection factors () for the ERT triggers, in coincidence with the minimum bias trigger, are given in Table 2. The correlations use only the minimum bias triggered data, while the correlations use only the ERT photon triggers. The correlations use the minimum bias, ERT photon and ERT electron triggers. A detailed knowledge of the ERT trigger efficiency is not necessary, since we present the conditional yield distributions per trigger, for which this efficiency cancels out.
| + Au | + Au | |||||
|---|---|---|---|---|---|---|
| PbSc threshold | PbGl threshold | PbSc threshold | PbGl threshold | rejection | rejection | |
| Gamma1 | 2.1 GeV | 2.1 GeV | 2.8 GeV | 3.5 GeV | 400–1200 | 125–300 |
| Gamma2 | 2.8 GeV | 2.8 GeV | 2.8–3.5 GeV | 3.5–4.2 GeV | 1500 – 3100 | 450–900 |
| Gamma3 | 1.4 GeV | 1.4 GeV | 2.1 GeV | 2.8 GeV | 70–160 | 15–60 |
| Electron | 0.4–0.8 GeV | 0.4–0.8 GeV | 0.6–0.8 GeV | 0.6–0.8 GeV | 5–1200 | 30–170 |
III.1.2 Tracking and Particle Identification
In this section we discuss the tracking and identification of the particles used in the different correlation analyses. There are three types of particles included: Charged hadrons are used in all analyses, neutral pions are used as trigger particles for the correlations and charged pions are used as trigger particles for the correlations.
Charged hadron tracks are measured outside the PHENIX central magnetic field by the Drift Chamber (DC), located 2.0 m from the vertex, and two layers of multi-wire proportional chamber (PC1 and PC3), located 2.5 and 5.0 m, respectively, from the vertex Adcox et al. (2003b). The DC determines the momentum and the azimuthal position of the track, while PC1 determines the polar angleMitchell et al. (2002). The momentum resolution is determined to be (GeV/)Adler et al. (2003a). Tracks are confirmed by requiring that an associated hit in PC3 lies within a (for ) or (for ) matching window in both the and directions. This cut reduces the background from particles not originating in the direction of the vertex. The remaining background tracks are mainly decays and conversion particles Adler et al. (2004). The background level for single-tracks is less than 5% below 3 GeV/, increasing to about 30% at 5 GeV/. However, the background is smaller for high- triggered events (see Section III.2). The charged particle tracking efficiency for the active region of the DC, PC1 and PC3 is better than 98%. Since we perform a pair analysis, the two track resolution is important. For the DC, the two track separation is better than 1.5 mm, while at PC1 it is 4 cm and at PC3 it is 8 cm.
Neutral pions are detected by the statistical reconstruction of their decay channel. These decay photons are detected by the EMC and identified by their time-of-flight (TOF) and shower shape. The electromagnetic shower shape is typically characterized by the variable Aphecetche et al. (2003),
| (18) |
where is the energy measured at tower and is the predicted energy for an electromagnetic particle of total energy . This value is useful for the discrimination of electromagnetic from hadron showers. The and TOF cuts used give a very clean sample of photons with contamination of other particles at .
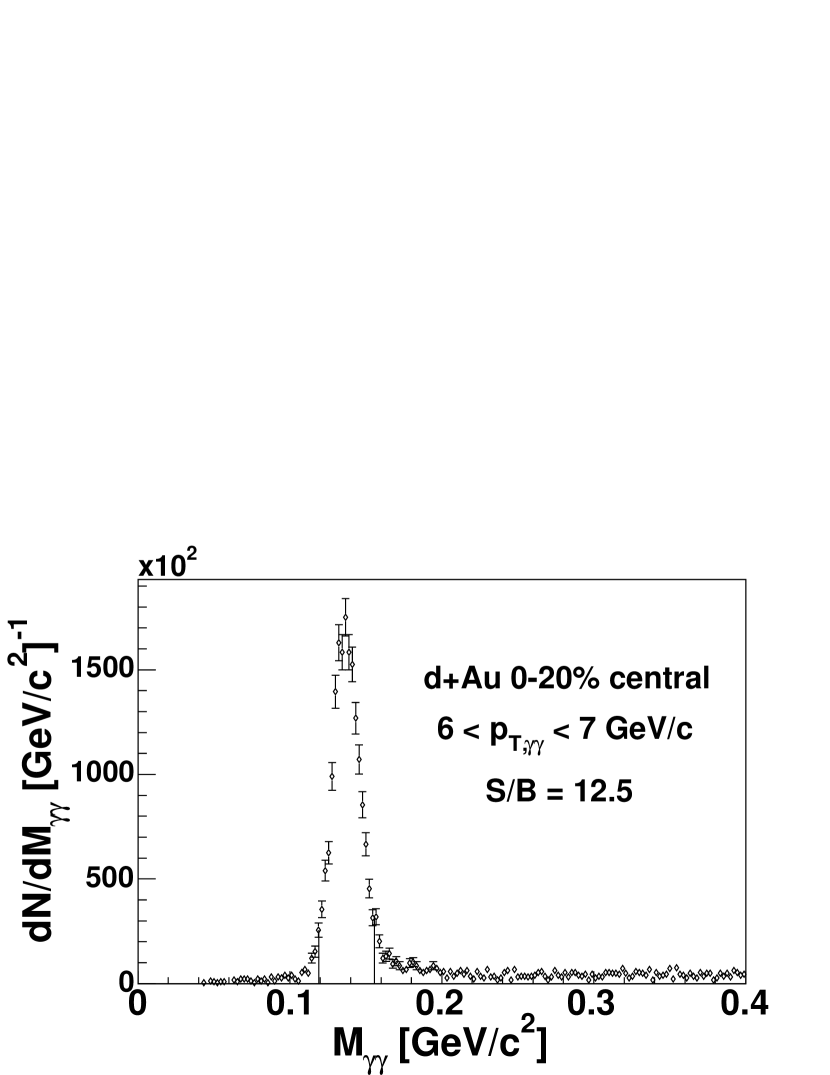
Using pairs of photons that pass these EMC cuts, we create the invariant mass spectra for each photon pair . A sample invariant mass distribution with a S/B of approximately twelve is given in Fig. 5. The background distribution can be reproduced by mixing clusters from different events and normalizing that distribution to the real event distribution outside the mass region. The peak position and width of the invariant mass distribution were parameterized as a function of pair , in order to select candidates from a region of invariant mass within of the peak position. The S/B for a with 5 GeV is , increasing as a function of . There is a slight dependence on centrality with the S/B decreasing with increasing centrality.
PHENIX identifies high momentum charged pions with the RICH and EMC detectors. Charged particles with velocities above the Cherenkov threshold of (CO2 radiator) emit Cherenkov photons, which are detected by photo-multiplier tubes (PMTs) in the RICH Aizawa et al. (2003). This threshold corresponds to 18 MeV/ for electrons, 3.5 GeV/ for muons and 4.9 GeV/ for charged pions. In a previous PHENIX publication Adler et al. (2004), we have shown that charged particles with reconstructed above 4.9 GeV/, which have an associated hit in the RICH, are dominantly charged pions and background electrons from photon conversions. The efficiency for detecting charged pions rises quickly past 4.9 GeV/, reaching an efficiency of at GeV/.
To reject the conversion backgrounds in the pion candidates, the shower information at the EMC is used. Since most of the background electrons are genuine low particles that were mis-reconstructed as high particles, simply requiring a large deposit of shower energy in the EMC is very effective in suppressing the electron background. In this analysis a momentum dependent energy cut at EMC is applied
| (19) |
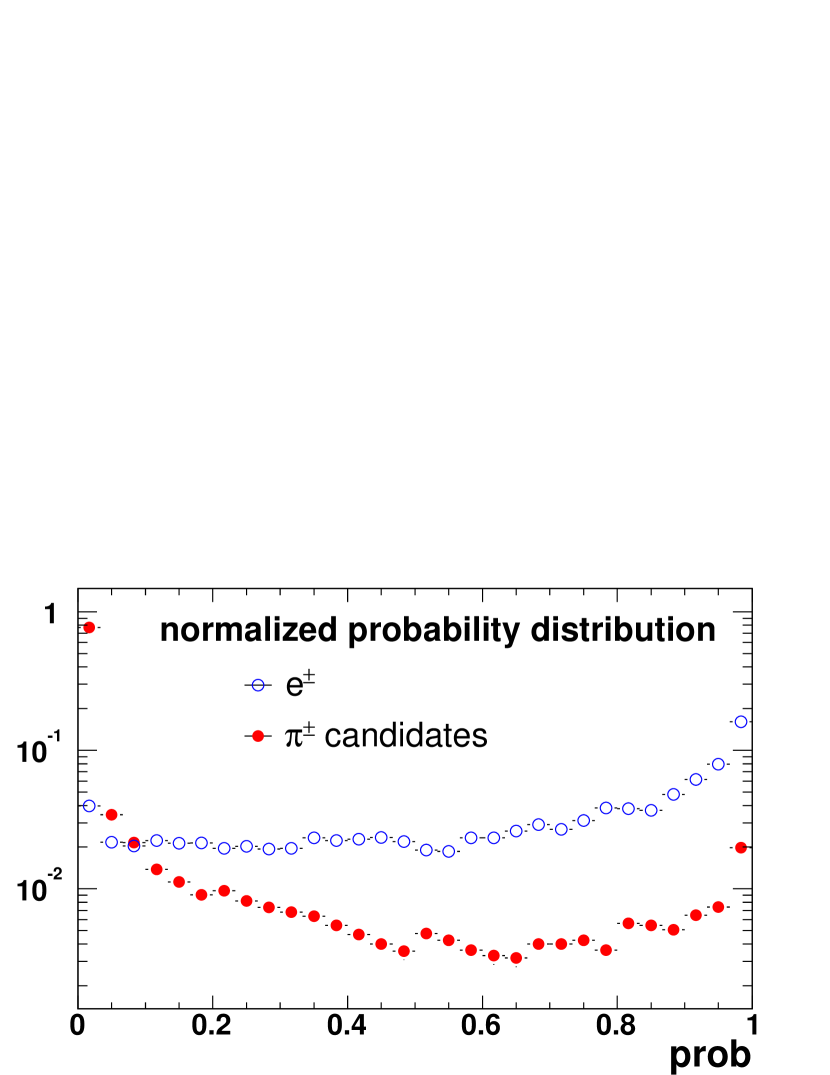
In addition to this energy cut, the shower shape information Aphecetche et al. (2003) is used to further separate the broad hadronic showers from the narrow electromagnetic showers and hence reduce the conversion backgrounds. In this analysis we use the probability (prob) calculated from the value (Eq. 18) for an EM shower. The probability values range from 0 to 1, with a flat distribution expected for an EM shower and a peak around 0 for a hadronic shower. Fig. 6 shows the probability distribution for the pion candidates and electrons, normalized by the integral, where the pions candidates were required to pass the energy cut and the electrons were selected using particle ID cuts similar to that used in Ref. Adler et al. (2005b). Indeed, the electron distribution is relatively flat, while the charged pions peak at 0. A cut of prob selects pions above the energy cut with an efficiency of %. Detailed knowledge of the pion efficiency is not necessary, since we present in this paper the per trigger pion conditional-yield distributions, for which this efficiency cancels out.
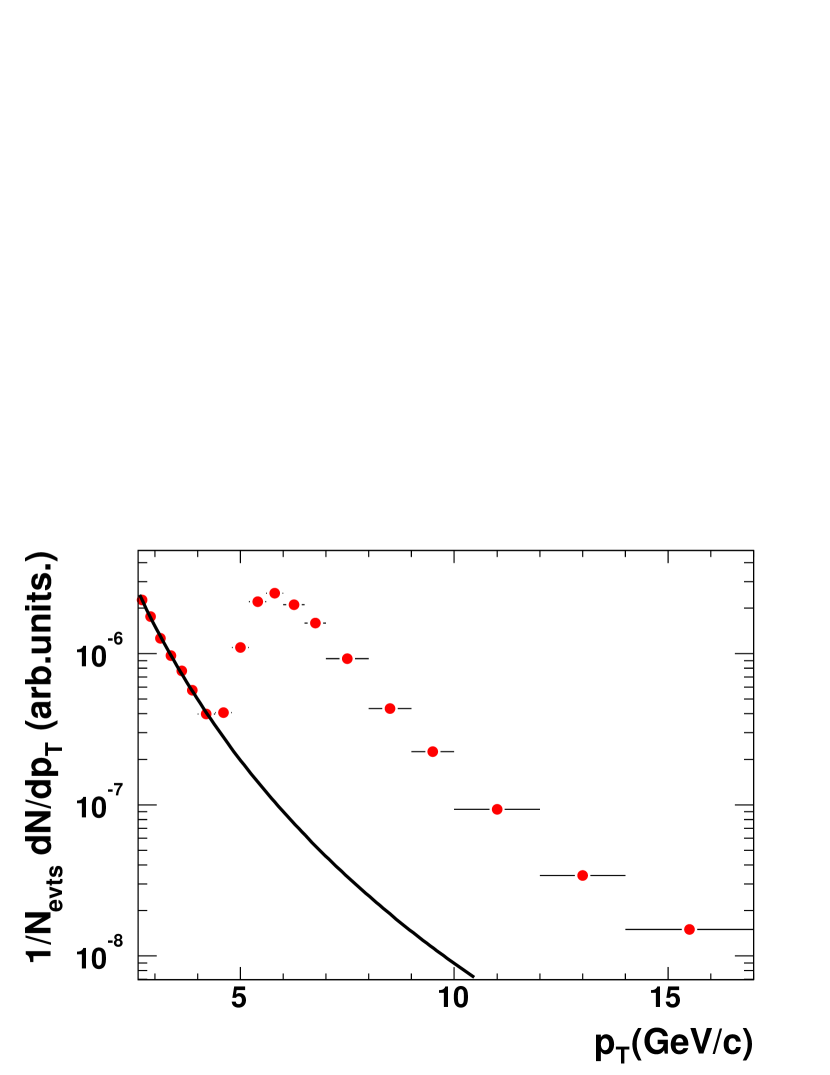
Since the energy and prob cuts are independent of each other, we can fix one cut and then vary the second to check the remaining background level from conversions. The energy cut in Eq. 19 is chosen such that the raw pion yield is found to be insensitive to the variation in prob. Fig. 7 shows the raw pion spectra for ERT triggered events as function of , with the above cuts applied. The pion turn on from GeV/ is clearly visible. Below of 5 GeV/, the remaining background comes mainly from the random association of charged particles with hits in the RICH detector. The background level is less than 5% from GeV/, which is the range for the charged pion data presented in this paper.
III.2 Data Analysis
In this section we outline the method to obtain correlation functions and distributions. From these we extract the jet shapes and yields outlined in Section II. For the extraction of the jet-yield from the azimuthal distributions we discuss how we obtain the absolute normalization of the distribution, while for the jet shape properties, and , the absolute normalization is not necessary.
III.2.1 Correlation Functions
Azimuthal correlations functions are generally defined as
| (20) |
Similarly, one can also define the correlation function in pseudo-rapidity,
| (21) |
The same-event pair distribution, or , is constructed for trigger-associated particle pairs. The mixed-event pair distribution, or , is determined by combining trigger particles with associated particles from randomly selected events.
This definition of the correlation function relies on the fact that detector acceptance and efficiency cancels. It is therefore important that the pair efficiencies of the average mixed event background and the average foreground distributions are the same. For this reason we generate mixed event distributions only for events with similar centrality and event vertex. More precisely, mixed events were required to match within 10% centrality and the event vertices were also required to be within 3 cm. For correlations the real and mixed events are minimum bias data. For correlations the real and mixed events are ERT-triggered data. For correlations the real events are ERT-triggered and minimum bias data while the mixed events mix ERT-triggered events with minimum bias events.
For and correlations, due to finite two track resolution for charged particles at the DC and PC, the reconstruction efficiency for same-event charged track pair drops at small and . To minimize the difference of the pair efficiency between and , the pairs are required to have a minimal separation of about two times the resolution at the various tracking detectors. This corresponds to about 0.28 cm, 8 cm and 15 cm at the DC, PC1 and PC3, respectively. However, these pair cuts are not required for correlations, because different detector subsystems are used for reconstructing trigger- and the associated charged tracks as outlined earlier.
Given the similarity of the analysis techniques between and correlations, in this paper we focus on the correlation. The correlation functions are obtained with two different normalizations. For assorted correlations, the correlation function is area normalized
| (22) |
The details concerning this normalization are discussed in Section IV.1. The second normalization is used in both the and correlations. It was shown in Ref Jia (2005) that the can be derived from the measured correlation function with an appropriate normalization,
| (23) |
where and are the true and detected number of triggers respectively, and is the average single particle efficiency for the associated particles in in azimuth and in pseudo-rapidity. corrects for the loss of jet pairs outside a given acceptance, determined by PHENIX’s finite acceptance in . This second normalization is defined so that the integral of the resulting correlation function should be , the total number of pairs per trigger particle in a given azimuthal and eta range.
For the normalization in Eq. 23 there are two separate efficiencies that must be determined, the correction and the single particle efficiency. The near-side correlation has a well-behaved peak around . As we show in Section IV.1, the near-side jet width in and are consistent with each other within errors. So we correct the near-side yield to the full-jet yield assuming the shape of the jet is Gaussian and the widths are equal in and . This correction, according to Ref. Jia (2005), is
| (24) |
where represent the PHENIX pair acceptance function in . It can be obtained by convoluting two flat distributions in , so has a simple triangular shape: . The PHENIX single particle acceptance is flat in to within 5%.
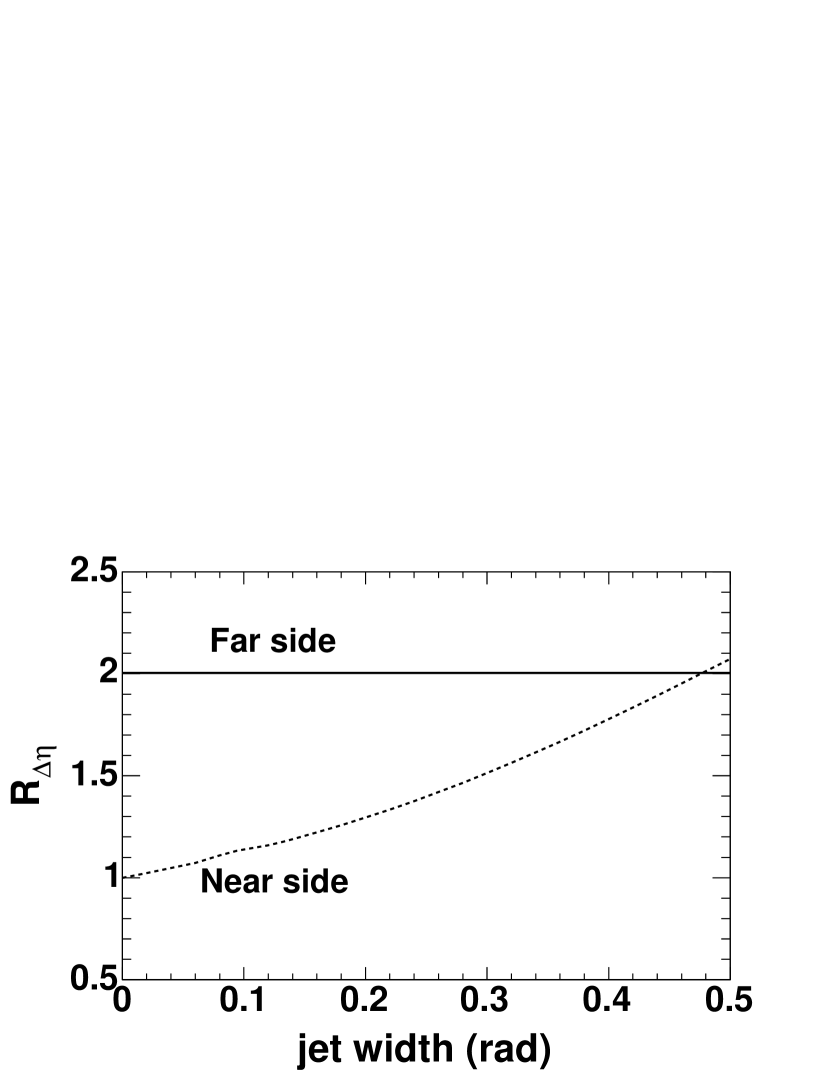
In the far-side the jet signal is much broader than the PHENIX acceptance due to the broad range of momentum-fraction of the partons that participate in the hard-scattering. In fact, we studied the far-side jet shape for correlation (Fig. 17b) and found the true jet correlation strength is almost constant in the PHENIX pair acceptance . Based on that, we assume that the far-side jet strength is constant and correct the far-side yield to the corresponding accessible pair range of ,
| (25) |
equals two, because the pair efficiency has a triangular shape in , which results in 50% average efficiency when the real jet pair distribution is flat in . Figure 8 shows the correction factor as a function of jet width. The typical range of the near-side jet width in all analysis (see Section IV.1) is below 0.5 radian. The maximum correction is about a factor of 2 for the near-side jet.
The single particle efficiency for associated particles, , includes detector acceptance and reconstruction efficiency. It is evaluated in a way similar to previously published Au + Au Adler et al. (2004) and Adler et al. (2003a) analyses. However, the jet associated charged hadron spectrum in is much flatter than the inclusive charged hadron spectra 111For example in Fig. 21, the jet associated yields decreases by a factor of 100 from 0.5 to 5 GeV/. However the typical single inclusive hadron spectra decrease by a factor of 100000 Adler et al. (2003a)., so the corrections due to momentum scale and momentum resolution are much smaller than that for inclusive charged hadron. For the same reason, the background contamination at high , mainly coming from decay and photon conversions which are falsely reconstructed as high tracks Adler et al. (2004, 2003a), is also reduced. We studied both effects using a full GEANT simulation of PYTHIA events through PHENIX detectors. The jet associated yields were extracted in the same manner as for the real data analysis. By comparing it with the input jet associated yield spectra, we can quantitatively study the effect of momentum smearing and high background contamination. The corrections due to momentum scale and resolution are found to be less than 5% with 3% systematic errors. For high- triggered events, the background contamination to the associated charged hadrons is found to be 5% independent of from GeV/.
III.2.2 Extracting jet properties
The normalized correlation functions and conditional yield distributions are both fitted with a sum of two Gaussians to extract the jet widths and the conditional yield of hadrons in the near-side () and far-side (). The fit for the normalized correlation functions is described in Section IV.1. For the conditional yield, we fit with the following function
| (26) |
where reflects the combinatoric background level in the real distribution relative to the mixed distribution and the other two terms represent the near-side jet and far-side jet signal, respectively. The resulting widths, and , are then used to calculate the jet shapes via Eqs. II.2 and 13. For each choice of trigger and associated particle range, YieldN and YieldF directly reflects the jet associated yield, at the near and far-side, respectively.
Two methods were used to calculate the distribution. The first method was used for correlations. Since these correlations are binned in there is a distribution of for each trigger-associated bin. This distribution is approximately Gaussian. The fitted peak value is used as the bin center of the distributions and the fitted gaussian width is used as the horizontal error bar. To estimate the bin-width in , we used the definition Eq. 2 which can be written as (ignoring the sign) . We estimate and write the bin-width as
| (27) |
where we have an associated bin from [,] and a trigger bin with a mean .
The second method is adopted by analysis. It is statistically based and can be used to calculate the distribution for any pair variable , , , , , etc. In the following we show two examples: the and distributions. For each pair we calculate the and value, then from Eq. 23 we calculate the same correction factor that was used for the distribution.
| (28) |
If this weight is used to fill the histogram for the real and mixed distribution, we obtain the for the true real pairs,
| (29) |
and for the mixed pair the sum should be one by definition,
| (30) |
Thus the jet signal can be extracted as
consistent with Eq 26.
When this weight is used to fill the histogram for both real and mixed distributions, we obtain the by subtracting the mixed distribution from the real distribution,
Equation III.2.2 is rather trivial, because the weighting procedure is equivalent to Eq. 23, for which we know the shape of the distribution (Eq. 26). But the advantage of the weighting procedure is that it allows for the determination of the absolute background pair distribution in any pair variables.
Similarly, the statistical method is used to extract the and spectra as
By construction, the integral of the jet yield should be conserved independent of the pair variable used, i.e.:
| (35) | |||
III.3 Systematic Uncertainties
The correlation analyses presented here consist of several steps ranging from the generation of correlation functions to the extraction of the final physics variables (, , per trigger yields, etc.) from these correlation functions. Systematic error estimations for each of these steps have been evaluated and combined to determine the overall error quoted for each measurement. All errors quoted are maximum extent.
Systematic errors associated with the generation of correlation functions can result from shape distortions in either the foreground or the background distributions. These distortions can arise if the requisite quality cuts (see section III.1) are not stable. In order to minimize such errors, the track-pair and quality cuts were assigned such that the correlation functions were essentially insensitive to reasonable cut variations. Systematic errors associated with such cut variations are estimated to be less than 4%. A further source of systematic errors is related to the efficiency of the background rejection when requiring a confirmation hit in the outer pad chamber. The yields have been corrected for remaining background. The systematic error on the background estimate is 3% for tracks with a transverse momentum () 4 GeV/ and 7% for particles with 4 6 GeV/. For the calculation of the conditional yields, the systematic error is dominated by the uncertainties associated with the determination of the efficiency corrected single particle yields. These systematic errors have been estimated to be 10% as obtained from Ref Adler et al. (2003a). This error has two parts; the normalization error includes the error on PC3 matching and active area. The momentum smearing error includes contributions from momentum resolution and momentum scale.
A separate error is estimated for correlations due to the background contamination of the s within the mass bin. To estimate the width and yield contribution of the background pairs, we created correlations of outside the mass with hadrons. From these we extrapolated the background contribution at the mass. These systematic errors are -dependent. For the near and far angle width the variation is %, the near yield variation is 1%, the far yield variation is % and increases with increasing .
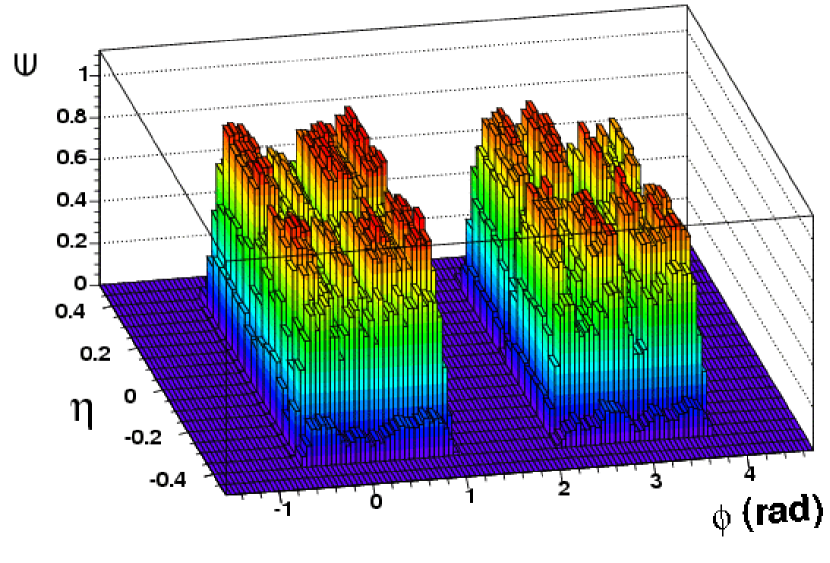
The event mixing technique has been used to correct for the limited detector acceptance and inefficiency. In addition, the has been corrected for limited coverage. To cross check these procedures we have run a detailed simulation using the PYTHIA event generator Sjostrand et al. (2001) coupled to a single particle acceptance filter that randomly accepts charged particles according to the detector efficiency. In the following, we shall use as an example for this cross check. Figure 9 shows a typical PHENIX two dimensional single particle acceptance used in this analysis.
We generated 1 million PYTHIA events, each required to have at least one GeV/ charged pion. To speed up the event generation, a cut of 100 GeV2 on the underlying parton-parton scattering is required. These events were filtered through the single particle acceptance filter. As an approximation, we ignore the dependence of acceptance. The same event and mixed pair distributions were then built by combining the accepted and charged hadrons. The jet width and raw yield were extracted by fitting the with a constant plus double gaussian function. The raw yields were then corrected via Eq. 24 to full jet yield for the near-side and the yield in for the far-side. We also extracted the true and jet width without the acceptance requirement. The comparison of the and jet width with and without the acceptance requirement are shown in Fig.10. The trigger particles are with GeV/, the associated particles are . In the near-side, the corrected yield (top left panel) and width (bottom left panel) are compared with those extracted without acceptance filter. In the far-side, the yield corrected back to (top right panel) and the width (bottom right panel) are compared with those extracted without the acceptance filter. The data requiring the acceptance filter are always indicated by the filled circles, while the expected yield or width are indicated with open circles.
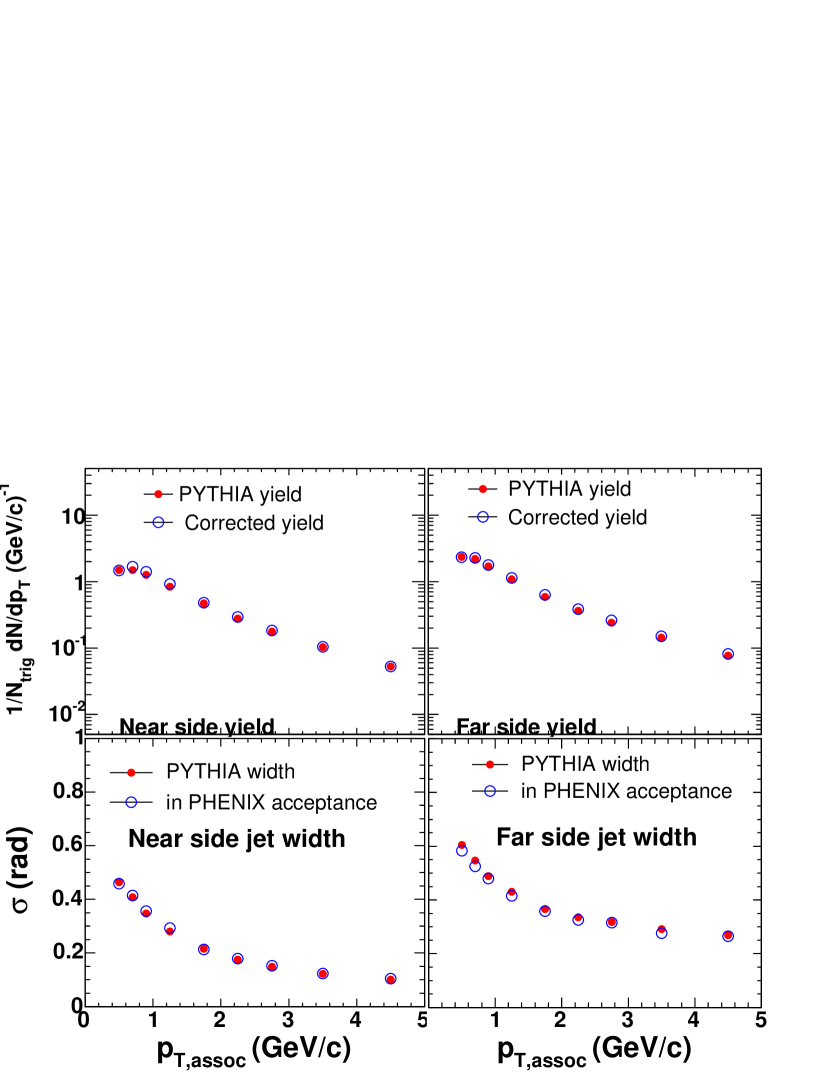
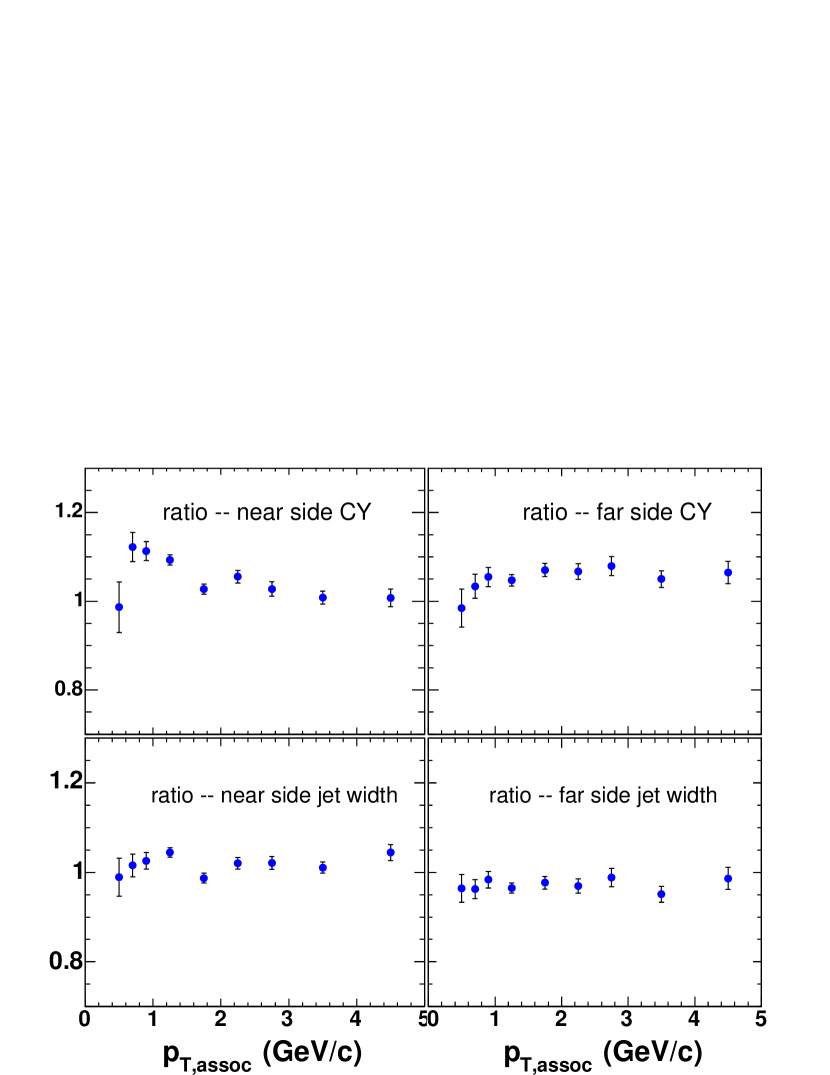
The agreement between the two data sets can be better seen by plotting the ratios, which are shown in Fig. 11. The yields agree within 10% and the widths agree within 5%. Since , are derived from the jet widths, the agreement in width naturally leads to the agreement in the and . One notices that there are some systematic differences in the comparison of the yield at low . This might indicate that the Gaussian assumption is not good enough when the jet width is wide and the extrapolation for become sizeable. (At GeV/, the jet width (rad) and the extrapolation is about 20%.).
The approximations in the formulas used to extract and are used to estimate the systematic error on these quantities. We estimate the systematic uncertainty in the formulation at the level of 5% for the and 3-4% for the .
| Error source | |
|---|---|
| tracking cuts, pair cuts | |
| assumptions used in formula | |
| S/B correction ( only) |
| Error source | 4 GeV/ | GeV/ |
|---|---|---|
| quality cuts | 4% | 4% |
| background correction | 3% | 30% |
| error on single particle yields | 10% | 10% |
| Pair cuts | 3% | |||
| Single Particle | normalization | 6.5% | ||
| p smearing (reso+scale) | 3% | |||
| near-side yield | 1% | |||
| S/B | (GeV/) | 2 | 3 | |
| far-side yield | 5% | 2% | 1% | |
| normalization | 6.5% | |||||
| Single Particle | p smearing (reso+scale) | 3% | ||||
| trigger pion background | 5% | |||||
| centrality dependent part | 5% | |||||
| (GeV/) | 1 | |||||
| pair cuts | 1% | 1% | 2% | 3% | 4% | |
| Yield Extraction | near-side yield | 20% | 10% | 6% | 6% | 6% |
| far-side yield | 6% | |||||
| error on the fit | % | 6% | 4% | 4% | 4% | |
| (GeV/) | 0.5 | |||
|---|---|---|---|---|
| yield extraction (near) | 8% | 15% | 20% | 20% |
| yield extraction (far) | 8% | 15% | 20% | 30% |
| other errors | 10.6% | 10.6% | 10.6% | 10.6% |
Table 7 summarizes the systematic errors for the extracted widths, and , while Tables 7, 7, and 7 summarize the list of systematic errors on the for the hadron-hadron, neutral pion-hadron, and charged pion-hadron correlations, respectively. Table 7 outlines the systematic errors on the extraction from pion-hadron correlations.
IV Results
We present the minimum bias and centrality dependent results on extracted jet widths and yields in Section IV.1, which are used in Section IV.2 to calculate quantities describing the jet-structures: the values of , , and jet fragmentation conditional yields and . The minimum-bias + Au results are compared with results from in Section IV.3 to establish the extent of effects due to medium modification in + Au with as much statistical precision as possible. The + Au centrality dependence of the derived quantities is presented in Section IV.4. This provides a larger lever-arm in nuclear thickness function, at the cost of dividing the available minimum-bias data into different centrality bins.
IV.1 Correlation Functions, Widths and Yields
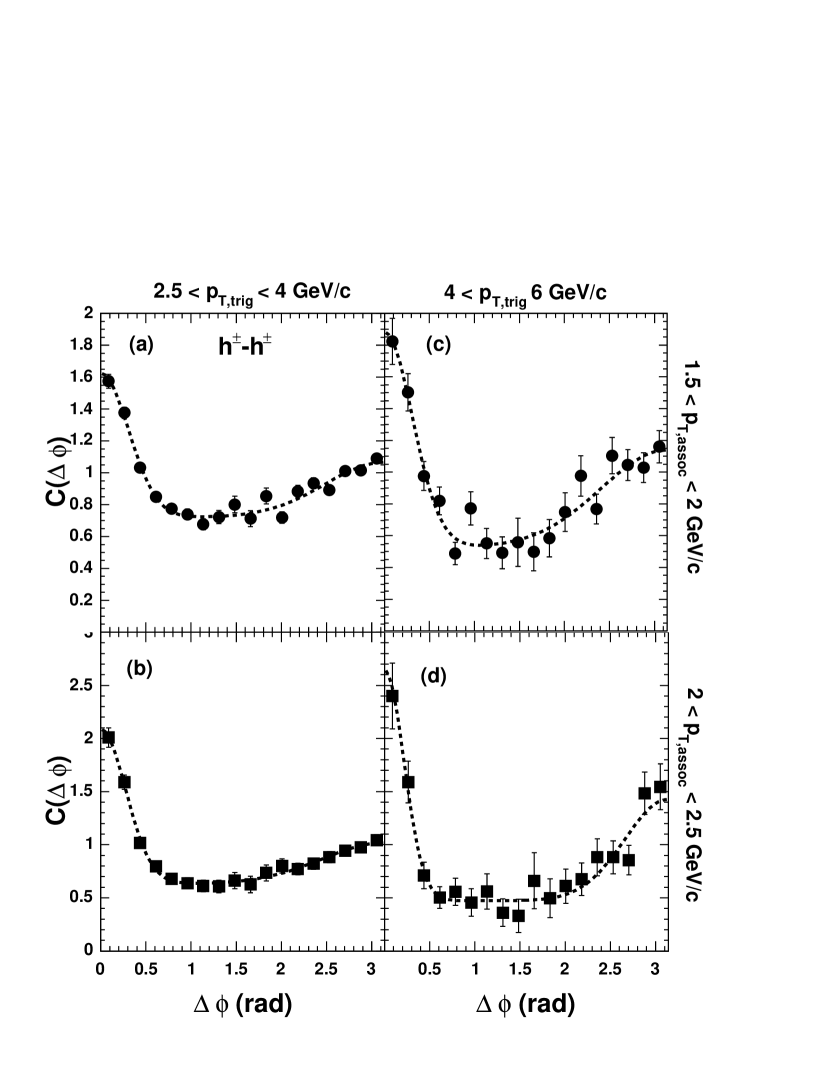
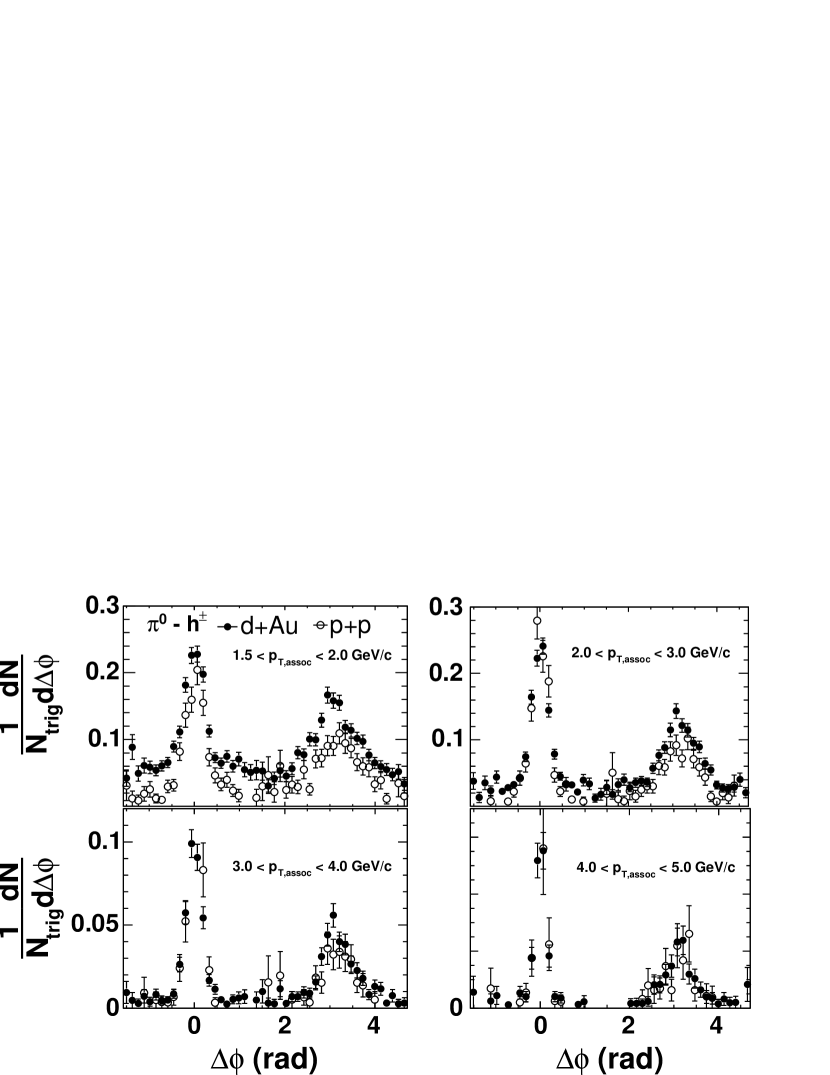
The baseline data from which jet structures are extracted are the correlation functions and conditional pair distributions that were defined in Section II. Figure 12 shows representative correlation functions between two charged hadrons, while Figs. 13 and 14 show representative conditional yield distributions triggered on neutral pions () and charged pions respectively. All three correlation sets (Fig. 12 to 14) show relatively narrow peaks centered at and radians. The widths of these structures decrease with larger , which is consistent with narrowing of the jet cone for increasing . The fractional area under the jet peak relative to the flat underlying background also increases significantly as function of associated particle , indicating increasing (di)jet contributions to the correlation function. In particular, Fig. 13 shows that for events where there is a high trigger, a large fraction of the low (as low as GeV/) particles are coming from the dijet fragmentation, and the jet contribution dominates at GeV/. Events tagged with a high jet are much harder than a typical minimum bias event.
We characterize the jet correlations shown in Figs. 12 to 14 by assuming that there are only two contributions to the correlation function – (di)jet correlations and an isotropic underlying event. This scenario can then be expressed as:
| (36) |
where denotes the isotropic background and is the jet-function. Approximating the jet-function as the sum of two Gaussians, we fit the correlations with;
| (37) |
Here, are the normalized Gaussian areas and are the Gaussian widths for the near and far-side jets respectively. For the pair distribution functions we fit with the same shaped function, but with a different normalization (Eq. 26) as outlined in section III.2.
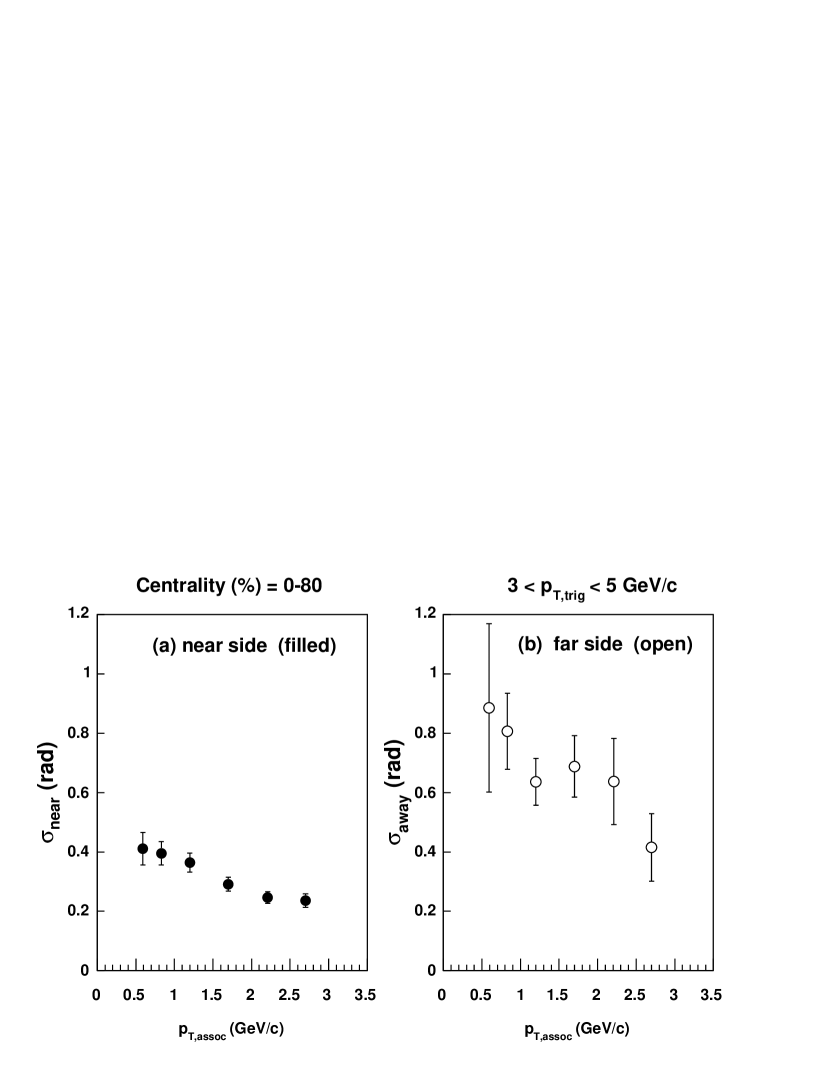
Figure 15 shows the associated- dependence of the extracted widths for both the near- and far-side peaks 222The results here are not sensitive to the slightly different range in centrality used. from the charged-hadron correlation functions with the trigger range for the charged hadron being GeV/. The data are tabulated in Table 8.
| (GeV/) | (rad) | (rad) |
|---|---|---|
| 0.59 | ||
| 0.83 | ||
| 1.2 | ||
| 1.7 | ||
| 2.2 | ||
| 2.7 |
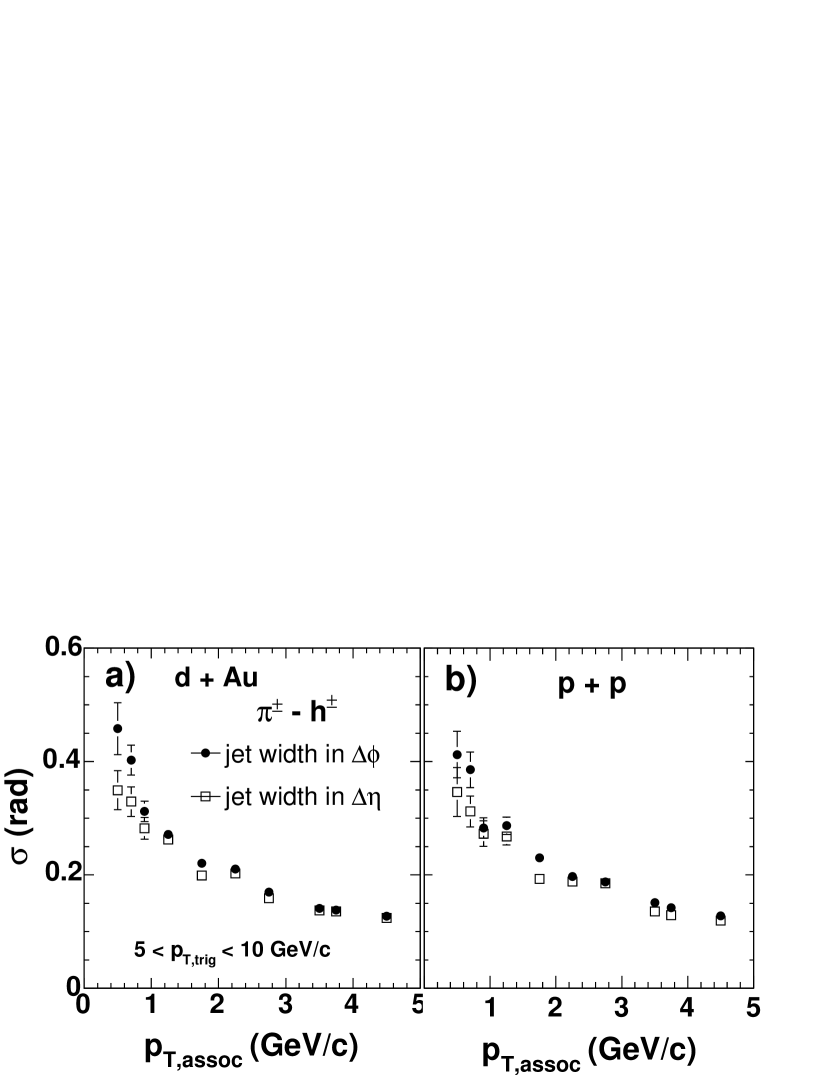
In Fig. 16 we present the same quantities from the high- identified pion correlations, where there is excellent agreement between the and charged-pion data sets. For both types of identified pions the trigger range is GeV/ and these data are tabulated in Tables 9 and 10.
| (GeV/) | (rad) | (rad) |
|---|---|---|
| 0.50 | ||
| 0.70 | ||
| 0.90 | ||
| 1.23 | ||
| 1.75 | ||
| 2.24 | ||
| 2.73 | ||
| 3.44 | ||
| 4.42 |
| (GeV/) | (rad) | (rad) |
|---|---|---|
| 1.21 | ||
| 1.71 | ||
| 2.37 | ||
| 3.39 | ||
| 4.41 |
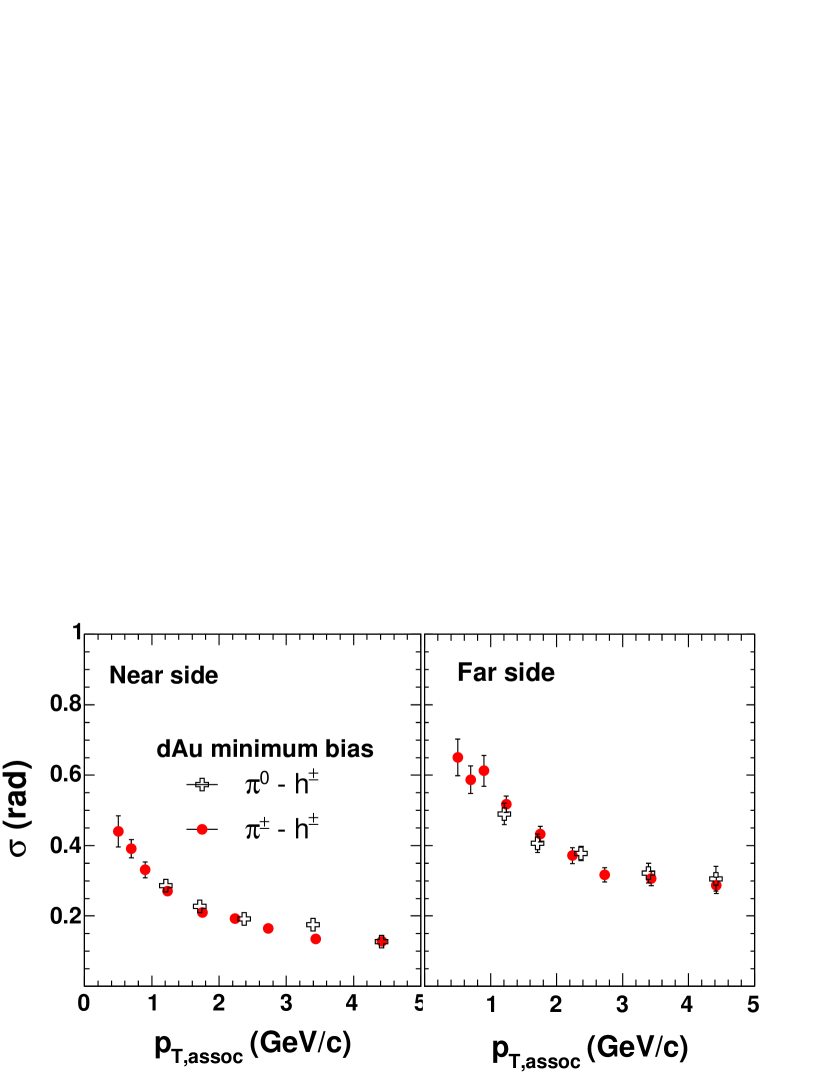
The far-side widths shown in Figs. 15 and 16 are larger than the near-side widths, as expected, since the far-side structure is a convolution of two jet fragmentations as well as any of the scattered partons. The widths of the correlation functions also steadily decrease as a function of as expected from (di)jet fragmentation. For completeness we also tabulate the near- and far-side widths extracted as a function of for identified pions. These data are tabulated in Tables 11 and 12.
| (GeV/) | (rad) | (rad) |
|---|---|---|
| 5.44 | ||
| 6.31 | ||
| 7.27 | ||
| 8.60 | ||
| 10.6 | ||
| 13.2 |
| (GeV/) | (rad) | (rad) |
|---|---|---|
| 5.39 | ||
| 6.40 | ||
| 7.66 |
Although PHENIX single particle acceptance is limited to , it can sample jet pairs in twice as large of a window in () with varying pair efficiency. Similar to azimuthal correlation, the pair efficiency in can be estimated via mixed-events and can subsequently be divided out (Eq. 21). Assuming that the underlying event is flat333 dependence of the single particle yield is very weak in Adams et al. (2004). Thus the underlying pair distribution in is almost flat. in , we fix the background level to be equal to that in azimuthal correlation function Eq. 36 and subsequently extract the jet distribution as a function of . In Fig. 17a, we compare the near-side jet shape in and in the angular range of for the correlation with GeV/. There is no significant difference in jet shape between and and the widths are consistent in both directions. Figure 17b shows the far-side jet shape in , the associated pair distribution is flat within .
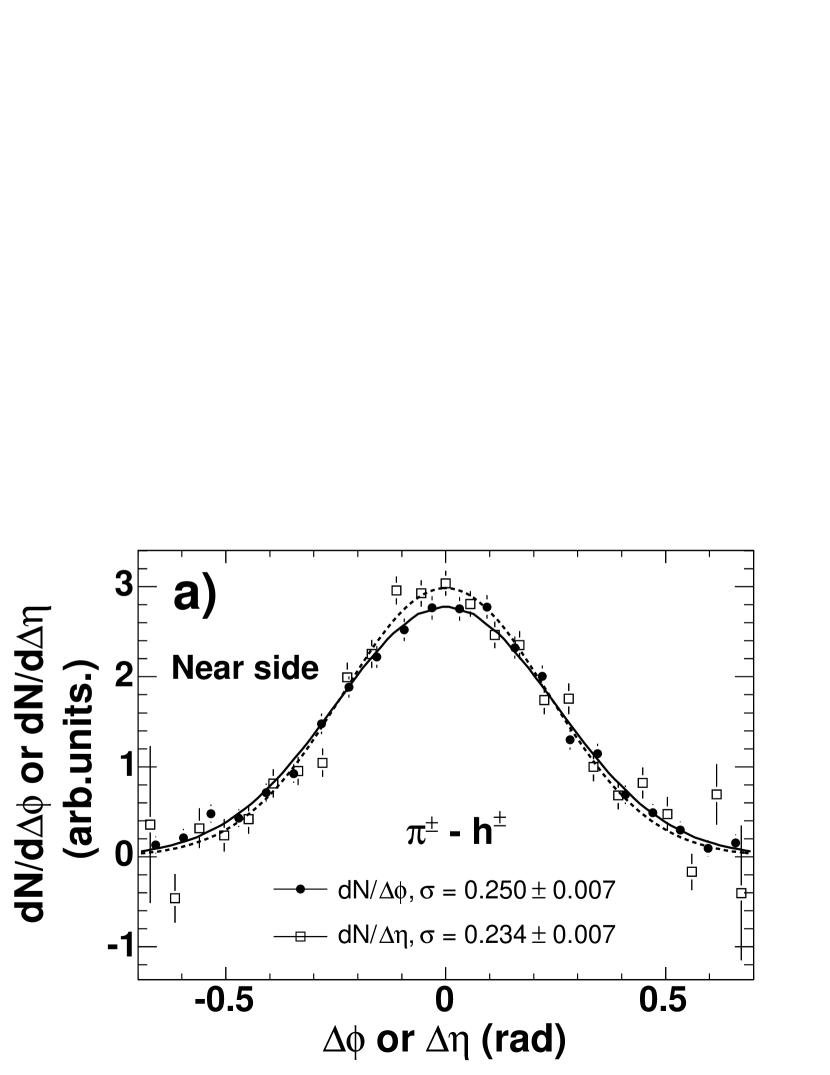
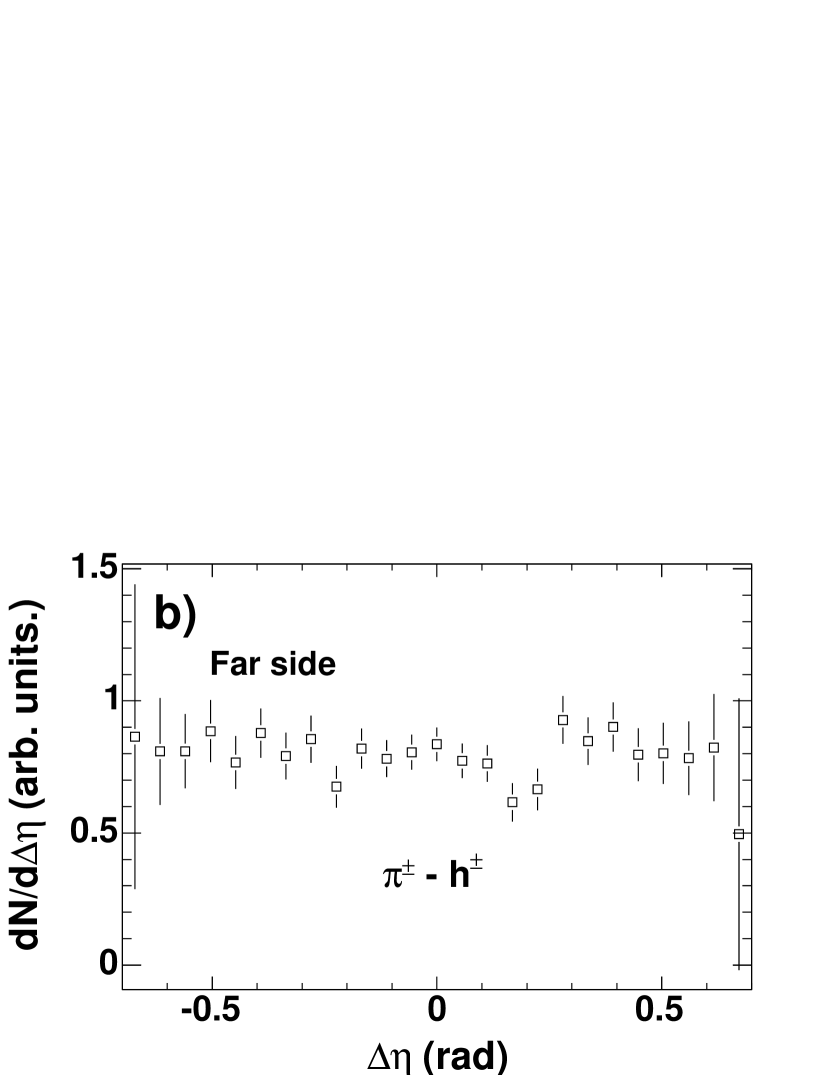
Figure 18a shows the comparison of the near-side jet width in and from + Au. There is overall very good agreement between the two data sets. However, the width in is systematically lower than that in at small . This is due to the fact that the the underlying background is not completely flat in , but varies by up to 10% in . Thus the procedure of dividing by the mixed-event distribution (Eq. 21) introduces some distortion of the jet shape at large , and consequently leads to a slightly different value for the jet width. In fact for collisions, Figure 18b indicates a similar discrepancy between and at small for collisions. Thus this deviation is not likely due to the cold medium effect in + Au.
We extract not only the widths of the jet-structures but also the conditional yields of how many hadrons are in the near-side and far-side structures for each high- trigger. The conditional yield defined in Eq. 14 can be obtained from either a correlation function or conditional pair distribution, both of which produce identical results. For the conditional pair distributions the conditional yield is directly extracted from the fit parameters (Eq. 26), while for correlation functions several normalization factors need to be applied to obtain the per trigger yield Stankus (2005); Ajitanand et al. (2005), as described below.
For correlation functions, it is convenient to define the fraction of jet-correlated particle pairs per event, . Following the basic ansatz outlined in Eq. 36, the fraction of jet-correlated particle pairs is obtained by summing the jet function over all bins in and dividing by the total sum of the correlation function
| (38) |
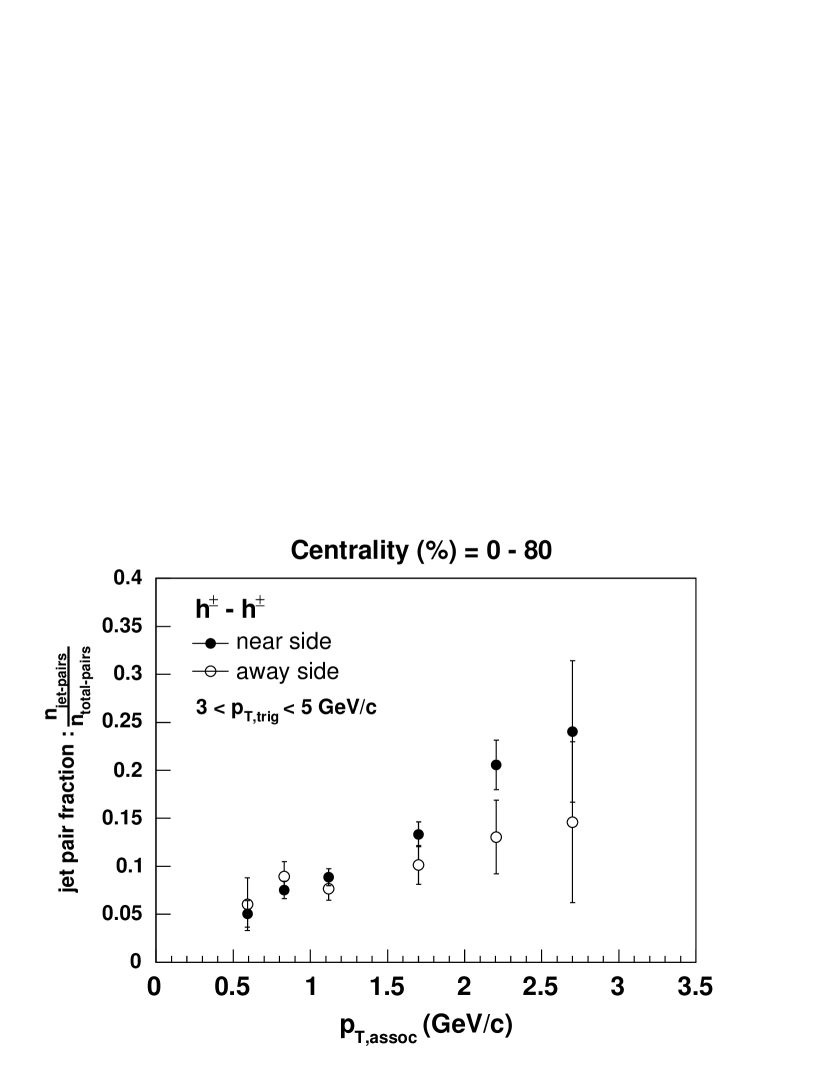
Such pair fractions are shown as a function of for a trigger hadron of GeV/ and a centrality selection of % in Fig. 19. The results, shown for both the near and far-side jets, indicate an increase in the average fraction of jet-correlated particle pairs with as might be expected if jet fragmentation becomes the dominant particle production mechanism as is increased.
The pair-fraction is multiplied by the ratio
| (39) |
where denotes the average number of detected particle pairs per event and , and are the detected single particle yields per event for trigger and associated particles respectively. This gives the average number of jet-correlated pairs per event over the combinatoric background . The conditional per-trigger yield, , is obtained via multiplication by the efficiency corrected single particle yield () for the selected associated bin of interest;
| (40) |
The per trigger yields for hadron triggers (found using Eq. 40) are corrected for the azimuthal acceptance and tracking efficiency but are reported within the PHENIX acceptance for the central arms, i.e. no corretions is applied to the hadron-triggered conditional yields.
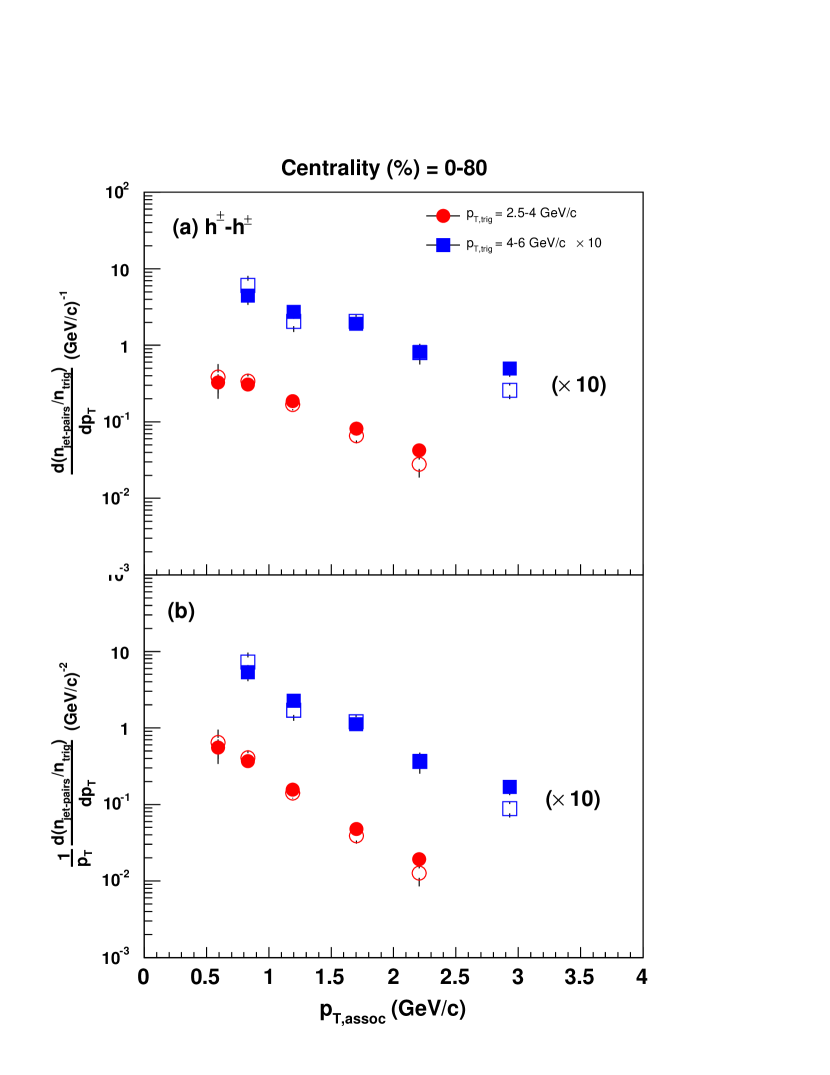
Figure 20 plots the near- and far-side invariant conditional yields extracted via Eq. 40 for different trigger selections as indicated. An approximate exponential decrease with is observed, i.e. there are more low- particles associated with each high- trigger hadron. The data are tabulated in Tables 13 and 14.
| (GeV/) | ||
|---|---|---|
| 0.592 | ||
| 0.831 | ||
| 1.190 | ||
| 1.702 | ||
| 2.205 |
| (GeV/) | ||
|---|---|---|
| 0.831 | ||
| 1.200 | ||
| 1.700 | ||
| 2.210 | ||
| 2.931 |
In Fig. 21 the conditional yields for identified pion triggers are plotted as function of for both near-side correlation and far-side correlation. For this high- data, the conditional yields are extracted from the fits to the data in Figs. 13 and 14 using Eq. 26, then corrected for pair efficiency in using Eq. 24 and Eq. 25. The conditional yields are tabulated in Tables 15 and 16.
| (GeV/) | ||
|---|---|---|
| 0.5 | ||
| 0.7 | ||
| 0.9 | ||
| 1.1 | ||
| 1.3 | ||
| 1.5 | ||
| 1.7 | ||
| 1.9 | ||
| 2.1 | ||
| 2.3 | ||
| 2.5 | ||
| 2.7 | ||
| 2.9 | ||
| 3.1 | ||
| 3.3 | ||
| 3.5 | ||
| 3.7 | ||
| 3.9 | ||
| 4.1 | ||
| 4.3 | ||
| 4.5 | ||
| 4.7 | ||
| 4.9 |
| (GeV/) | ||
|---|---|---|
| 1.21 | ||
| 1.71 | ||
| 2.21 | ||
| 2.72 | ||
| 3.22 | ||
| 3.73 | ||
| 4.23 | ||
| 4.72 |
The agreement between the two pion-triggered data sets is good, which indicates that the jet fragmentation function is independent of whether a neutral pion or a charged pion trigger is used. The difference in the magnitudes of far-side and near-side yield reflect the fact that the far-side correlations measures a hadron triggered effective fragmentation while the near-side correlation measures dihadron fragmentation.
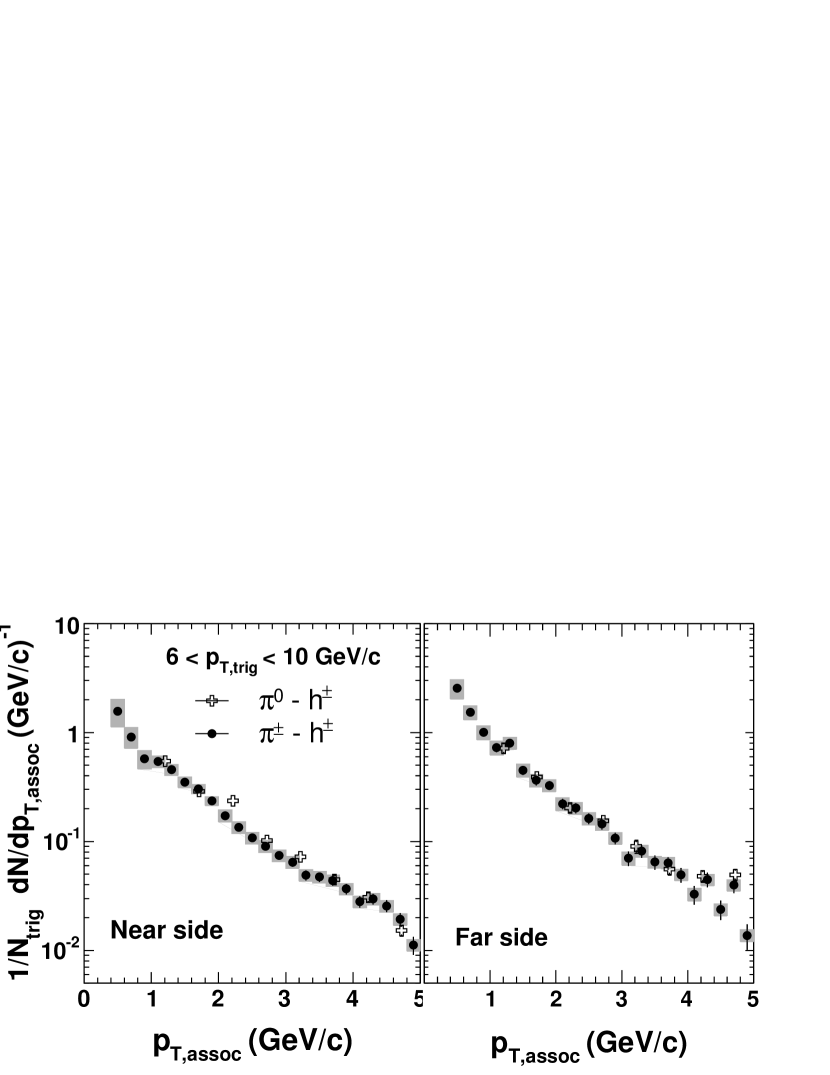
The conditional yields presented in FigOAs. 20 and 21 can be considered as the basic information, while the near and far distributions in Section IV.2 have a closer relationship to parton fragmentation functions as was described in Section II.
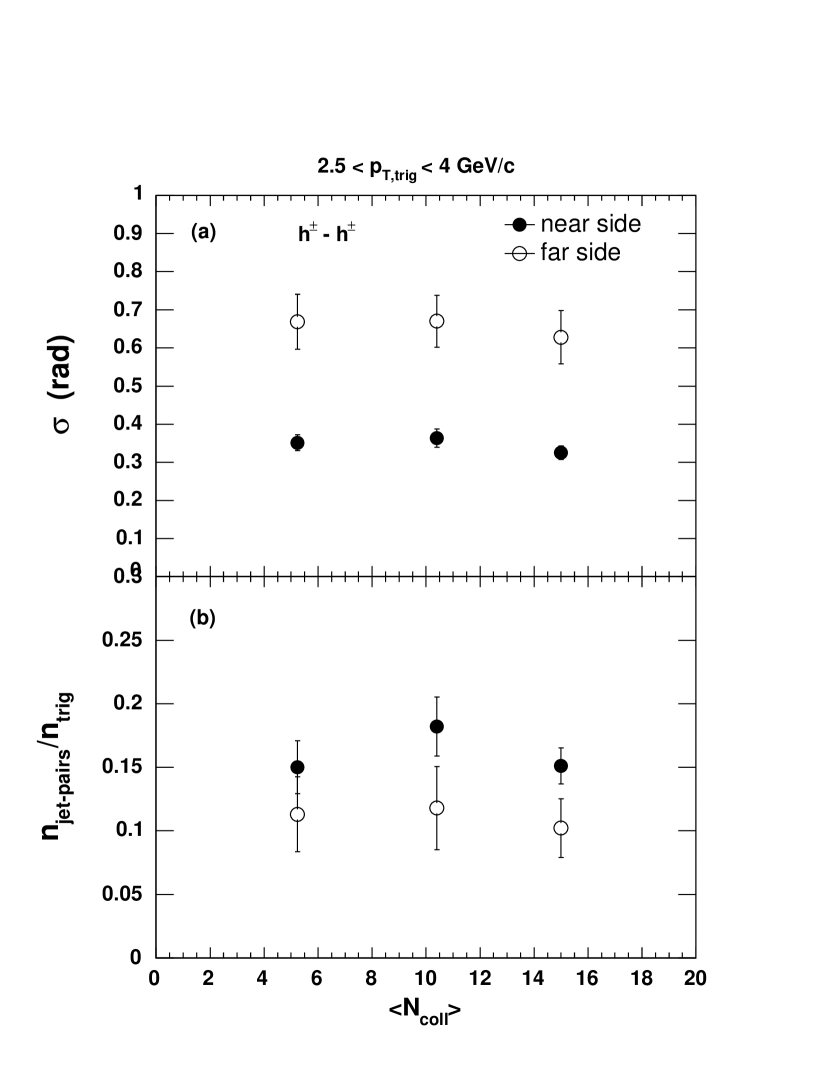
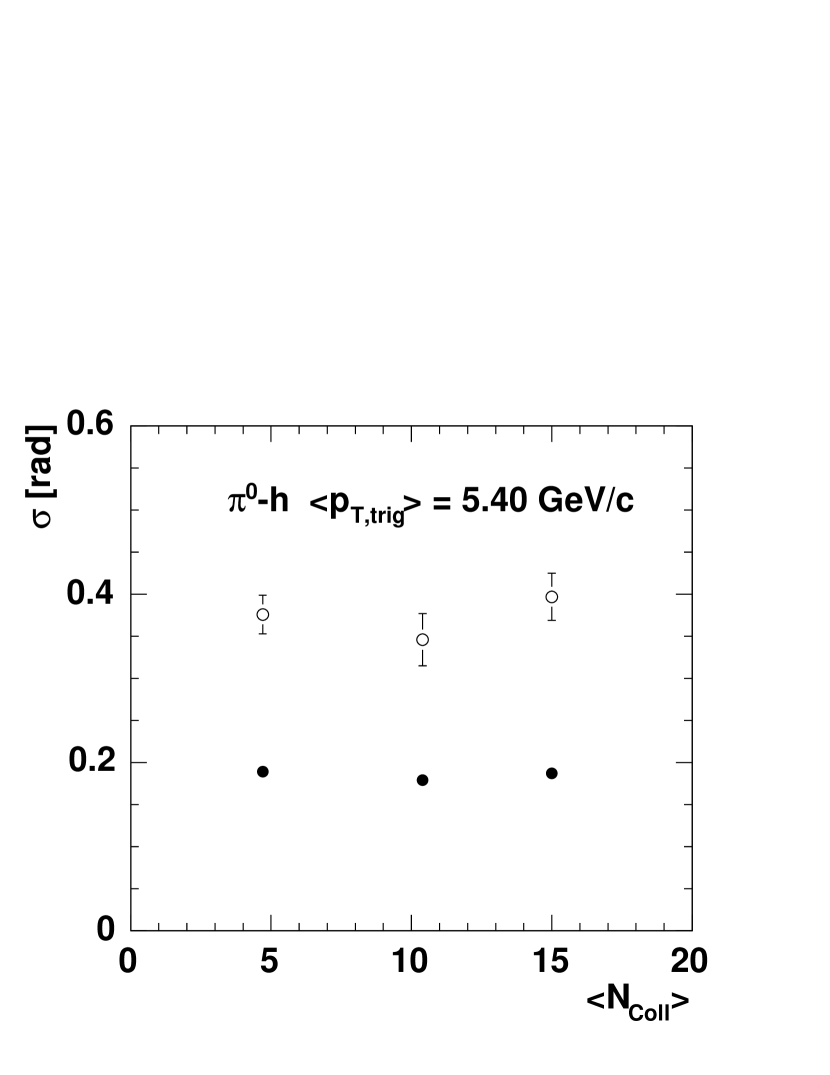
Since multiple scattering should increase with centrality, we examine whether these jet characteristics exhibit any centrality dependence. Figure 22 reports on widths and conditional yields in the PHENIX acceptance for dihadron correlations with a trigger hadron in the range GeV/. The data are tabulated in Table 17 and 18. Centrality dependent widths for the correlations are shown in Fig. 23 for a mean of approximately 5.4 GeV/. The data for the widths are tabulated in Table 19 while the yields can be found in Table 20.
| Centrality | ||
|---|---|---|
| 0-20 % | ||
| 20-40 % | ||
| 40-80 % |
| Centrality | ||
|---|---|---|
| 0-20 % | ||
| 20-40 % | ||
| 40-80 % |
| Centrality | ||
|---|---|---|
| 0-20 % | ||
| 20-40 % | ||
| 40-88 % |
| Centrality | ||
|---|---|---|
| 0-20 % | ||
| 20-40 % | ||
| 40-88 % |
Neither the widths nor the per-trigger yields change significantly with centrality, indicating that the influence of multiple scattering on jet properties is small in this region. This work is extended in Section IV.4 where we present the centrality dependence of various jet-structure observables.
IV.2 Jet Properties in Minimum Bias Collisions
From the angular widths and yields in the previous section, we calculate the following quantities that characterize the jet structures: transverse momentum of hadrons with respect to the jet (), the dijet acoplanarity , and the distributions. These quantities are first presented for minimum-bias + Au collisions, which have the highest statistical precision, and are then compared with results from in Section IV.3.
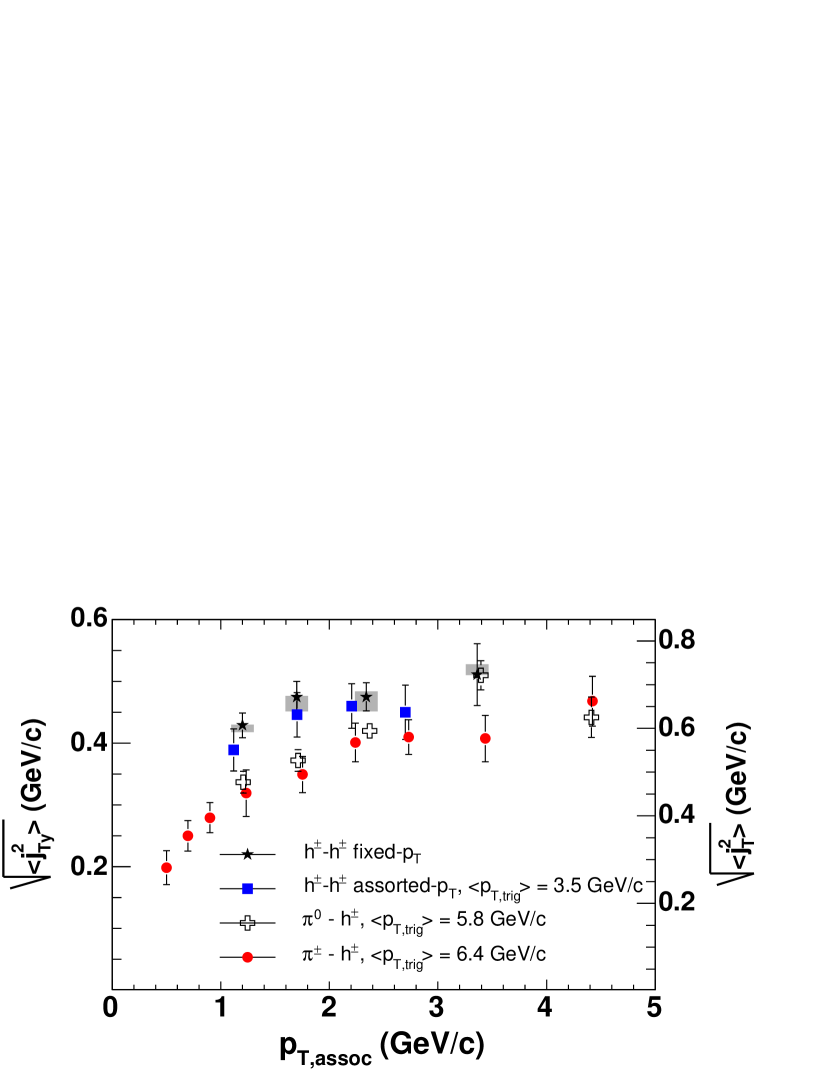
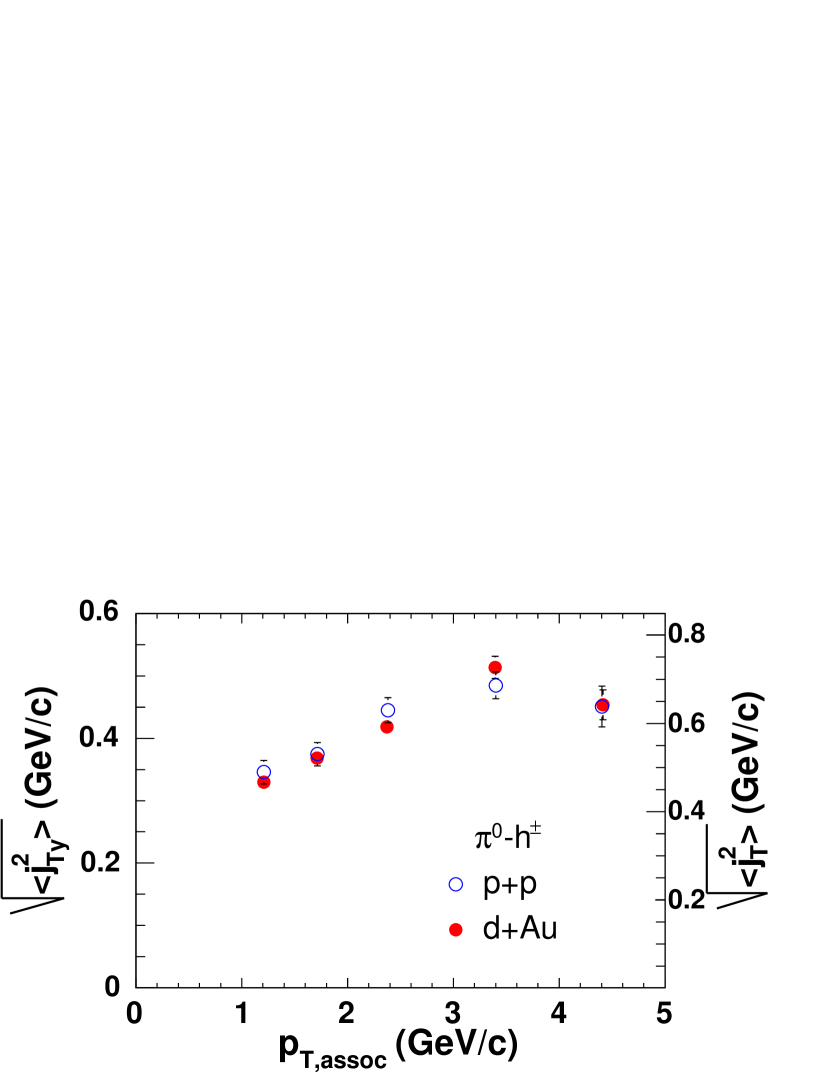
Figure 24 shows the compilation of values extracted from correlations (open crosses), correlations (filled circles), and assorted and fixed correlation results for at low shown in solid boxes and solid stars, respectively. The values were calculated using Eq. II.2. The systematic errors are mainly due to the uncertainties of Eq. II.2 and the fitting procedure, which are about 5% (independent of ) and are approximately the same for all four analysis. The values for and indicate a steady increase at below 2 GeV/ followed by a saturation around MeV/ at GeV/. The initial increase is due to the ‘seagull effect’ van Apeldoorn et al. (1975); Agababyan et al. (1994). The approximately constant behavior of above 2 GeV/ is consistent with the scaling behavior of the fragmentation functions. The results from the correlation analyses have a similar increase and saturation behavior. They seem to reach a slightly higher plateau value at a lower (around 1.5 GeV/).
A combined fit based on data points at GeV/ gives a plateau value of GeV/ for minimum bias + Au collisions.
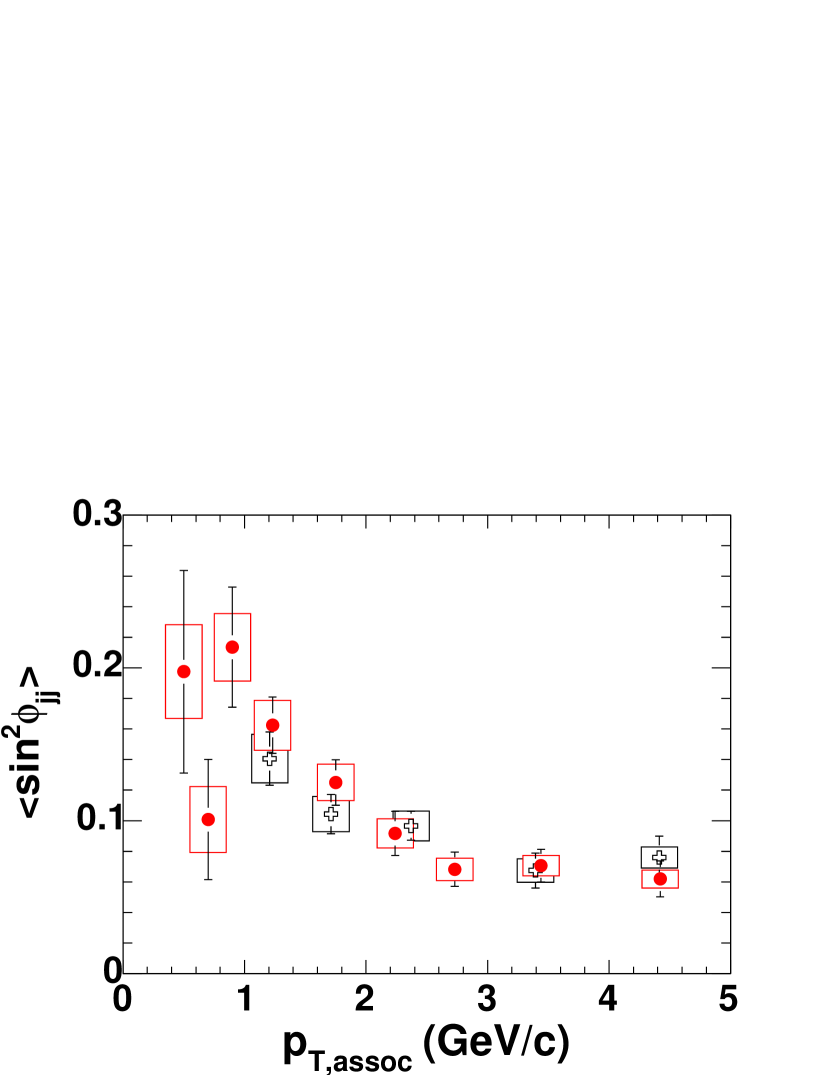
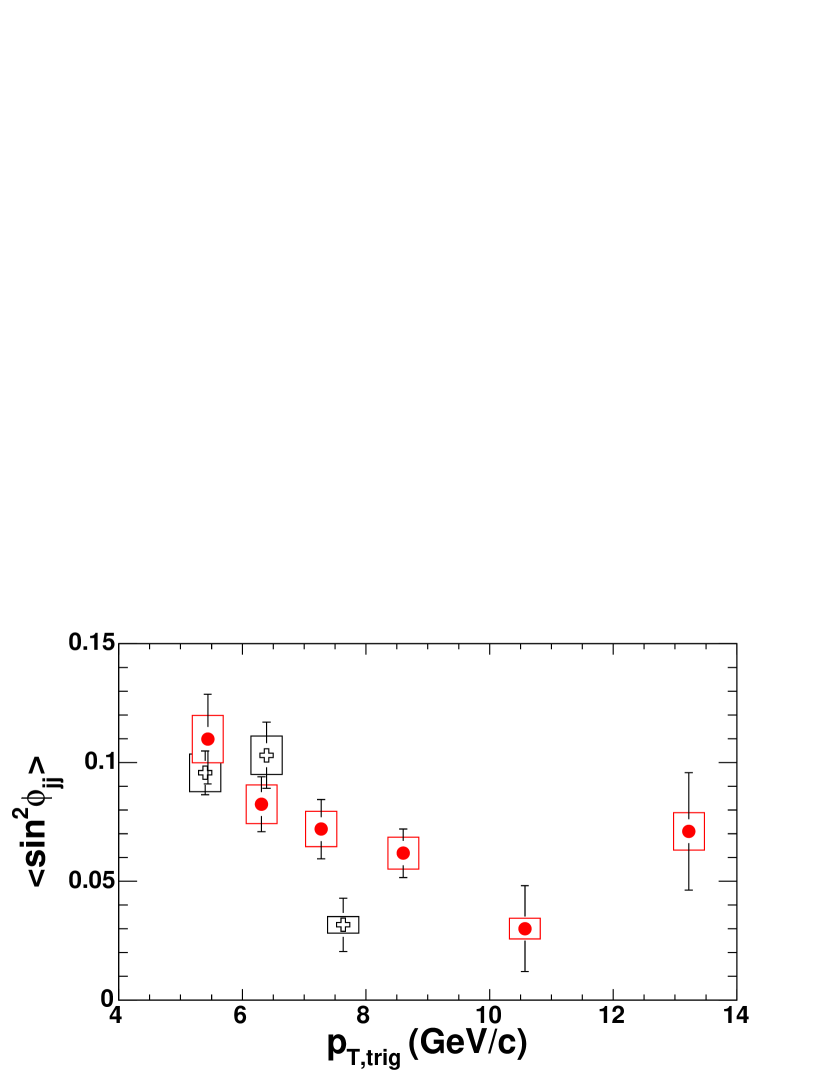
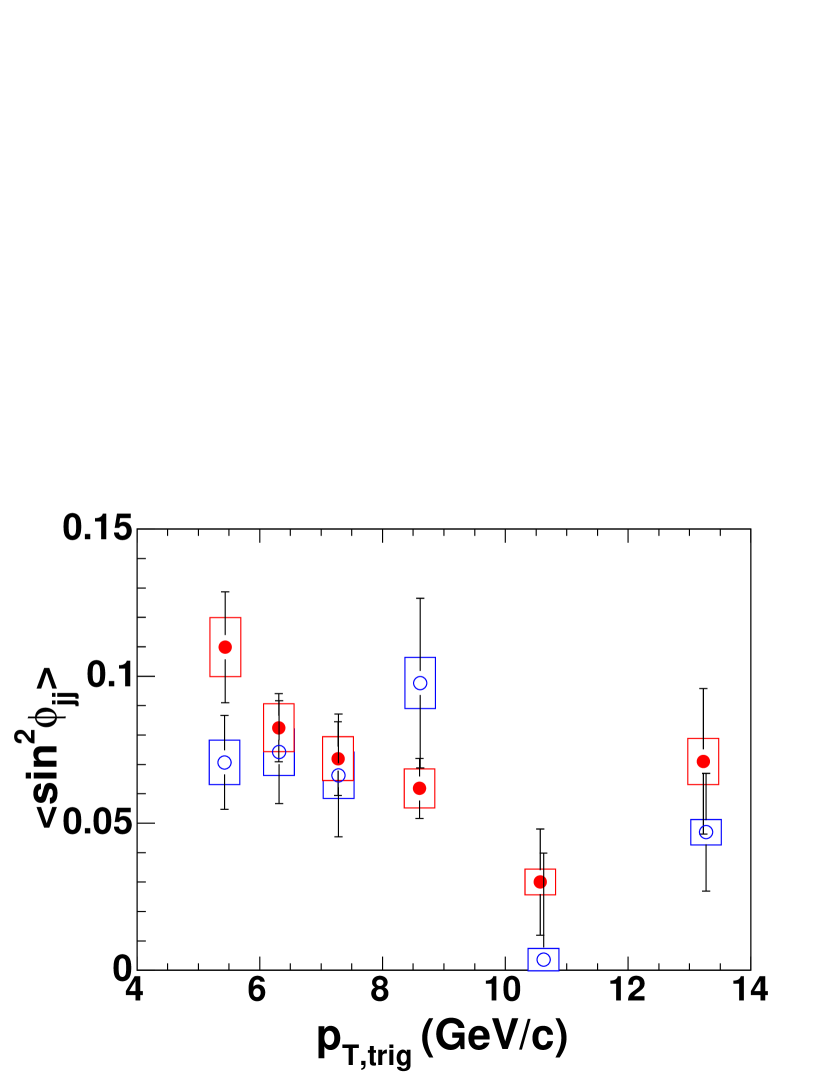
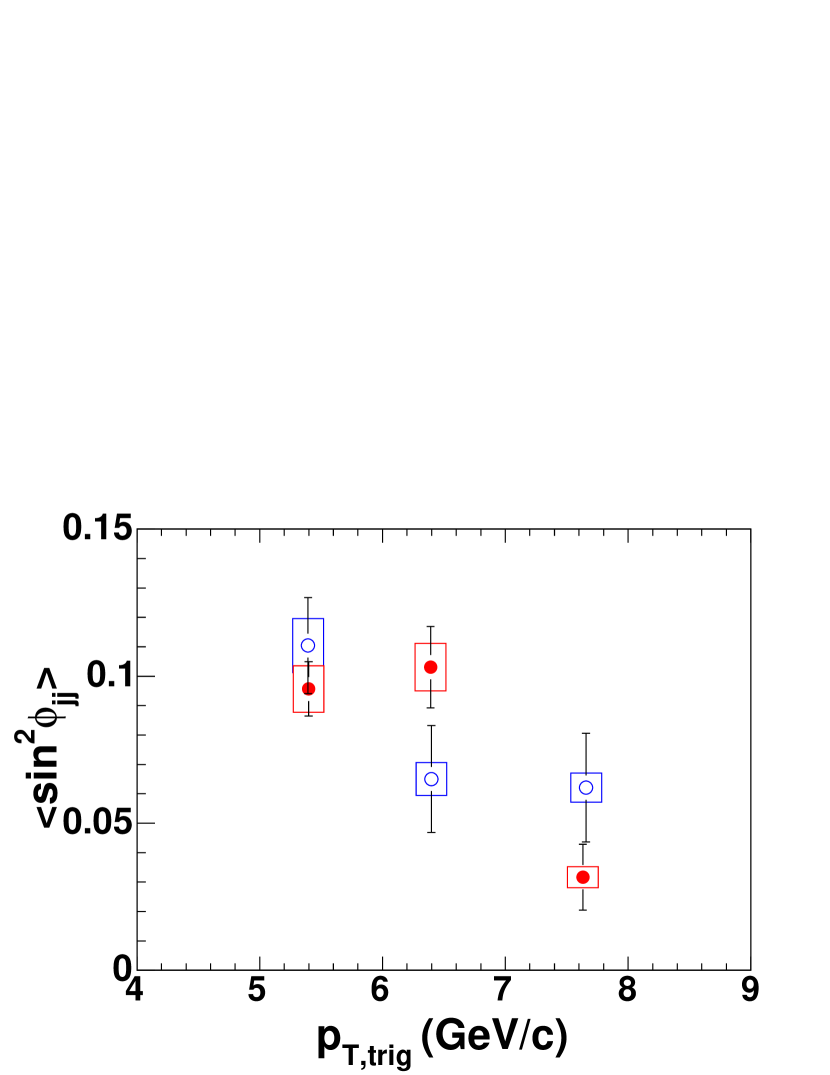
A key quantity that provides information on multiple scattering in the cold nuclear medium is , where is the azimuthal angle between the jet axes. As described in Section II, we calculate from the experimental values of the near- and far-side widths (Eq. 13). Figure 25 shows as function of for high- pion triggers. We observe that the RMS of the sine of the angle between the jet axes, , decreases as higher- associated particles are selected. There is good agreement between the two data sets. Figure 26 plots as a function of , where a similar decrease with is observed.
In the next section we will calculate the quadrature difference between +Au and collisions. and use that to quantify the affect of additional final-state scattering in +Au collisions.
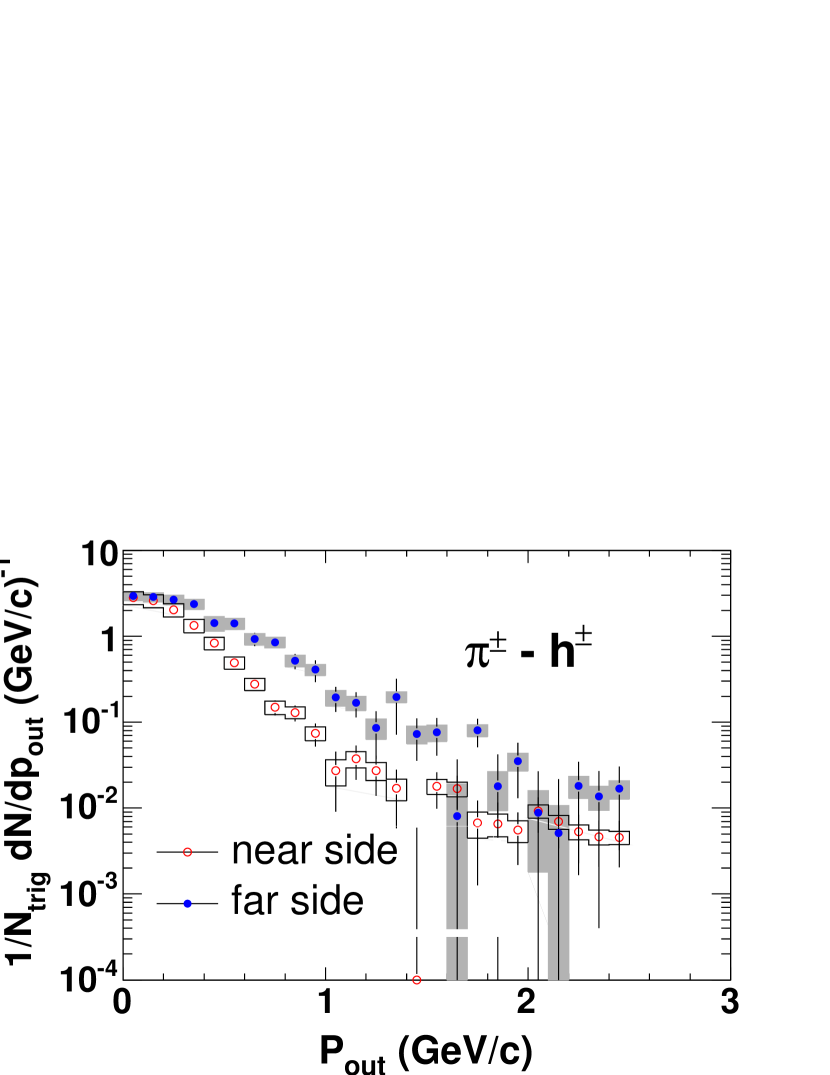
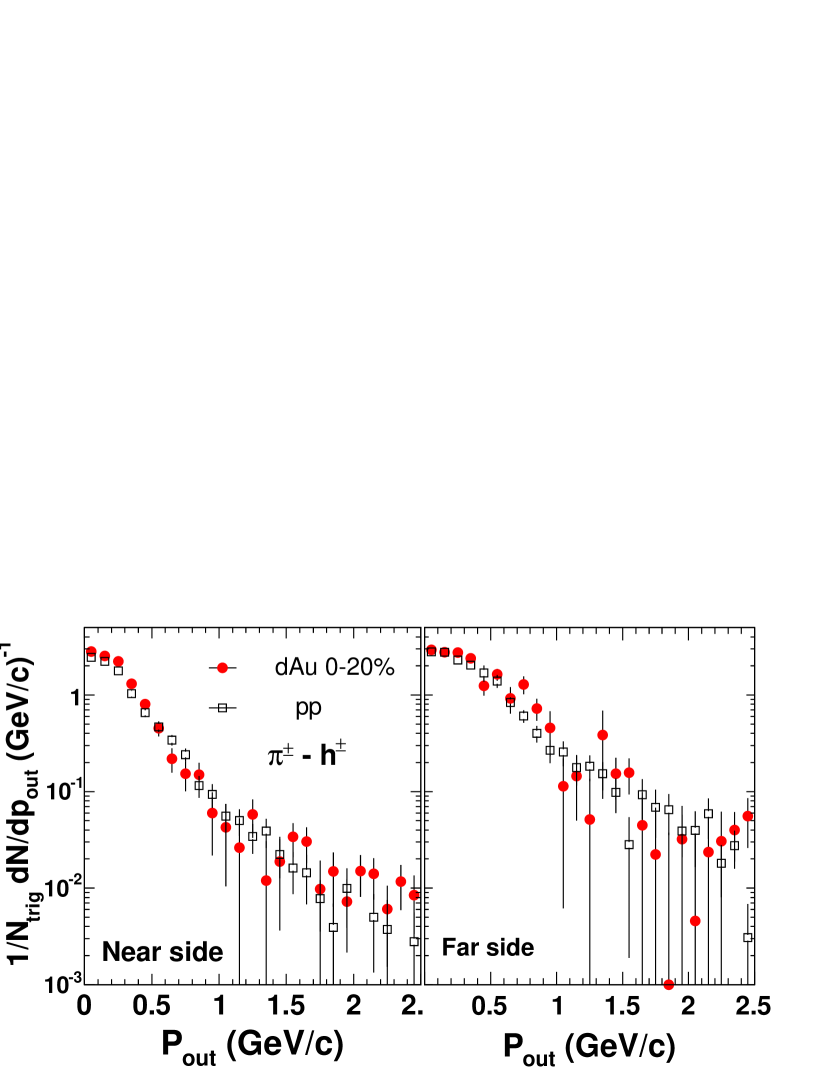
In Section II we defined the near-side and far-side . With this observable, it is possible to move beyond calculating means or RMS values and hence the distribution potentially carries more information about the dijet acoplanarity. The measured distributions for are shown in Fig. 27 for the near-side and far-side. The far-side has a broader distribution than the near-side , reflecting the fact that is larger than . The distributions have a power law tail, possibly due to strong radiative processes driving large values of .
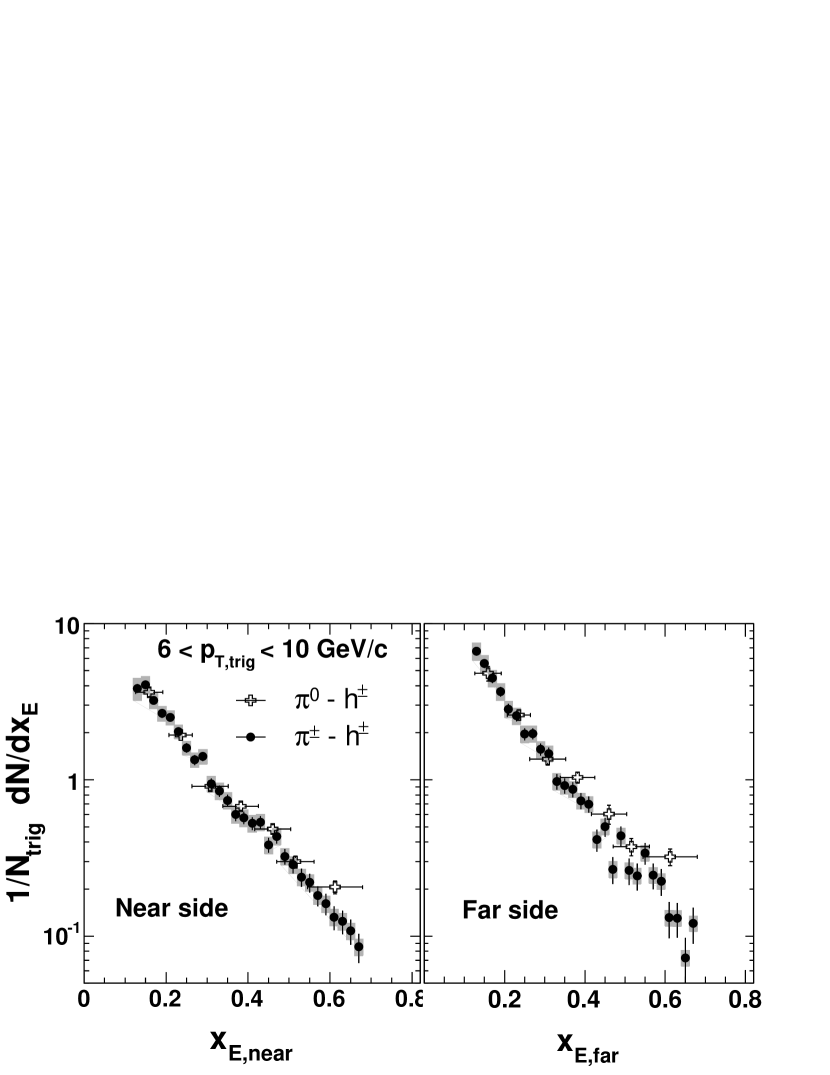
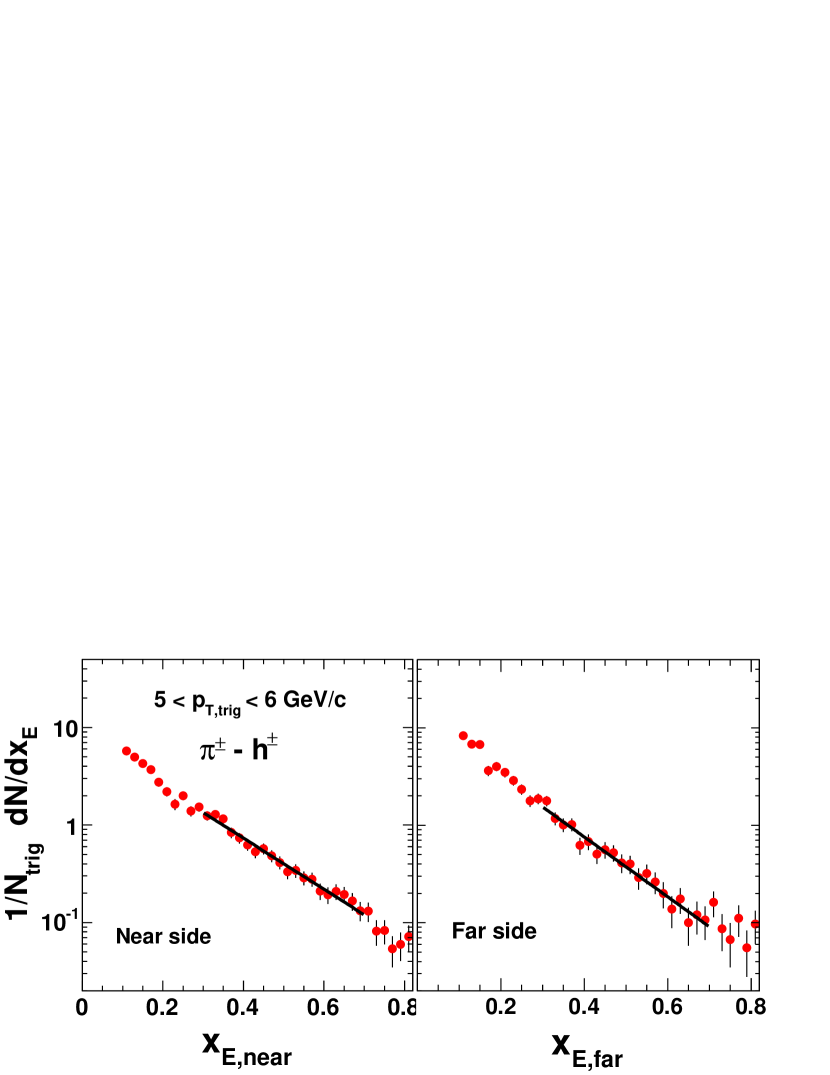
In Section IV.1 we reported the yields of associated hadrons per trigger particle, or the conditional yield. A more comprehensive way of quantifying the fragmentation function is to plot the conditional yields as a function of . This is shown in Fig. 28 for (solid circles) and (open crosses).
Previously, in ISR experiments, the slope of the distribution has been determined to be around 5.3 (GeV/)-1 Angelis et al. (1982). In Fig. 29, the conditional yields as a function of are plotted for trigger range of GeV/. In order to compare data with the previous ISR results, we have determined the exponential inverse slope and obtain the inverse slope parameter of (GeV/)-1 in the near-side and (GeV/)-1 in the far-side. The near-side inverse slope is smaller than that for the far-side, reflecting the difference between dihadron fragmentation and single hadron fragmentation. By requiring a trigger particle on the near-side, one reduces the jet energy available for fragmenting to the second hadrons and consequently a smaller inverse slope for the near-side. Note, however, that the distributions do not have pure exponential shape, and the fitted inverse slope is sensitive to the fitting ranges.
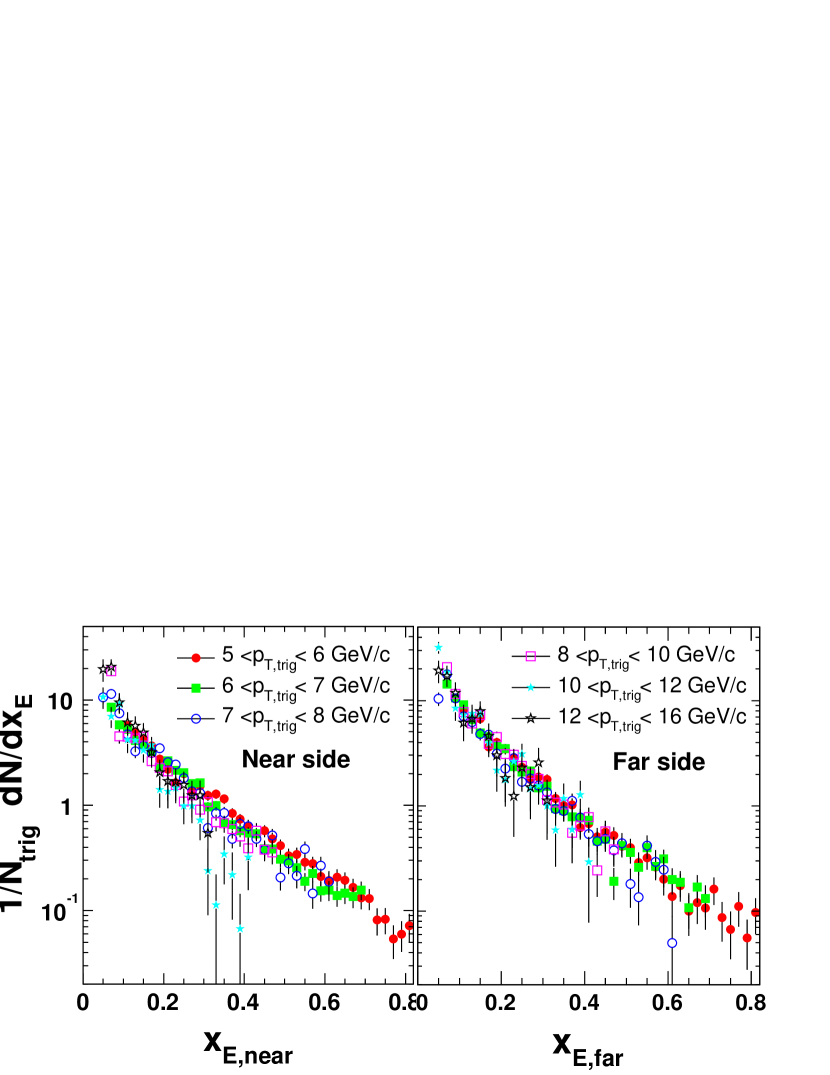
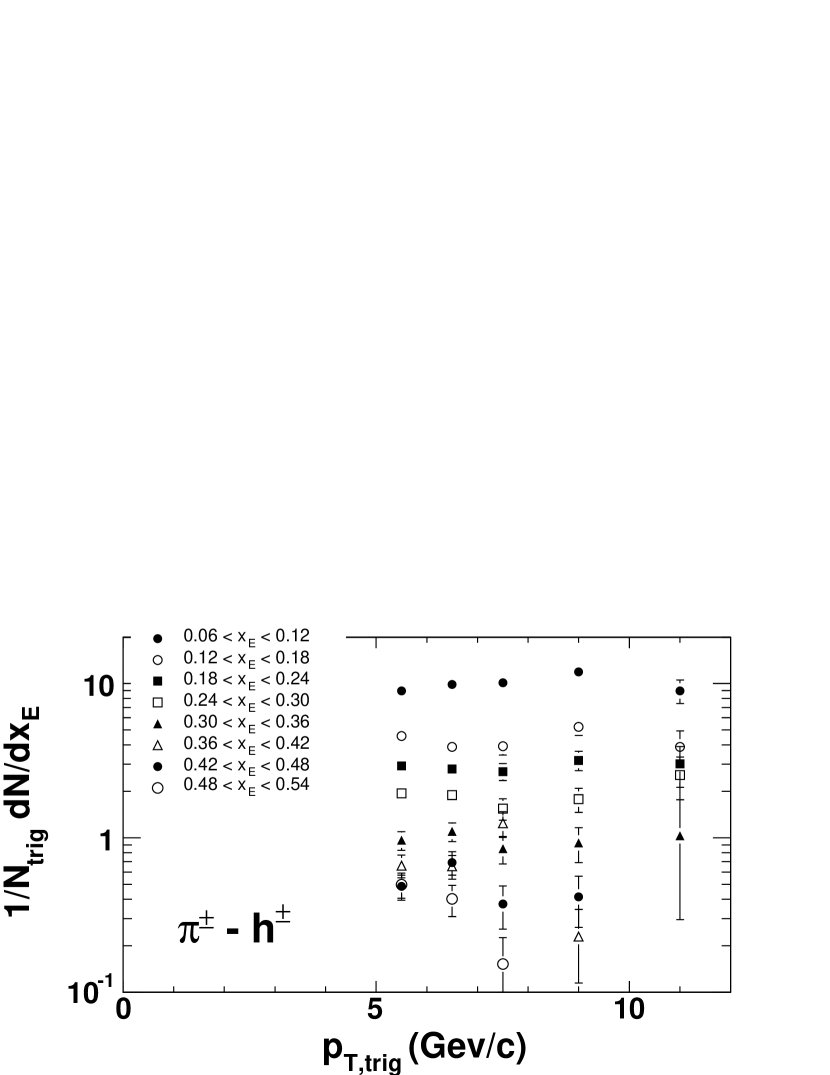
It is well known that fragmentation functions approximately scale in or collisions, i.e. are independent of jet energy. To check whether this is still true in + Au collisions, we plot in Fig. 30 the conditional yields as a function of for different ranges of trigger from correlations. All curves fall on top of each other, indicating a universal behavior of the jet fragmentation function.
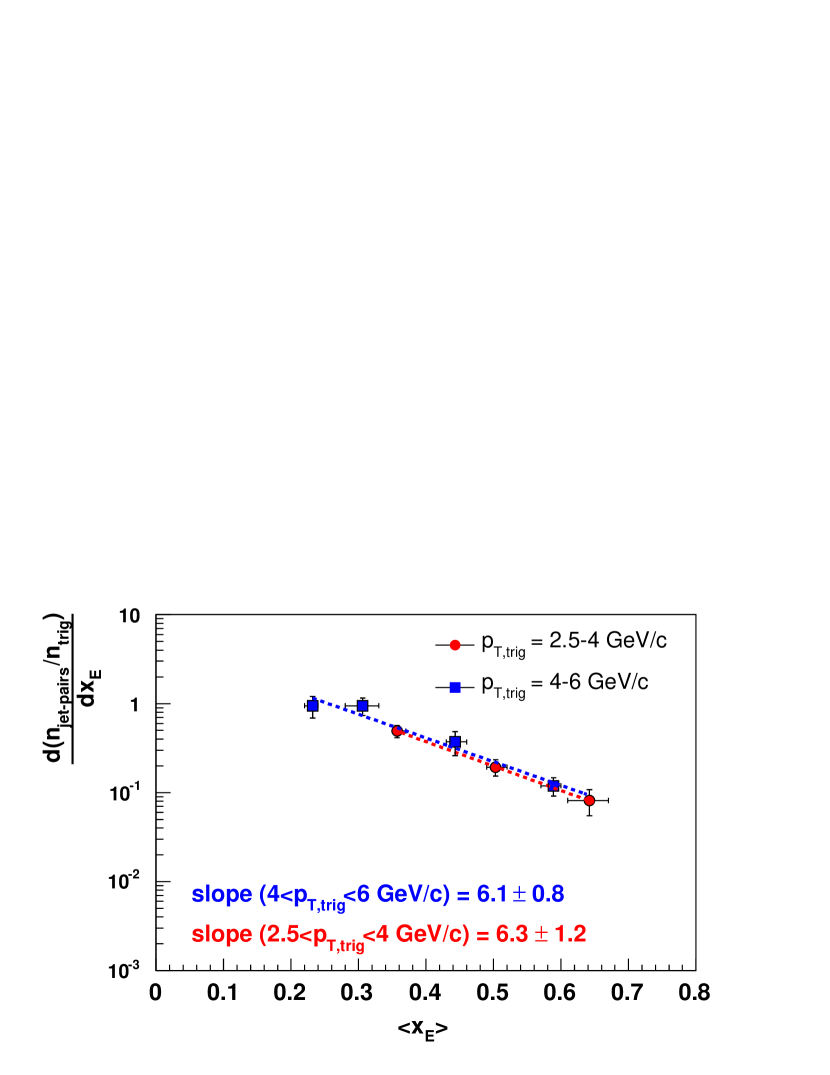
At lower we have distributions from the h-h correlations. In Fig. 31, far-side conditional yields as obtained from charged hadron correlation functions are plotted versus . Here, has been calculated from the , and extracted angular widths. Results are shown for two trigger ranges, GeV/ and GeV/, respectively. The dashed lines represent exponential fits to the data. The slopes extracted are for the lower trigger range and for the higher trigger window, respectively. Within the statistics of the charged hadron dataset we do not observe a strong sensitivity of the slope of the distributions to the trigger .
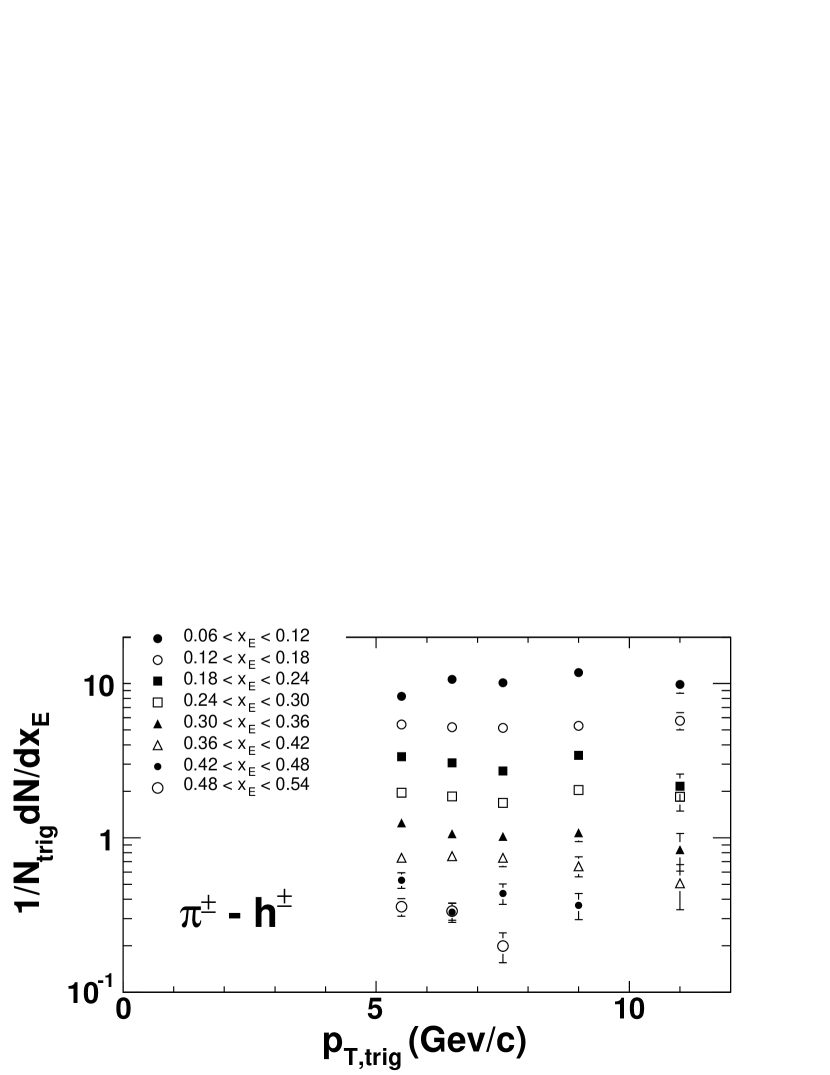
A direct way of quantifying the scale dependence of the distribution is to plot the far-side conditional yields versus for a fixed range of . This is shown in Fig. 32 where the conditional yields are found to be independent of , i.e. there is no significant deviation from scaling. We will quantify any scaling violation in this data when we compare these distributions from + Au to distributions from collisions in Section IV.3.
IV.3 Comparison between and
As discussed in Section I, multiple scattering in the cold nuclear-medium may broaden the far-side correlation and possibly modify the fragmentation properties. In the previous section we presented the measured jet structures from minimum-bias + Au collisions. In this section we compare that data to results from collisions. The goal is to establish the extent to which the nuclear-medium modifies the properties of jets.
Figure 33 shows the comparison of the extracted values as function of from + Au and collisions. The values show no change from to + Au collisions.

Similarly, the values shown in Fig. 34 for + Au are comparable to those from within errors, although the values from + Au collisions are systematically higher for . Since there is no strong difference between the +Au and results, there is little indication for increased multiple-scattering in the +Au final state.
Any additional radiation can be quantified by calculating the point-by-point quadrature difference in between + Au and collisions. This is shown in Fig. 35 and this difference is consistent with zero.
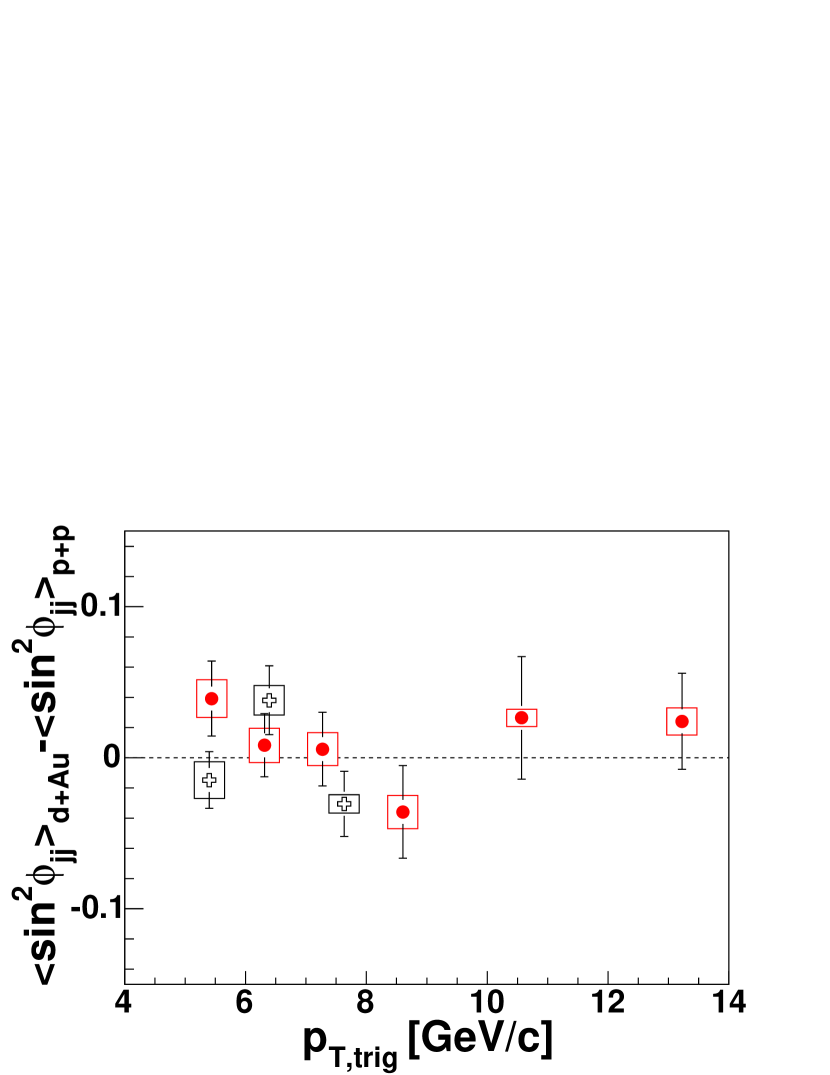
The average value for is (stat)0.003(sys); for (stat)0.010(sys). Combining the two data sets, we find (stat)0.009(sys).
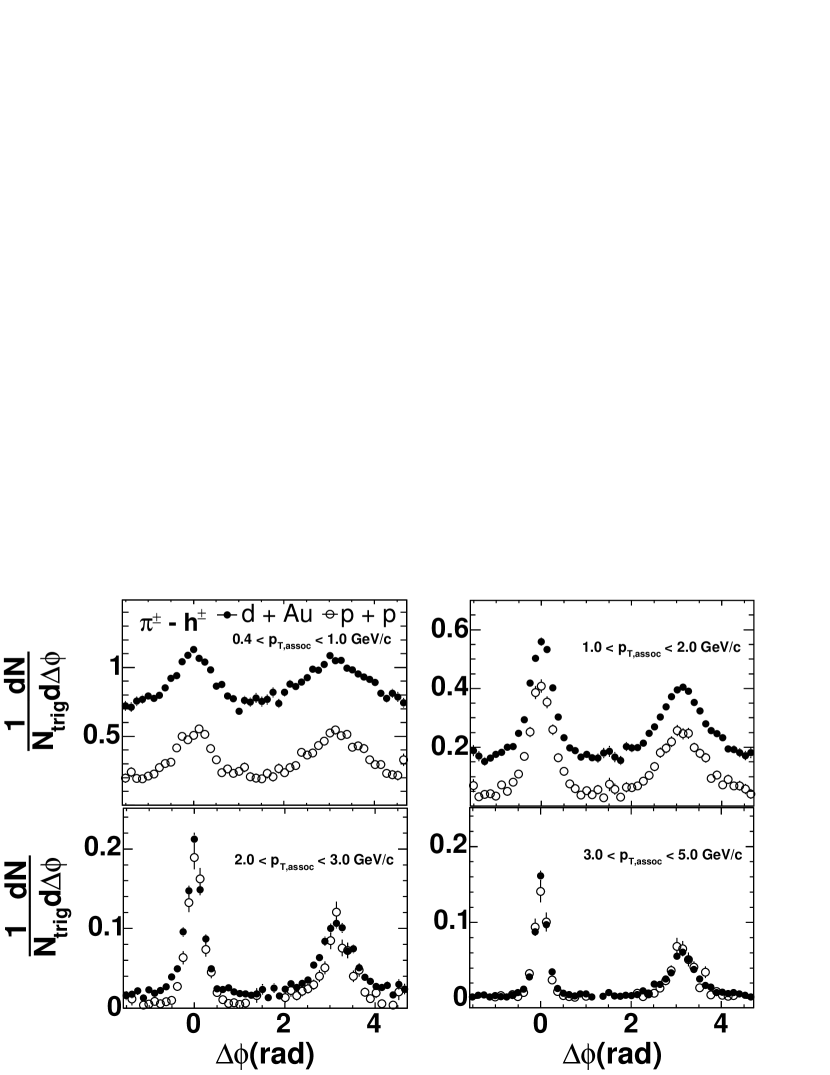
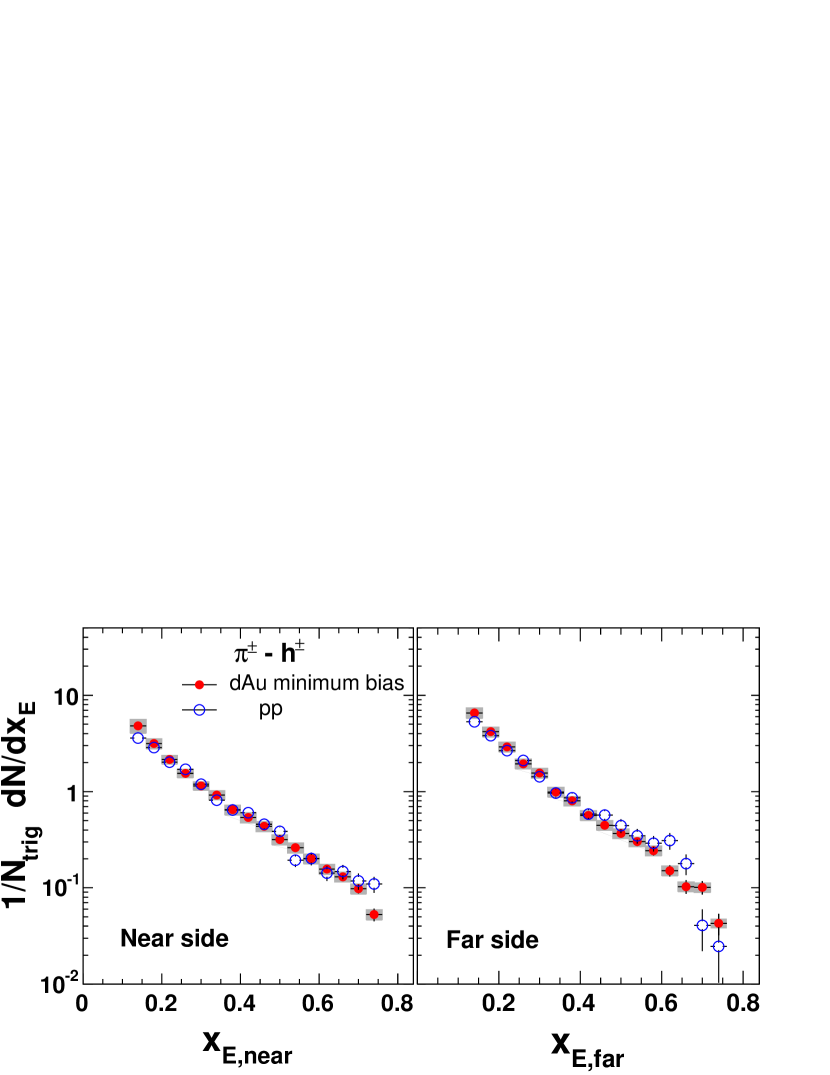
Figure 36 shows the comparison of the distribution between central + Au and from correlation, no apparent differences are observed in both the near and far-side. This is consistent with the observations that both and are similar between + Au and .
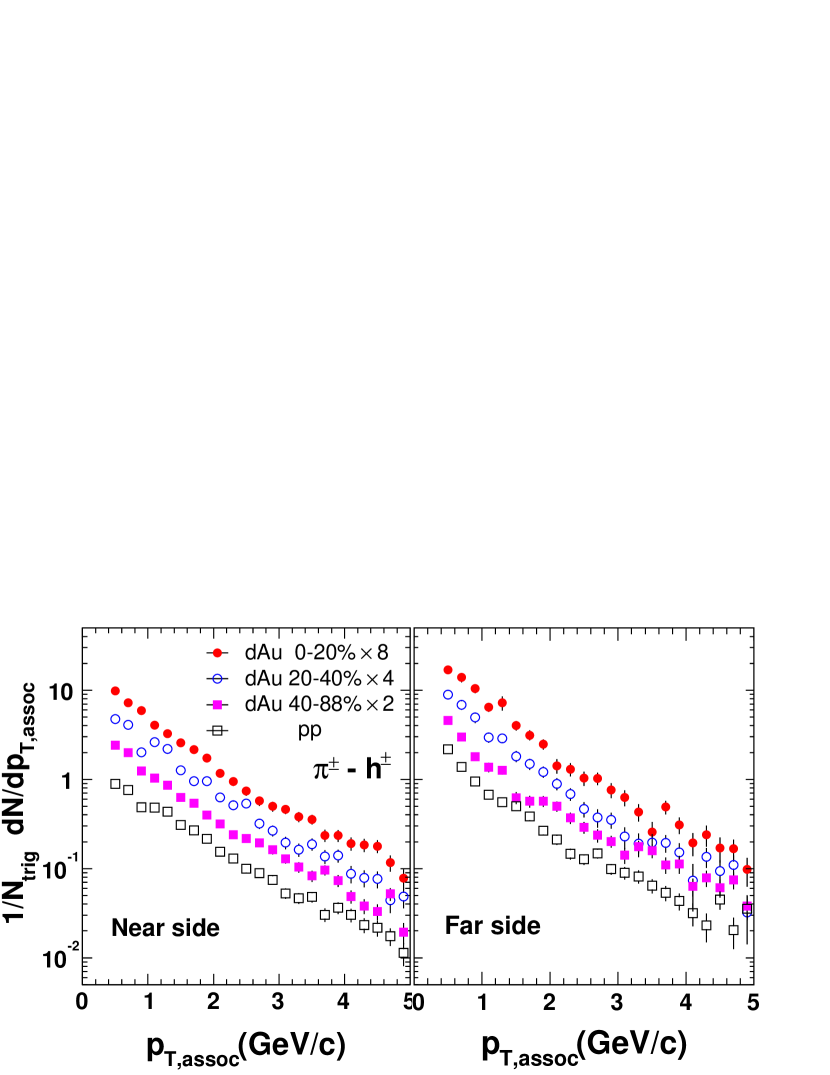
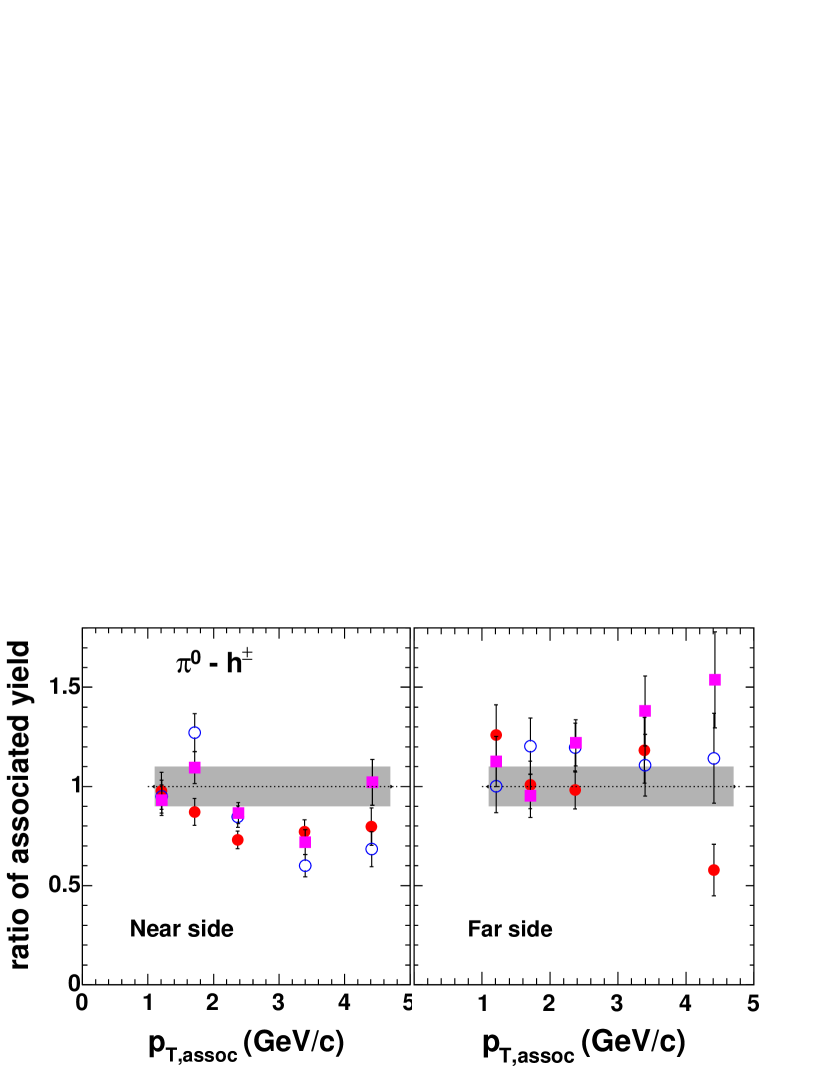
A second set of comparisons between + Au and collisions is the number of hadrons in the near- and far-angle jet structures associated with a high- trigger. Figure 37 shows the comparison of the conditional yield as function of and no apparent difference between + Au and collisions is observed for either the near- or far-side.
In the previous section we examined the level of scaling violations in the far-side distribution for + Au collisions by plotting different ranges as a function of (Fig. 32). The comparable plot for collisions is shown in Fig. 38.
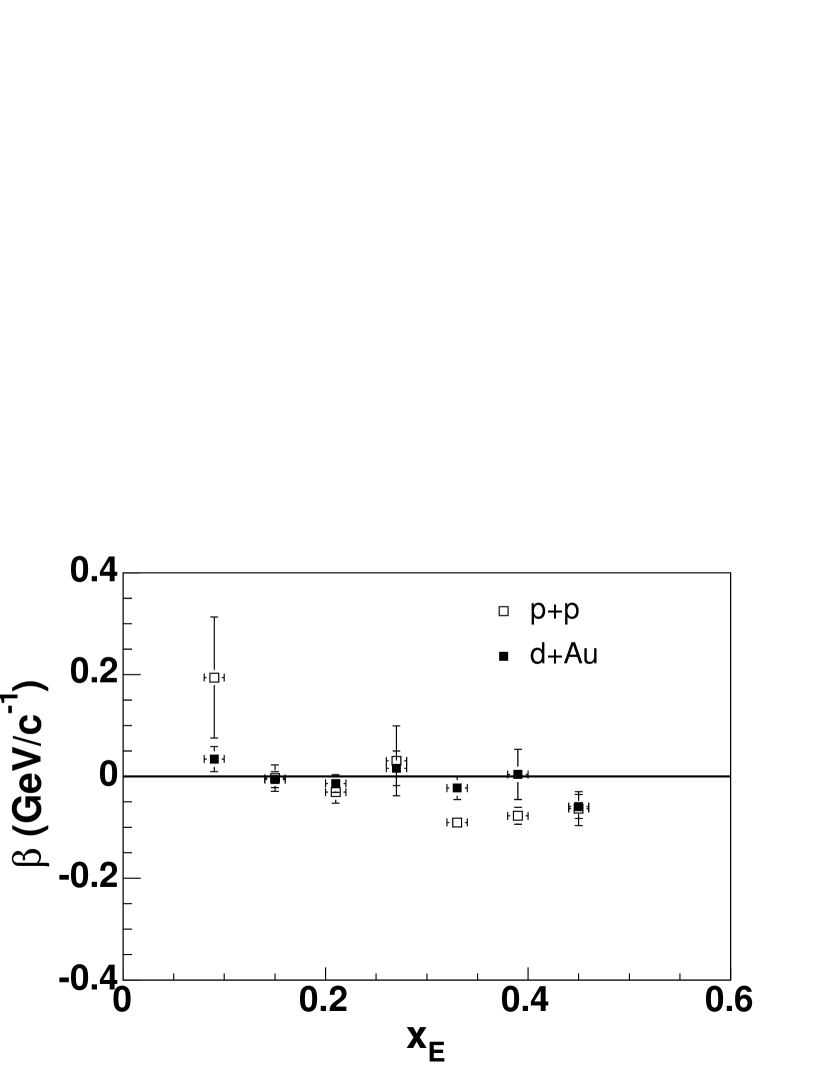
For both + Au and collisions the amount of scaling violations, i.e. the dependence of on , can be quantified by fitting the data in each range with a straight line as a function of .
| (41) |
The fitted slopes () represent the fractional change in per GeV/ and are shown in Fig. 39. For the + Au data is consistent with zero, i.e. there is no significant scaling violation across the whole range, while there may be a slight scaling violation at high for the data. On a point-by-point basis there is no systematic difference between the + Au and data.
Taken as a whole, all the results presented in this section indicate that there is no significant change in jet fragmentation between + Au and collisions due to the presence of the cold nuclear-medium. In addition there is no strong evidence for an increase in due to multiple scattering in the Au nucleus. Using the minimum-bias + Au data has the advantage of the highest statistical precision. In the next section we examine whether there is any change in jet-structures as a function of collision centrality in + Au, i.e. we split the statistics into a few centrality classes to increase the lever arm of the nuclear-thickness function.
IV.4 Centrality Dependence
As discussed in Section I, is expected to increase as + Au collisions become more central due to increased multiple scattering. Models of multiple scattering Accardi (2002) predict that the increase in is proportional to , the nuclear thickness function. We are not aware of predictions of how will change with centrality, but note that any increase in will also increase .
To probe this physics, we have measured angular correlations in three centrality bins for + Au collisions (0-20%, 20-40%, and 40-88%) to extract angular-widths of the jet-structures and hence and . Figure 40 shows the independent data sets of including results from collisions as well as the three centrality classes from + Au collisions.
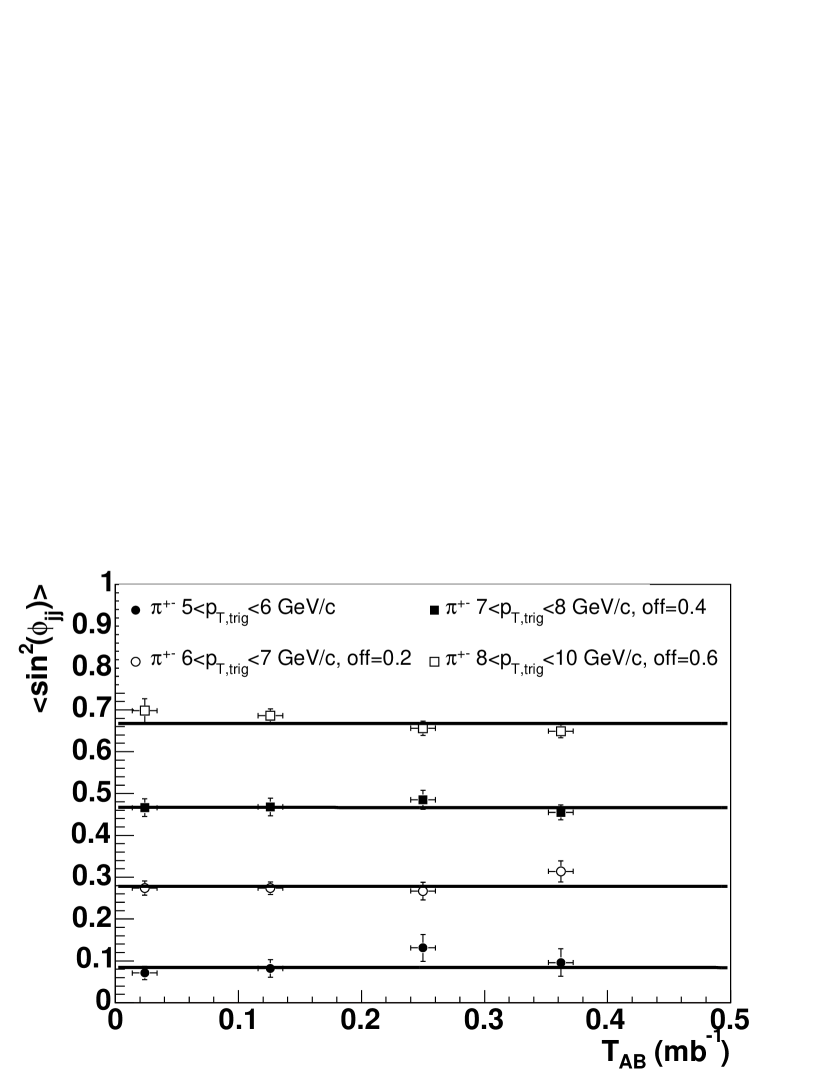

All the data in Fig. 40 have been simultaneously fit with the following linear equation in
| (42) |
The slope parameter, , is assumed to be common to all data sets, while the pre-factors, , depend on the of the trigger and associated particles. The extracted slope mb with chi-squared per degree-of-freedom, . This slope is consistent with zero, i.e. we do not observe any significant increase in with centrality.
This can be compared to predictions from Hwa and Wang Hwa and Yang (2004a) who assume no increase in with centrality to reproduce the Cronin effect data at RHIC and Qiu and Vitev Qiu and Vitev (2004) who calculate
| (43) |
To gain some insight into the magnitude of Qiu and Vitev’s predicted effect compared to our experimental results, we recast Eq. 43 into the same form as Eq. 42.
| (44) |
Hence their prediction for the fractional increase in with is from 0.51 to 0.72 depending on the range (GeV/)2 suggested by Qiu and Vitev Qiu and Vitev (2004)444For % + Au collisions, mb-1. Though the predicted fractional increase is of a different quantity, it should provide an estimate of the magnitude of the fractional increase in . The prediction is slightly larger than one standard deviation (statistical) from our experimental result, mb. If the measured value for at RHIC turns out to be larger than assumed by Qiu and Vitev Qiu and Vitev (2004) then the predicted fractional increase in Eq. 44 will be smaller.
Barnafoldi et al. Barnafoldi et al. (2004) have also predicted the increase in due to multiple scattering in + Au collisions at RHIC. They calculate that increases by (GeV/)2 per collision up to the first four collisions, then it saturates. Their prediction is
Barnafoldi et al. do not provide values for , however if we use the range (GeV/)2 suggested by Qiu and Vitev Qiu and Vitev (2004) then the fractional increase with is 40 to 56 for followed by no further increase. This rapid increase is not observable in our data set because the model saturates already in the most peripheral + Au bin where mb-1.
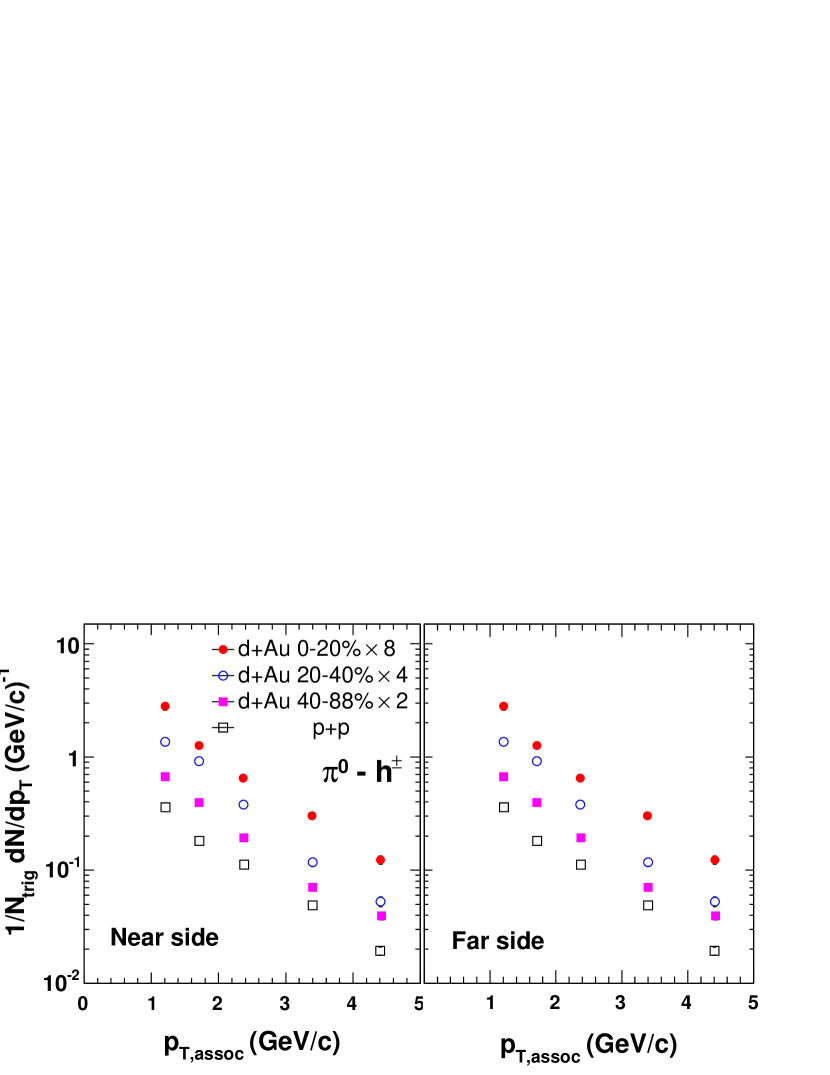
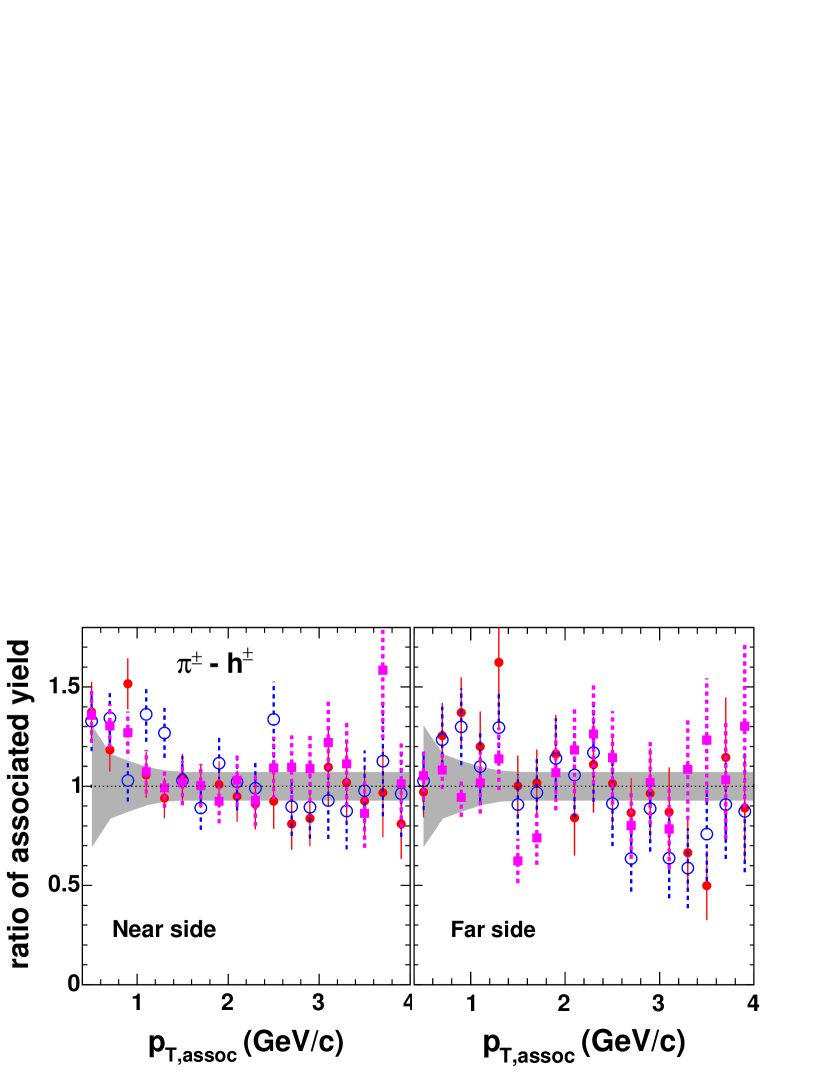
As discussed in Section I, inelastic scattering of the hard parton in the cold-medium may also increase the conditional yields () of hadrons that are associated with a high- trigger. Figure 41 shows the centrality dependence of the extracted , together with from collisions. The difference can be better illustrated by taking the ratio ( + Au/) of the per trigger yield as shown in Fig. 42. There is a possible increase in near-side particle yield for GeV/ in the + Au collisions. In other momentum ranges there is no consistent difference between yields in + Au and collisions. The recombination model of Ref. Hwa and Yang (2004b) predicted a factor of two increase in CY peripheral to central + Au collisions which is much larger than observed in the data. A later recombination model by the same authorsHwa and Tan (2005) postdicted only a 30% increase in CY for associated particles at GeV/, which is comparable or perhaps slightly larger than is observed in the data.
V Conclusions
We have measured several properties of jet fragmentation and dijet correlations using two-particle correlations with three different particle combinations: , , and . From the correlation functions we have extracted the widths of the near- and far-angle correlations as a function of the momentum of the two hadrons, and . These widths decrease as a function of both the trigger and associated particle’s momenta. From the near-angle widths we calculate , the RMS of the transverse momentum of fragmented hadrons with respect to the hard parton. The value of saturates at (stat) (sys) GeV/ for GeV/ and is consistent with being independent of and trigger species. The is similar for + Au and collisions consistent with the fragmentation process not being affected by the presence of the cold nuclear medium.
We have also compared the measured distributions in + Au collisions to the baseline distributions from collisions. The distributions extracted from the far-angle correlations provide information on the fragmentation of a back-to-back parton triggered on a high- hadron in the opposite hemisphere. The measured distributions in + Au are approximately independent of , i.e. they scale. We have quantified the level of scaling violation by extracting the slope for different ranges of . The slopes are consistent with zero for + Au collisions, i.e. there is no significant scaling violation. Point-by-point the scaling-violation slopes for collisions are not significantly different than the + Au data. This suggests that if there is any additional gluon radiation in + Au reactions due to multiple scattering, then this has little observable influence on the fragmentation of the hard parton.
We observe no centrality dependence of the conditional yield in + Au and these yields are very similar to those from collisions. The recombination model of Ref. Hwa and Tan (2005) postdicted a 30% increase in conditional yield between + Au and , which is perhaps slightly larger than is observed in the data.
We have extracted the dijet acoplanarity from the widths of the back-to-back correlations in + Au and collisions. In collisions involving nuclei, multiple interactions within the nucleus would tend to increase the parton transverse momentum which would be observable as a larger dijet acoplanarity, i.e., the back-to-back distribution of jets should broaden. However, in + Au collisions the extracted values of are very similar to those observed in collisions. Indeed, the quadrature difference () between in + Au and is consistent with zero, (stat) 0.000(sys). The extracted is also measured to be independent of the nuclear thickness function , which is in contrast to the strong A-dependence of observed at lower beam energies Stewart et al. (1990); Corcoran et al. (1994); Naples et al. (1994).
We have compared the centrality dependence of the extracted with the multiple scattering model of Qiu and Vitev Qiu and Vitev (2004). This model reproduces the measured Cronin effect of single-particle spectra at RHICAdler et al. (2003a) Adams et al. (2003) Back et al. (2003) and predicts a finite increase of data with nuclear thickness function. When converted to a fractional increase, the prediction is at a level that is within the experimental uncertainty of the current data. Hence our present data on are not inconsistent with the level of multiple scattering deduced from the single-particle Cronin effect.
Taken together, we observe no change in fragmentation and no indication of the effects of multiple-scattering, i.e. the jet-structures are very similar in +Au and collisions at RHIC energies. Our measurements also provide a critical baseline for jet measurements in Au+Au collisions at RHIC.
VI Acknowledgements
We thank the staff of the Collider-Accelerator and Physics Departments at Brookhaven National Laboratory and the staff of the other PHENIX participating institutions for their vital contributions. We acknowledge support from the Department of Energy, Office of Science, Nuclear Physics Division, the National Science Foundation, Abilene Christian University Research Council, Research Foundation of SUNY, and Dean of the College of Arts and Sciences, Vanderbilt University (U.S.A), Ministry of Education, Culture, Sports, Science, and Technology and the Japan Society for the Promotion of Science (Japan), Conselho Nacional de Desenvolvimento Científico e Tecnológico and Fundação de Amparo à Pesquisa do Estado de São Paulo (Brazil), Natural Science Foundation of China (People’s Republic of China), Centre National de la Recherche Scientifique, Commissariat à l’Énergie Atomique, Institut National de Physique Nucléaire et de Physique des Particules, and Association pour la Recherche et le Développement des Méthodes et Processus Industriels (France), Ministry of Industry, Science and Tekhnologies, Bundesministerium für Bildung und Forschung, Deutscher Akademischer Austausch Dienst, and Alexander von Humboldt Stiftung (Germany), Hungarian National Science Fund, OTKA (Hungary), Department of Atomic Energy and Department of Science and Technology (India), Israel Science Foundation (Israel), Korea Research Foundation and Center for High Energy Physics (Korea), Russian Ministry of Industry, Science and Tekhnologies, Russian Academy of Science, Russian Ministry of Atomic Energy (Russia), VR and the Wallenberg Foundation (Sweden), the U.S. Civilian Research and Development Foundation for the Independent States of the Former Soviet Union, the US-Hungarian NSF-OTKA-MTA, and the US-Israel Binational Science Foundation.
References
- Cronin et al. (1975) J. W. Cronin et al., Phys. Rev. D11, 3105 (1975).
- Adler et al. (2003a) S. S. Adler et al. (PHENIX), Phys. Rev. Lett. 91, 072303 (2003a), eprint nucl-ex/0306021.
- Adams et al. (2003) J. Adams et al. (STAR), Phys. Rev. Lett. 91, 072304 (2003), eprint nucl-ex/0306024.
- Back et al. (2003) B. B. Back et al. (PHOBOS), Phys. Rev. Lett. 91, 072302 (2003), eprint nucl-ex/0306025.
- Della Negra et al. (1977) M. Della Negra et al. (CERN-College de France-Heidelberg-Karlsruhe Collaboration), Nucl. Phys. B127, 1 (1977).
- Feynman et al. (1978) R. P. Feynman, R. D. Field, and G. C. Fox, Phys. Rev. D18, 3320 (1978).
- Stewart et al. (1990) C. Stewart et al. (E557), Phys. Rev. D42, 1385 (1990).
- Corcoran et al. (1994) M. D. Corcoran et al. (E609), Phys. Lett. B259, 209 (1994).
- Naples et al. (1994) D. Naples et al. (E683), Phys. Rev. Lett. 72, 2341 (1994).
- Angelis et al. (1980) A. Angelis et al., Phys. Lett. B 97, 163 (1980).
- Adams et al. (1994) M. R. Adams et al., Phys. Rev. Lett. 72, 466 (1994).
- Accardi (2002) A. Accardi (2002), eprint hep-ph/0212148.
- Wang (2000) X. N. Wang, Phys. Rev. C61, 064910 (2000), eprint nucl-th/9812021.
- Qiu and Vitev (2004) J.-W. Qiu and I. Vitev (2004), eprint hep-ph/0405068.
- Barnafoldi et al. (2004) G. G. Barnafoldi, G. Papp, P. Levai, and G. Fai, J. Phys. G30, S1125 (2004), eprint nucl-th/0404012.
- Hwa and Yang (2004a) R. C. Hwa and C. B. Yang, Phys. Rev. Lett. 93, 082302 (2004a), eprint nucl-th/0403001.
- Fisk et al. (1978) R. J. Fisk et al., Phys. Rev. Lett. 40, 984 (1978).
- Jacob (1979) M. Jacob (1979), rapporteur’s talk given at EPS Int. Conf, Geneva, Switzerland, Jun 27 - Jul 4, 1979.
- Angelis et al. (1979) A. L. S. Angelis et al. (CERN-Columbia-Oxford-Rockefeller), Phys. Scripta 19, 116 (1979).
- Abbiendi et al. (2004) G. Abbiendi et al. (OPAL), Eur. Phys. J. C37, 25 (2004), eprint hep-ex/0404026.
- Kniehl et al. (2000) B. A. Kniehl, G. Kramer, and B. Potter, Nucl. Phys. B582, 514 (2000), eprint hep-ph/0010289.
- Hwa and Yang (2004b) R. C. Hwa and C. B. Yang, Phys. Rev. C70, 054902 (2004b), eprint nucl-th/0407081.
- Hwa and Tan (2005) R. C. Hwa and Z. Tan (2005), eprint nucl-th/0503060.
- Huth et al. (1992) J. Huth et al., in Proceedings of Research Directions For The Decade: Snowmass 1990, edited by E. Berger (World Scientific, Singapore, 1992), p. 134.
- (25) S. Catani, Y. Dokshitzer, M. Seymour, B. W. J. Ellis, and D. S. P. . (1993).
- Angelis et al. (1982) A. Angelis et al., Nucl. Phys. B 209, 284 (1982).
- Adler et al. (2003b) C. Adler et al. (STAR), Phys. Rev. Lett. 90, 032301 (2003b), eprint nucl-ex/0206006.
- Adler et al. (2003c) C. Adler et al. (STAR), Phys. Rev. Lett. 90, 082302 (2003c), eprint nucl-ex/0210033.
- Rak (2004) J. Rak, J. Phys. G30, S1309 (2004), eprint hep-ex/0403038.
- Adler et al. (2005a) S. S. Adler et al. (PHENIX), Phys. Rev. C71, 051902 (2005a), eprint nucl-ex/0408007.
- Ajitanand (2003) N. N. Ajitanand (PHENIX), Nucl. Phys. A715, 765 (2003), eprint nucl-ex/0210007.
- Jia (2005) J. Jia, J. Phys. G31, S521 (2005), eprint nucl-ex/0409024.
- Constantin (2004) P. Constantin, Ph.D. thesis, Iowa State University (2004).
- Adcox et al. (2003a) K. Adcox et al. (PHENIX), Nucl. Instrum. Meth. A499, 469 (2003a).
- Allen et al. (2003) M. Allen et al. (PHENIX), Nucl. Instrum. Meth. A499, 549 (2003).
- Aphecetche et al. (2003) L. Aphecetche et al. (PHENIX), Nucl. Instrum. Meth. A499, 521 (2003).
- Adcox et al. (2003b) K. Adcox et al. (PHENIX), Nucl. Instrum. Meth. A499, 489 (2003b).
- Mitchell et al. (2002) J. T. Mitchell et al. (PHENIX), Nucl. Instrum. Meth. A482, 491 (2002), eprint nucl-ex/0201013.
- Adler et al. (2004) S. S. Adler et al. (PHENIX), Phys. Rev. C69, 034910 (2004), eprint nucl-ex/0308006.
- Aizawa et al. (2003) M. Aizawa et al. (PHENIX), Nucl. Instrum. Meth. A499, 508 (2003).
- Adler et al. (2005b) S. S. Adler et al. (PHENIX), Phys. Rev. Lett. 94, 082301 (2005b), eprint nucl-ex/0409028.
- Sjostrand et al. (2001) T. Sjostrand, L. Lonnblad, and S. Mrenna (2001), eprint hep-ph/0108264.
- Adams et al. (2004) J. Adams et al. (STAR), Phys. Rev. C70, 064907 (2004), eprint nucl-ex/0408016.
- Stankus (2005) P. Stankus, PHENIX technical note 412, to be published (2005).
- Ajitanand et al. (2005) N. N. Ajitanand et al., Phys. Rev. C72, 011902 (2005), eprint nucl-ex/0501025.
- van Apeldoorn et al. (1975) G. van Apeldoorn, R. Blokzijl, D. Holthuizen, B. Jongejans, J. Kluyver, J. Warmerdam-de Leeuw, W. Metzger, H. Tiecke, and J. Timmermans, Nucl. Phys. B91, 1 (1975).
- Agababyan et al. (1994) N. M. Agababyan et al. (EHS-NA22), Phys. Lett. B320, 411 (1994).