production as seen in and decay channels in Au+Au collisions by PHENIX at = 200 GeV
Abstract
The properties of the -meson have been measured via its and decay channels in Au+Au collisions at = 200 GeV by the PHENIX experiment. The preliminary yields and temperatures derived for the minimum bias and several centrality bins in both decay channels are presented.
1 Introduction
The -meson is an important diagnostic tool for the state of matter produced in relativistic heavy ion collisions. It can be sensitive to chiral symmetry restoration through in-medium modification of its spectral properties (mass and/or shape) [1]. In particular, since , even small changes in the spectral properties of the or can induce significant changes in the yield. The PHENIX detector has an excellent mass resolution and is capable of measuring both and decay channels simultaneously. The present results are from the Au+Au collisions at = 200 GeV measured by PHENIX during the 2004 RHIC run.
2 PHENIX experiment
The analysis was performed using the two central arms of the PHENIX spectrometer [2] which cover the pseudorapidity range 0.35 and 2 90∘ in azimuthal angle . The momentum and charge were determined using the drift chamber (DC) and the pad chamber (PC1). Valid DC-PC1 tracks were confirmed by the matching of the projected and associated hit information to the Ring Imaging Cherenkov (RICH) detector and electromagnetic calorimeter (EMCal) in the case of electrons and to the Time Of Flight (TOF) detector or EMCal in the case of kaons.
Electrons were identified by the RICH and by requiring the energy in the EMCal to match the measured momentum of the tracks. Kaons were identified using the timing information from the TOF and EMCal which have very good /K separation in the momentum range 0.3 2.5 and 0.3 1.0, respectively.
The beam-beam counters (BBC) and the zero-degree calorimeters (ZDC) provided the trigger and determined the event centrality. The BBC’s were also used to determine the -coordinate of the collision vertex ().
The analysis used 903 106 minimum bias events with a vertex position within - 28 26. Kaons identified by TOF and EMCal were combined in pairs using four different detector combinations: TOF-TOF, TOF-EMCEAST, EMCEAST-EMCEAST, EMCWEST-EMCWEST. The analysis performed with TOF-TOF (other detector combinations) used 409 (170) 106 minimum bias events with a vertex position within 30.
3 Analysis procedure
The meson yield (dN/dy) and temperature (T) were derived from the invariant mT-distribution:
| (1) |
where is the raw yield, is the correction factor to account for acceptance and pair reconstruction efficiency, is the number of analyzed events, is the pair embedding efficiency to account for the reconstruction efficiency losses due to detector occupancy, is an efficiency which takes into account run-by-run variations of the detector performance, is the branching ratio for or and is the bin size.
The raw yield for each decay channel was determined in two steps. First, all identified particles in a given event were combined in pairs to form like- and unlike-sign invariant mass spectra. The inherent combinatorial background was estimated by using an event mixing procedure in which the particles from one event were combined with the particles from the next twenty events provided that all events belong to the same centrality and vertex classes. The unlike-sign mixed event integral yield was normalized to the measured 2 yield. The validity of this method of event mixing was confirmed by comparing the like-sign invariant mass spectra from mixed events to the measured one. In the second step, we subtracted the normalized unlike-sign mixed event spectrum from the measured one and derived the mass distribution. In the dielectron channel the meson yield derived for the mass window 0.997 1.041 was about 900 counts with a signal to background (S/B) ratio of about 1/50. The meson yield in kaon channel (mass window 1.014 1.024) was about 44000 counts with S/B of 1/10.
The correction factor was determined using Monte Carlo simulations. Single -mesons were generated with an exponential transverse momentum distribution. The ’s were decayed, propagated through an emulator of the PHENIX detector and the resulting output was passed through the whole analysis chain. For each mT bin the ratio of the generated yield to the reconstructed one gives the correction factor .
Finally, the dN/dy and T were extracted from the corrected invariant mT spectra fitted with the following exponential function having dN/dy and T as parameters:
| (2) |
where Mϕ is the PDG value of the meson’s mass, 1.019 GeV/c2.
4 Results
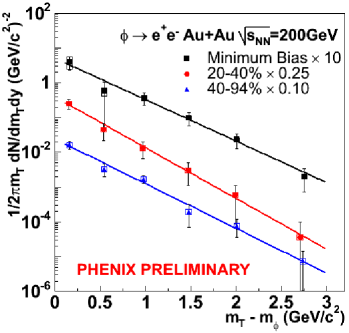
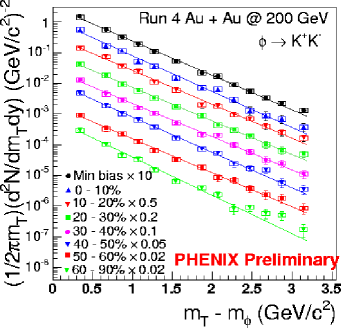
In this contribution we present only mT spectra, yield and temperature results derived from the measurements of the -meson through the two decay channels. The invariant mT spectra for minimum bias and several centrality bins fitted with the exponential function Eq. 2 are shown in the left and right panels of Fig. 1 for and , respectively.
The yields and temperatures extracted from the fits are summarized in Table 1 and Table 2. The systematic errors quoted in the tables result from the uncertainties both in the simulation and in the analysis procedure. The dN/dy and T obtained in the measurements are in agreement with the results of RHIC run 2002 [3] within the statistical and systematic errors.
| Centrality % | dN/dy | T (GeV) |
|---|---|---|
| MB | 1.54 0.43(stat) 0.43(syst) | 0.364 0.031(stat) 0.025(syst) |
| 20 - 40 | 3.64 0.89(stat) 0.76(syst) | 0.297 0.036(stat) 0.033(syst) |
| 40 - 94 | 0.66 0.12(stat) 0.12(syst) | 0.338 0.030(stat) 0.041(syst) |
| Centrality % | dN/dy | T (GeV) |
|---|---|---|
| MB | 1.08 0.04(stat) 0.20(syst) | 0.388 0.005(stat) 0.027(syst) |
| 0 - 10 | 3.80 0.30(stat) 0.72(syst) | 0.372 0.011(stat) 0.026(syst) |
| 10 - 20 | 2.32 0.16(stat) 0.44(syst) | 0.394 0.010(stat) 0.027(syst) |
| 20 - 30 | 1.62 0.11(stat) 0.31(syst) | 0.397 0.010(stat) 0.028(syst) |
| 30 - 40 | 0.95 0.07(stat) 0.18(syst) | 0.401 0.010(stat) 0.028(syst) |
| 40 - 50 | 0.75 0.04(stat) 0.13(syst) | 0.377 0.008(stat) 0.026(syst) |
| 50 - 60 | 0.35 0.03(stat) 0.06(syst) | 0.392 0.012(stat) 0.027(syst) |
| 60 - 90 | 0.11 0.01(stat) 0.02(syst) | 0.348 0.011(stat) 0.024(syst) |
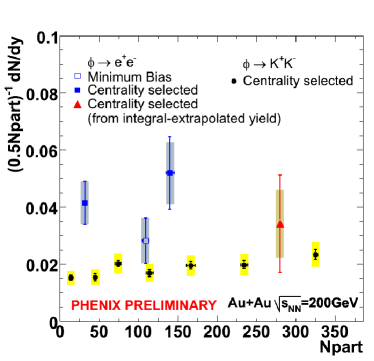
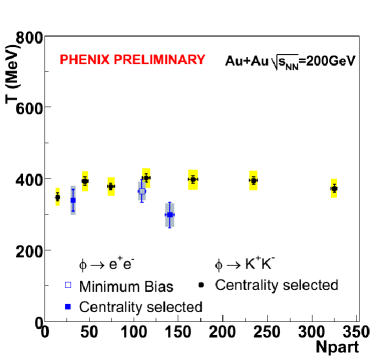
Fig. 2 shows the comparison of yields dN/dy (left panel) and temperatures T (right panel) extracted in the two decay channels. The dielectron yield in the highest centrality bin has limited statistics and its dN/dy (shown in the left panel of Fig. 2 as a triangle) was derived from an independent analysis using the integral yield. The corresponding correction factor integrated over mT was obtained under the assumption that T = 366 MeV.
The temperatures measured in the and decay channels are in agreement within errors. The dN/dy value in the decay channel seems to be larger than in the decay channel. However, although the present data quality is significantly improved with respect to the run-2 results [3, 4], the errors in the dielectron channel, both statistical and systematic, are still too large for a definite statement. Further improvement in the measurements of the dielectrons will be achieved with the planned upgrade of the PHENIX detector with a novel Hadron Blind Detector (HBD) which is expected to significantly reduce the combinatorial background [5].
References
- [1] S. Pal, C.M. Ko and Z. Lin, Nucl. Phys. A707, (2002) 525.
- [2] K. Adcox et al. (PHENIX Collaboration), Nucl. Instr. and Meth. A499, (2003) 469.
- [3] S.S. Adler et al. (PHENIX Collaboration), Phys. Rev. C 72, (2005) 014903.
- [4] D. Mukhopadhyay for the PHENIX Collaboration, Nucl. Phys. A715 (2003) 494.
- [5] I. Ravinovich for the PHENIX Collaboration, (these proceedings).