Analysis of Dynamic Multiplicity Fluctuations at PHOBOS
Abstract
This paper presents the analysis of the dynamic fluctuations in the inclusive charged particle multiplicity measured by PHOBOS for Au+Au collisions at GeV within the pseudo-rapidity range of . First the definition of the fluctuations observables used in this analysis is presented, together with the discussion of their physics meaning. Then the procedure for the extraction of dynamic fluctuations is described. Some preliminary results are included to illustrate the correlation features of the fluctuation observable. New dynamic fluctuations results will be available in a later publication.
One of the important goals of the experiments at the Relativistic Heavy Ion Collider (RHIC) is to search for the evidence of the quark-gluon plasma(QGP) /hadron gas(HG) phase transition. Event-by-event fluctuations might be a useful signature of phase transition evidence, since they could be significantly altered if a phase transition occurs shortly after the collision[1] due to the the large difference between the degrees of freedom of the two phases. Since fluctuation observables are intrinsically related to particle correlations, the study of fluctuations could also provide helpful insights on the mechanisms of particle production in heavy ion collisions.
In this analysis, we measure the inclusive charged particle multiplicity fluctuations as a function of the separation and bin size in pseudo-rapidity() space in Au+Au collisions with an energy of GeV. Since the event-by-event particle multiplicity is mainly determined by the the number of participating nucleons () in the collision, a significant amount of the multiplicity fluctuations is due to the variation, which is just a geometry effect. To study the dynamic fluctuations which are related to intrinsic particle production mechanisms, the fluctuations must be removed from the measurement of multiplicity fluctuations.
For the study of multiplicity fluctuations, we use an event-by-event observable , which is defined as
| (1) |
where and are the multiplicities in a pair of bins with the same bin size and symmetric with respect to . The width of the distributions () is used as our fluctuations observable. Because the difference of the two multiplicities is used in the definition of and the two multiplicities change in the same direction when varies from event to event, the fluctuations are suppressed in the measured . Also because of event-by-event normalization factor in the denominator, for independent particles. Thus non-1 indicates non-0 dynamic fluctuations in addition to the statistical fluctuations. We can decompose the multiplicity fluctuations into two parts: statistical fluctuations () and dynamic fluctuations (). While the statistical fluctuations are due to the finite multiplicity, the dynamic fluctuations are related to the intrinsic correlations in the particle production. The long range (particles from different bins) correlations and the short range (particles usually in the same bin) have different effect in and different signs of the dynamic fluctuations.
To understand what effect the long range correlations have on , we can use the approximate expression for : where is the correlation coefficient between and , assuming the multiplicity follows Poisson distribution (). With such approximation, , positive long range correlations lead to negative dynamic fluctuations and reduce from 1. The short range correlations can be treated as a cluster effect and related to the UA5 cluster multiplicity study[2]. Assuming the particles are created in cluster with multiplicity , and the multiplicity in the investigated bin is increased by a factor of , is increased to and is changed to correspondingly. We then have which is a measure of cluster multiplicity, if all the associated particles in the cluster are included in one bin. In practice not all the associated particles in cluster can be included in the same bin, and can be regarded as an “effective” cluster multiplicity. Thus the short range correlations lead to positive dynamic fluctuations and increase from 1. There is also the case where the short range correlations show long range effect in , if the correlated particles are selected into different but close bins.
For calculated from reconstructed event multiplicity, it also includes additional detector effects. Since both the distribution of the particles from the model event generator and the distribution of the reconstructed multiplicity after detector response simulation are very close to Gaussian distributions, we may treat the detector effects as Gaussian response smearing and write the reconstructed multiplicity fluctuations as the sum of three parts:
| (2) |
where the represents the detector effects. Using the detector simulation to estimate , the dynamic fluctuations can be extracted from the following simple equation:
| (3) |
This analysis used data taken by the PHOBOS detectors[3] during the runs providing Au+Au collisions at GeV. Only those data taken with a zero magnetic field setting and minimum bias triggers were used. The PHOBOS octagonal multiplicity detector was used to measure the charged particle multiplicity. It consists of 92 silicon sensors which surround the beam pipe and cover the pseudo-rapidity range of . The active elements of the octagonal detector are constructed of highly segmented silicon pads which yield signals at the passage of charged particles. Within this detector, every second azimuthal octant has a window for another detector (spectrometer or vertex detector), which leads to incomplete azimuthal coverage. To reduce the systematic uncertainties in the fluctuations results, these nonuniform octants were excluded in the analysis of the reconstructed multiplicities from both the data and simulations, which left a total nominal azimuthal coverage of 50%.
In each bin, the sum of the angle-normalized energy deposits () was used to estimate the multiplicity of charged particles in a collision event. Assuming that the number of particles hitting a silicon pad follows a Poisson distribution, the number of recorded hits () in the bin can be fitted as a function of the sum of the normalized energy deposits() to extract two parameters and . The parameter can be regarded as the effective number of active pads in the investigated bin and is then taken as the average energy deposited by one charged particle in this bin. Thus the multiplicity in the investigated bin can be estimated as . From estimated charge multiplicities in two symmetric bins, and , the variable is calculated for each event. The bins are chosen to have equal size and to be symmetric about =0 in order to assure similar multiplicities in forward and backward regions. The of the distribution in each centrality and pseudo-rapidity bin is calculated directly as the fluctuations variable .
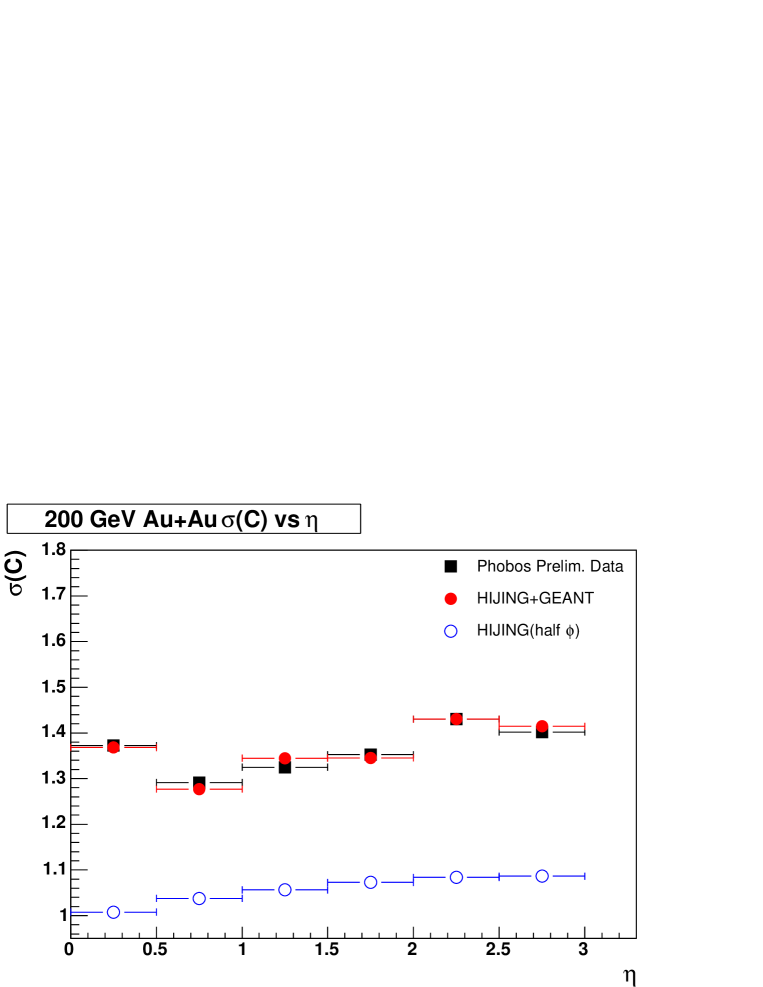
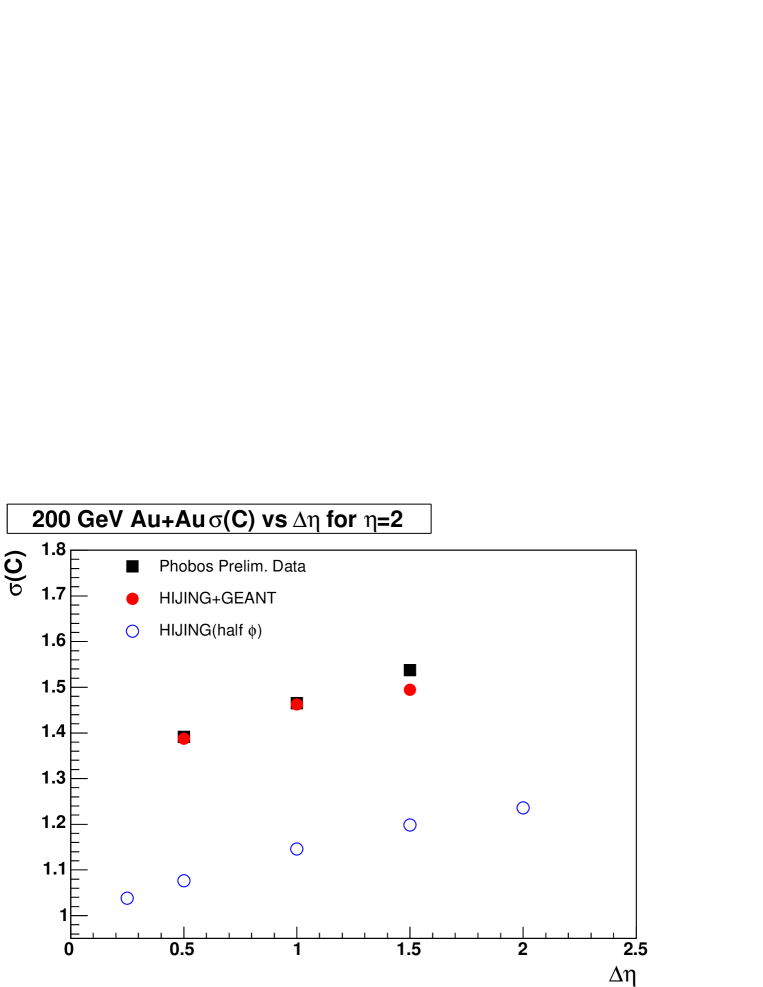
Some preliminary results[4] are shown in Figure 1 and 2. Figure 1 shows the dependence on the separation in space with fixed bin size 0.5. The data and reconstructed simulation (HIJING[5]+GEANT[6]) are similar. Both have a non-monotonic dependence on because of the presence of the detector effects. The HIJING are slightly greater than 1, with the difference between the and 1 increasing with the separation. This indicates that the dynamic fluctuations of HIJING are greater than 0. The suppression in the mid-rapidity region is due to the fact that negative long range effect of the short range correlated particles selected into different bins cancels the positive short range correlations effect. Figure 2 shows the dependence on the bin size with the centered at 2.0. The data and reconstructed simulation(HIJING+GEANT) are again similar. The HIJING increases with the bin size. Such dependence on the bin size is a typical feature of particle correlations with finite correlation length. The data and reconstructed simulation also have the same trend of increasing with bin size.
Since detector effects dominate in the reconstructed multiplicity fluctuations as shown in Figure 1 and 2, it is necessary to clearly understand such effects in order to extract the dynamic fluctuations from the experimental measurement. Extensive GEANT detector simulations with different settings were used to investigate the relative importance of various sources in the observed detector effects. Four main detector effects were identified. The acceptance gap effect is significant in mid-rapidity region, but negligible in higher region. Such acceptance gap effect in was caused by the asymmetric acceptance of the dead channels and gaps in eta coupled with the finite extension of the event vertex position. Since the energy deposit was used in the evaluation of the charged particle multiplicity, fluctuations also contribute to . The variations are due to Landau fluctuations and the wide range of detected particle velocities ( variations). The variation contribution is more significant in the mid-rapidity region than in the high region. The Landau fluctuations contribution is nearly constant throughout range covered by the octagonal detector. The contribution of secondary particles originating from primary particle decays and interactions is important primarily in the high region because of the longer path length and higher probability of decay or interaction.
To extract reliable dynamic fluctuations from the data, the analysis procedure was refined to suppress the detector effects as much as possible. For those residual detector effects which can not be suppressed through the improved analysis procedure, the simulations were used to reproduce them. In the mid-rapidity region and central collisions, the acceptance gap effect is the dominant detector effect. Through careful analysis of the cause of such detector effect, we designed an effective procedure for the suppression of the acceptance gap-induced detector effects by subtracting an event-by-event offset, which is the mean of the distribution in each (, , Centrality bin). This offset does not change the fluctuations due to other sources. Another improvement in the analysis is to use -dependent hit cuts to suppress detector effects from the secondary contribution in high eta region. Using the improved analysis procedure, the detector effects in are greatly reduced and significantly less than those shown in preliminary results in Figure 1 and Figure 2.
Three different simulations were used to evaluate the detector effects for the extraction of dynamic fluctuations: standard HIJING+GEANT, standard AMPT[7]+GEANT and modified HIJING+GEANT. The modified HIJING uses the HIJING event generator to generate events and randomizes the sign in of the particles, thus destroying correlations between the particles while keeping other physics properties unchanged. Equation (2) was used to extract the detector effects from these simulations. The extracted detector effects are similar but have some small model dependence. Careful examination of the extracted detector effects’ dependence on the model dynamic fluctuations helped identifying a linear relation between the extracted detector effects and the dynamic fluctuations of the model used in detector simulation, which is parametrized as
| (4) |
where the two parameters and were estimated by fitting the as a function of for each bin. Such function fit was possible since there were three different simulations. The fitted and were then used to construct adjusted detector effects for the extraction of dynamic fluctuations with the following equation:
| (5) |
Since the multiplicity was calculated using only half of the azimuthal acceptance, the extracted dynamic fluctuations were multiplied by the factor 2 to extrapolate dynamic fluctuations in half acceptance to that corresponding to full azimuthal acceptance. Such extrapolation was validated by the analysis of the dynamic fluctuations in simulations. In both HIJING and AMPT, the ratio of dynamic fluctuations for full azimuthal acceptance and dynamic fluctuations for half azimuthal acceptance in all the investigated bins is 2.
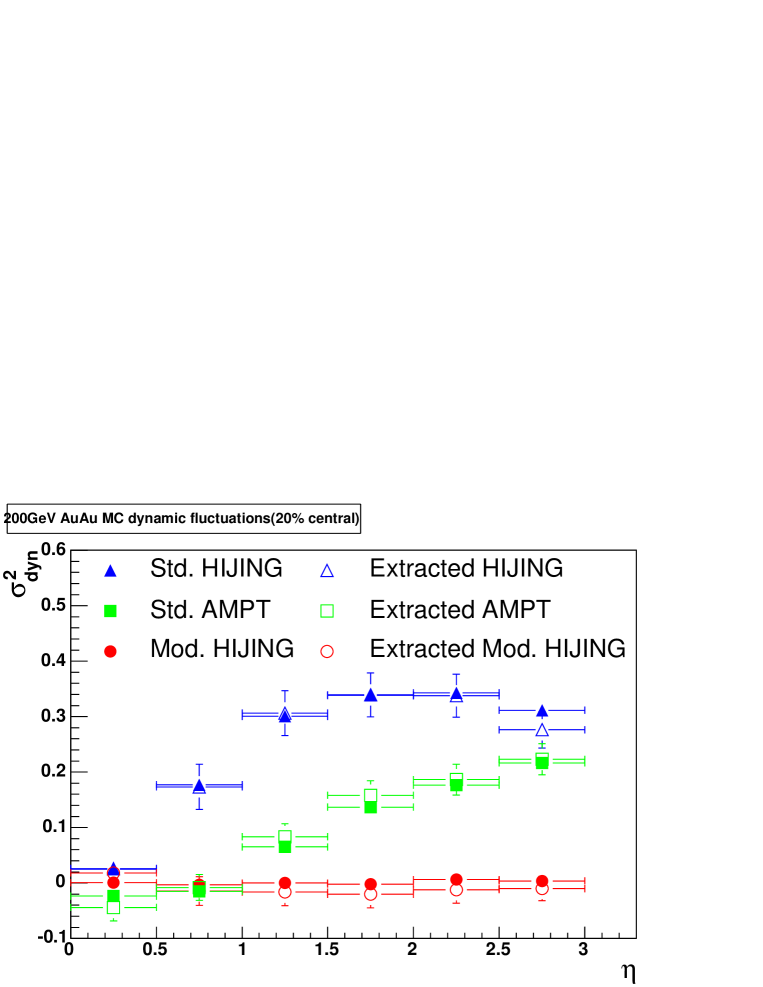
The dynamic fluctuations extraction procedure was applied to the reconstructed simulations to extract their dynamic fluctuations. As shown in Figure 3, the extracted dynamic fluctuations are consistent with the true dynamic fluctuations in all three simulations. Thus the analysis procedure for the extraction of dynamic fluctuations from reconstructed multiplicity was validated by simulations. We are now applying this procedure to extract the dynamic fluctuations from the Au+Au data. The analysis results compared with model predictions will be available in a later paper. We expect the new dynamic fluctuations results will provide useful insights on the intrinsic particle correlations in Au+Au collisions.
In summary, we analyzed the multiplicity fluctuations in the inclusive charged particle production in Au+Au collisions at GeV within the pseudo-rapidity range of . The preliminary fluctuations in the data are similar to that in reconstructed simulations(HIJING+GEANT). The HIJING multiplicity fluctuations grow with increasing bin separation and width, revealing the existence of particle correlations in Au+Au collisions. An improved analysis procedure for extracting the dynamic fluctuations from the data was developed. This procedure was validated with simulations and it is now being used to extract the dynamic fluctuations from experimental data. The new data results will be available in near future. We expect these results will provide helpful insights on the intrinsic correlations in particle production. They could also be very useful input for theoretical model development for understating the particle production mechanism in heavy ion collisions.
Acknowledgments
This work was partially supported by: U.S. DOE grants
DE-AC02-98CH10886,
DE-FG02-93ER40802,
DE-FC02-94ER40818, DE-FG02-94ER40865,
DE-FG02-99ER41099, and
W-31-109-ENG-38,
NSF grants 9603486, 0072204, and 0245011, Polish KBN grant 2-P03B-10323, NSC of Taiwan contract NSC 89-2112-M-008-024.
References
- [1] Stephanov M, Rajagopal K and Shuryak E, Phys. Rev. D60 (1999) 114028
- [2] Alpgard K et al., Phys. Lett. B123 (1983) 361
- [3] Back B B et al., (PHOBOS), Nucl. Instrum. Methods Phys. Res., Sect. A 499 (2003) 603
- [4] Wozniak K et al., (PHOBOS), J. Phys. G30 (2004) S1377-S1380
- [5] Gyulassy M and Wang X N, Phys. Rev. D44 (1991) 3501
- [6] Brun R et al., GEANT 3.21, Detector Description and Simulation Tool, CERN Program Library Long Write-up W5013, 1994
- [7] Zhang B and Kuo C M and Li B A and Lin Z, Phys. Rev. C61 (2000) 067901