Ortho-para transition rate in -molecular hydrogen and the proton’s induced pseudoscalar coupling
Abstract
We report a measurement of the ortho-para transition rate in the pp molecule. The experiment was conducted at TRIUMF via the measurement of the time dependence of the 5.2 MeV neutrons from muon capture in liquid hydrogen. The measurement yielded an ortho-para rate s-1 that is substantially larger than the earlier result of Bardin et al. We discuss the striking implications for the proton’s induced pseudoscalar coupling .
pacs:
23.40.-s, 11.40.Ha, 33.15.pwThe protons’s weak axial current is governed by the weak axial form factor () and the induced pseudoscalar form factor () and their corresponding coupling constants and . The values of the coupling constants and the dependence of the form factors are determined by the proton’s sub-structure and the underlying QCD dynamics. The approximate chiral symmetry of QCD implies a rigorous relationship between these constants that yields either or [7, 8, 9, 10], and its experimental verification is an important test of low energy QCD.
The dominant uncertainty in extracting from capture in liquid H2 is the ortho-para transition rate from the ortho () state to the para () state. This transition has been investigated theoretically by several authors [11, 12, 13, 14]. It proceeds by Auger emission and its rate is a function of the electronic environment of the molecule, most notably analogues of the neutral H1 atom [] and the charged H ion []+. The only published measurement of the rate s-1 by Bardin et al. [15] is two standard deviations from the calculated rate s-1 of Balakov et al. [12].
Given its importance in determining we have performed a new measurement of the rate . Both the Bardin et al. experiment [15] and the current experiment were based on the measurement of the time spectrum of the 5.2 MeV neutrons from capture. Because of the spin dependence of the capture rate, and the spin configurations of the molecules, the rate is encoded in the neutron time dependence. Neglecting the initial formation of ortho molecules, the time dependence is
| (1) |
where is the muon disappearance rate and and are the ortho and para capture rates. Since and the hyperfine ratio are well established by experiment or theory, the rate can be extracted from the neutron time spectrum.
Our experiment was conducted on the M9B muon channel at the TRIUMF cyclotron. Incoming muons were counted in a two-element plastic scintillator beam telescope. The larger scintillator (33330.32 cm3) registered particles emerging from the beam pipe and the smaller scintillator (10100.16 cm3) registered particles incident on the H2 flask. The target [16, 17] comprised a cylindrical flask of length 15 cm and diameter 16 cm containing 2.7 liters of liquid H2 with ppm deuterium contamination and ppb contamination from impurities. The target flask had Au front/side walls and a Cu back-plate and the surrounding vacuum vessel had cylindrical Ag walls and a mylar front window.
Outgoing neutrons were detected in a liquid scintillator counter array consisting of four counters (-) with diameters cm and thicknesses cm and one counter () with a diameter cm and a thickness cm. The scintillator materials were NE224 (), NE213 () and BC501A (, , ) which permit n/ discrimination by pulse-shape. Sandwiched between the neutron counters and the vacuum vessel were plastic scintillator veto counters (-) for identification of -decay electrons.
Signals from each neutron counter were fed to pulse-shape discrimination modules [18]. The modules generated outputs indicating either a –ray trigger () or a neutron trigger () via the comparison of the integrated signals in a 420 ns prompt gate and a 52 ns delayed gate. To reduce the neutron trigger rate from mis-identified –rays/electrons we rejected those triggers accompanied by either a veto counter signal () or a large neutron counter signal (). All events that fulfilled the neutron trigger () and pre-scaled events that fulfilled the /e trigger () were recorded. The pulse-shape data included both primary information from the pulse-shape modules (PSD1) and secondary information from a charge integrating ADC (PSD2). Histories of beam telescope hits and veto counter hits were recorded in a multihit TDC.
The experiment was conducted in four distinct data-sets and yielded a total of 3.71010 stops in liquid H2. Empty target runs (yielding stops) and positive muon runs (yielding stops) were used for background studies. In sorting the data we applied cuts to separate the neutrons from p capture, with energies 5.2 MeV and lifetimes 2 s, from backgrounds which included both mis-identified -rays from electron bremsstrahlung and neutrons from nuclear capture, photo-nuclear reactions, accelerator sources, cosmic-rays, etc.
A pulse-shape cut and a pulse pile-up cut were used to minimize the contamination from mis-identified -rays. The pulse-shape cut involved a comparison of the integrated amplitudes in the signal peak and the signal tail, and used both PSD1 and PSD2 to achieve optimal n/ discrimination. The pulse pile-up cut rejected any event with 1 neutron counter hits in a preceding 600 ns time window, such pile-up potentially distorting the n/ discrimination.
An energy cut was used to enhance the signal of recoil protons from 5.2 MeV neutrons by requiring an energy equivalent of typically - MeV. A blank cut was used to reject the events from capture in high-Z materials (i.e. ns, ns and ns [19]) by rejecting any event with 1 hits in a 400 ns window preceding the neutron. Finally, we used a duty cycle cut to reject any events occurring within 32 s of the beam-off period in the cyclotron time structure, and an errant muon cut to reject any events occurring within 5 s of an incoming beam particle that fired but missed .
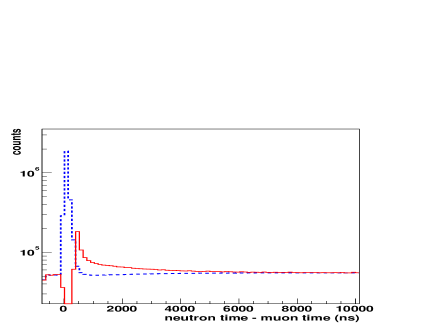
The time spectra between incoming muons and detected neutrons for events that survived all cuts excluding the blank cut and all cuts including the blank cut are plotted in Fig. 1. Note that for each event we increment the time spectrum for every coincidence in the multihit TDC. The spectra show a short-lifetime ( ns) component that is most evident for events that failed the blank cut, a long-lifetime ( s) component that is only evident for events that passed the blank cut, and a continuum background. The short-lifetime component is dominated by Ag/Au capture, the long-lifetime component is dominated by H2 capture, and the continuum arises from uncorrelated muons.
The procedures for accounting for backgrounds in the time spectrum of the events passing all cuts were (i) subtraction of the continuum background from uncorrelated muons, (ii) determination of contributions from photo-nuclear reactions following electron bremsstrahlung, and (iii) the determination of contributions from capture in low-Z materials.
The continuum is not perfectly time independent as decay electrons from uncorrelated muons can reject events by firing the veto counter () or overload circuit (). This random vetoing of neutron events by uncorrelated muons can be seen as the shallow hole for s for events failing the blank cut. Note that for times the events failing the blank cut are entirely dominated by the continuum background while the events passing the blank cut are comprised of p signal and continuum background. Thus, by normalizing and subtracting the events that failed the blank cut from those that passed the blank cut, the continuum is removed.
The photo-nuclear background originates from the photo-nuclear interactions [e.g. 12C(,)] in the liquid scintillators. Consequently, a tiny fraction of bremsstrahlung photons from decay electrons yield proton recoils. This background carries the 2.2 s lifetime of muonic H2 and therefore distorts the effective disappearance rate of p capture neutrons. To measure this background we conducted a measurement where neutrons from capture are absent but those from photo-nuclear reactions are present. From the amplitude of the s lifetime component in the neutron time spectrum we determined a contribution of photo-nuclear interactions to running that averaged about % for the thick counters N-N but rose to 8% for the thin counter . We used a GEANT3 simulation [20] to account for the difference in the -ray spectra from and stops due to annihilation.
The background from capture in low-Z materials, e.g. scintillators, light-pipes, is worrisome as the muonic C and H2 lifetimes are similar (2.028 s and 2.195 s). This background was determined by performing an empty target run in which stops occur in the Cu back-plate not the liquid H2. A GEANT3 simulation was used to establish that stops in scintillators, light guides, etc., were dominated by scattering from the beam pipe window and the beam telescope and thus unaffected by the target filling. The measurement showed no evidence for backgrounds from low-Z capture and established a limit of 7% on carbon backgrounds in production running.
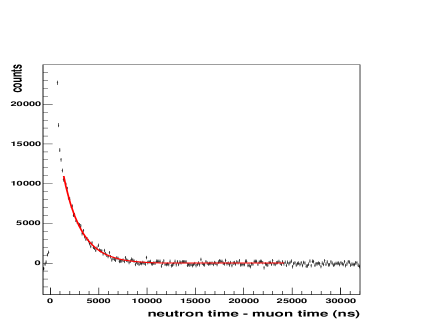
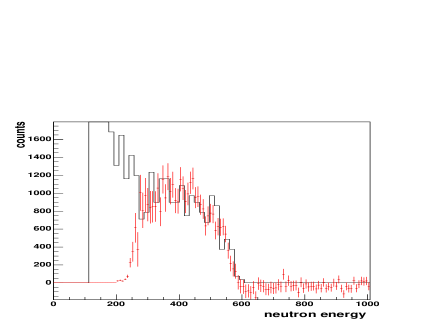
The time spectrum of neutron events that survived all cuts, after the subtraction of the continuum, is plotted in Fig. 2. A typical energy spectrum (, data-set I) is plotted in Fig. 3. It shows the expected spectrum for 5.2 MeV neutrons as obtained by a GEANT3 simulation of the experimental set-up.
When muons stop in liquid H2 they evolve through a sequence of different atomic and molecular states. Also, if D2 is present other species of -atoms and -molecules are generated [21, 22]. Therefore corrections were applied to Eqn. 1 to account for the pp formation from the singlet p atoms and the pd formation due to D2 contamination. We assumed that, due to their typically lower energies, the efficiency for detecting neutrons from d/3He capture is significantly smaller than the efficiency for detecting neutrons from proton capture, this making proton capture in pd molecules the dominant correction from D2 contamination.
The determination of was obtained by fitting to the Fig. 2 time spectrum. The fitting function was based on Eqn. 1, but supplemented with corrections accounting for pp formation and D2 contamination. We also included a correction term with disappearance rate to account for photo-nuclear backgrounds. In most fits we fixed the ratio / [8, 9] and rate s-1 [25] at their known values and only varied the overall normalization and rate .
Our benchmark fit (fit A) to all counters and all data-sets, which demonstrates the good agreement between the measured spectrum and the theoretical spectrum, is shown in Fig. 2. This yielded a rate = s-1 with a chi-squared of for a fit range of to s, i.e. beginning beyond the region contaminated by Au/Ag capture.
The results of fits to study the sensitivity to backgrounds and corrections are listed in Table I. It shows that omitting the pp formation correction (fit B) or pd contamination (fit C) correction has little effect ( ) on . Including a 7% carbon background (fit D) changed the rate from s-1 to s-1, a effect, while omitting the photo-nuclear background (fit E) changed the rate from s-1 to s-1, a effect. Other tests indicated that varying the hyperfine ratio / by 5% changed the ortho-para rate by 4%.
Also given in Table I are results from fits to the individual time spectra of the five neutron counters, thus demonstrating the consistency between counters. Similar checks of separate fits to the four different data-sets from the two running periods, which involved some differences in calibrations and settings, yielded results ranging from s-1 to s-1. Lastly, we found no evidence of significant sensitivity to either the start-time or the end-time of the fit.
Several other tests of data integrity were performed. We sub-divided the neutron events into a low energy data-set (typically - MeV) and a high energy data-set (typically - MeV) and found consistent results for . We analyzed the neutron events with energies MeV and found no evidence for a long-lifetime component. Finally, the time spectrum of electron events yielded s and the time spectrum of empty-target neutron events yielded ns, consistent with the known values for the p lifetime [25] and the Cu lifetime [19].
Our final result is s-1 where the first error is statistical and the second error accounts for uncertainties in background determinations, chemistry corrections and / (5%). Our result is somewhat larger (by 1.9 ) than the theoretical estimate s-1 of Bakalov et al. [12] and substantially larger (by 3.1 ) than the earlier measurement s-1 of Bardin et al. [15].
In extracting from capture in liquid H2 the difference between s-1 and s-1 is striking. With the Bardin et al. value s-1 the TRIUMF RMC experiment [23, 24] yields [23, 24], the Saclay OMC experiment [25] yields [25], and the average value of the earlier liquid H2 experiments is [26, 27], with the TRIUMF result being clearly inconsistent with theory. With the new measured value s-1 the TRIUMF RMC experiment yields , the Saclay OMC experiment yields , and the average value of the earlier liquid H2 experiments yields , with the Saclay result being clearly inconsistent with theory.
The inconsistency between the present value for and that measured by Bardin et al. is disconcerting. Note that an important difference between the two experiments is the beam time structure, the earlier work using a pulsed beam while the current work using a continuous beam. The experiments also differed in the total number of 5.2 MeV neutrons, the signal-to-noise for 5.2 MeV neutrons, and the presence in the Bardin et al. experiment of a long-lifetime background. However, we see no obvious explanation for the conflicting results.
Note that one consequence of the different time structures in the two experiments is the typical time between the parent muon and the detected neutron, in the relevant region of the time spectra, is greater in the Bardin et al. experiment than the current experiment. Therefore, at least in principle, it is possible that unconventional -chemistry in liquid hydrogen could manifest itself as different neutron disappearance rates in the two experiments.
In summary, we report a determination of the ortho-para rate from the time spectrum of the 5.2 MeV capture neutrons. Our result s-1 is somewhat larger than the theoretical result of Bakalov et al. [12] and strikingly larger than the only previously published measurement [15]. The new result has dramatic consequences for the determination of the induced pseudoscalar coupling .
We thank the TRIUMF cyclotron staff and TRIUMF target group for the operation of the cyclotron and the target. We also thank the National Science Foundation (USA), Natural Sciences and Engineering Research Council (Canada), and Jeffress Memorial Trust and the William & Mary Endowment for their financial support.
REFERENCES
- [1]
- [2] Present address: SLAC, P.O. Box 20450, Stanford, CA 94309.
- [3] Present address: American Physical Society, One Physics Ellipse, College Park, MD 20740.
- [4] Present address: Indiana University Cyclotron Facility, 2401 Milo B Sampson Lane, Bloomington,IN 47408.
- [5] Present address: University of Illinois at Urbana-Champaign, Urbana, IL, 61801.
- [6] Present address: Radiation Protection Bureau, Health Canada, 775 Brookfield Road, Ottawa, ON, Canada.
- [7] M.L. Goldberger and S.B. Treiman, Phys. Rev. 111, 354 (1958).
- [8] V. Bernard, N. Kaiser and Ulf-G. Meissner, Phys. Rev. D 50, 6899 (1994).
- [9] Harold W. Fearing, Randy Lewis, Nader Mobed, and Stefan Scherer, Phys. Rev. D 56, 1783 (1997).
- [10] T.P. Gorringe and H.W. Fearing, Rev. Mod. Phys. 76, 31 (2004).
- [11] Steven Weinberg, Phys. Rev. Lett. 4, 575 (1960).
- [12] D.D. Bakalov et al., Nucl. Phys. A 384, 302 (1982).
- [13] M.P. Faifman and L.I. Men’shikov, Hyperfine Interactions 118, 187 (1999).
- [14] S.S. Gershtein and A.V. Luchinsky, Phys. of Atomic Nuclei 65, 102 (2002).
- [15] G. Bardin et al., Phys. Lett. B 104, 320 (1981).
- [16] D. Wright et al., Nucl. Instrum. Methods A320, 249 (1992).
- [17] W. Bertl et al., Nucl. Instrum. Methods Phys. Res. A 355, 230 (1995).
- [18] J.R.M. Annand, Nucl. Instrum. and Methods A 262, 371, (1987).
- [19] T. Suzuki, D.F. Measday, and J.P. Roalsvig, Phys. Rev. C 35, 2212 (1987).
- [20] R. Brun et al. GEANT3(1986); CERN report no. DD/EE/84–1 (unpublished).
- [21] I.T. Wang et al. Phys. Rev. 139, B1528 (1965).
- [22] C. Petitjean et al., Muon Catal. Fusion 5/6, 199 (1990/91).
- [23] G. Jonkmans et al., Phys. Rev. Lett. 77, 4512 (1996).
- [24] D. H. Wright, et al., Phys. Rev. C 57, 373 (1998).
- [25] G. Bardin et al., Nucl. Phys. A 352, 365, (1981).
- [26] E. Bleser et al., Phys. Rev. Lett. 8, 288 (1962).
- [27] J. E. Rothberg et al. Phys. Rev. 132, 2664 (1963).
| Cntr. | Fit A. | Fit B | Fit C | Fit D | Fit E |
|---|---|---|---|---|---|
| All | 11.11.7 | 12.21.8 | 11.61.7 | 11.72.0 | 8.01.1 |
| N1 | 7.210.6 | 8.211.1 | 7.710.6 | 7.310.9 | 2.23.9 |
| N2 | 13.85.5 | 15.45.6 | 14.45.5 | 14.86.5 | 8.33.1 |
| N3 | 8.92.1 | 9.92.3 | 9.42.2 | 9.22.3 | 7.11.7 |
| N4 | 14.66.2 | 16.16.7 | 15.16.2 | 15.57.3 | 10.34.1 |
| N5 | 12.23.0 | 13.53.0 | 12.73.0 | 12.93.4 | 10.62.6 |