Photoproduction of -mesons off C and Cu nuclei for photon energies below 1.1 GeV
Abstract
The -meson photoproduction cross sections have been measured on the C and Cu targets for the photon energies between 600 and 1100 MeV to investigate the behavior of the (1535) resonance in a nucleus. The excitation functions of the cross section as well as the angular and momentum distributions of -mesons are in quantitative agreement with the Quantum Molecular Dynamics (QMD) model calculations in which the -meson emission processes other than the (1535) resonance are also incorporated as proposed in the -MAID model. It is shown that the excitation of the (1675) resonance might play an important role for MeV.
, , , , , , , , , , , , , , , , , , , , , , , , , , , , , , , , , , , , , , , , , , ††thanks: Present address: RIKEN, Wako 351-0198, Japan ††thanks: Present address: Japan Cycle Development Institute, Tokaimura 319-1194, Japan ††thanks: Present address: Center for Nuclear Study (CNS), University of Tokyo, Wako 351-0198, Japan ††thanks: Present address: High Energy Accelerator Research Organization (KEK), Tsukuba 305-0801, Japan
The behavior of hadrons in the nuclear medium is one of the most intriguing topics in hadron and nuclear physics. Photon induced reactions are advantageous to producing hadrons deeply inside a nucleus because photons are hardly absorbed. Modifications in appearances may always be observed. Most of them originate simply from the basic effects of the nuclear medium, such as the Fermi motion of nucleons, Pauli blocking of the final state and collisions with nucleons. In addition, an interesting possibility has been proposed; i.e., mass modification arising from partial restoration of chiral symmetry in the nuclear medium [1, 2]. The effects of the mass change of the -meson have been studied in photoproduction on nuclear targets [3, 4] as well as in the hadron reactions [5]. However, mass change of baryons has not been studied well except for the resonance [6].
The (1535) resonance is proposed to be a candidate of the chiral partner of the ground state nucleon, and its resonance energy is expected to shift down by about 100 MeV in the nuclear medium where chiral symmetry is partially restored [2]. The (1535) resonance is known to decay into the channel with a large branching ratio of 30–55% [7], while other nucleon resonances in this energy region hardly decay to the channel. Therefore, the excitation and decay of the (1535) resonance is a dominant feature of photoproduction off the nucleon in the region of photon energies below 1000 MeV [8, 9]. It is, thus, expected that the properties of the (1535) resonance in the nuclear medium can be studied through photoproduction off nuclei.
The measurements of the () reactions have been reported by Röbig-Landau et al. on C, Ca, Nb and Pb for 800 MeV [10], and by Yorita et al. on C, Al and Cu for 1000 MeV [11]. In both measurements, the (1535) resonance is clearly observed in the excitation function, which can be reproduced by a calculation taking into account the basic effects of the nuclear medium with parameters deduced from the total cross section of the reaction. It seems, however, that the success of the interpretation of the (,) reaction with the (1535) resonance alone is partially due to the lack of the quality in the previous data for 800 MeV [11] as well as those of the reaction.
In the last several years, there were essential progresses in experimental and theoretical work on the reaction. For the experimental side, precise measurements for 800 MeV have improved considerably the available data base [12, 13, 14, 15, 16, 17, 18]. This led theoretical analyses to be more reliable for including contributions of all the resonances in this energy region as well as direct production processes. Of particular interest is the fact that both of the analyses performed by Saghai et al. [8] and by Chiang et al. [9] have come to the same conclusion that another resonance, (1650), also contributes in the total cross section of the reaction in such a way that the two resonances interfere destructively.
All these arguments raised the interest to study the behavior of the (1535) resonance again by measuring (,) reactions with improved quality for the photon energies higher than 800 MeV. In this letter, we present the experimental results and compare them with calculations based on the Quantum Molecular Dynamics model (QMD) which is improved so as to include other processes than the (1535) resonance.
The experiment was performed at the Laboratory of Nuclear Science (LNS) in Tohoku University by using tagged photon beams from the 1.2 GeV Stretcher-Booster Ring [19]. Two series of measurements were carried out in different setups: the first one at the photon beam line 1 in the experimental hall 2 and the second at the photon beam line 2 in the GeV- experimental hall. The former tagging system is described in detail in Ref. [20] and a part of data obtained in the first series was reported in Ref. [21]. Photon beams of the same quality can be used at both beam lines. In the present work, the photon energy was covered from 600 to 850 MeV with = 920 MeV and from 800 to 1120 MeV with = 1200 MeV. The total tagged photon intensity was about 107 Hz with a duty factor of about 80%. The size of the beam at the target position was about 6 mm (rms). The targets used were C and Cu with thicknesses of 40 and 5 mm, respectively.
Two photons from an -meson were detected by an electromagnetic calorimeter consisting of 206 pure CsI crystals with plastic veto counters. The shape of the crystal is truncated-trapezoidal with a hexagonal cross section and its thickness is 30 cm for 148 pieces (type-A) and 25 cm for 58 pieces (type-B); the performance of the type-B is described in detail in Ref. [22]. In the first series of the measurements, they were assembled to 6 blocks and placed on three turn tables to change detector positions as reported in Ref. [21]. In the second series, they were rearranged to 4 blocks placed in such a way that two forward blocks covered angles with respect to the beam direction and angles with respect to the horizontal plane and two backward blocks and for both sides of the beam direction. The different arrangements of crystals served to check the acceptance of the detection system.
All the data were collected using a similar data acquisition system as reported in Ref. [11]. In the present work, the main trigger for the data acquisition required at least one signal from the tagging counters and two signals from the CsI detectors. The maximum counting rate of a CsI detector was about 10 kHz and that of a tagging counter was about 200 kHz. The dead time of the data taking was about 8%. A time resolution for - coincidences of 800 ps (FWHM) was achieved and the chance coincidence ratio was about 3%.
The -mesons were identified via their two photon decay with an invariant mass analysis. In Fig. 1, the invariant mass spectrum () measured in the present work is shown by the solid line. Two prominent peaks corresponding to and mesons are clearly seen on the continuum background, which is considered to originate mainly from multi events. We simulated two production process by the Monte Carlo simulation. The result is shown by the dotted line in Fig. 1. The shape is well fitted with an exponential function, exp(). In order to deduce double differential cross sections, , the invariant mass spectrum was constructed for the polar angle from 0∘ to 110∘ by 10∘ steps and for the momentum from 0 to 1100 MeV by 100 MeV steps. The yield of -mesons in each spectrum was deduced by subtracting the background events in the mass region, which were estimated with the function fitted to the continuum for each bin of the incident photon energy and the -meson polar angle and momentum. Absolute cross sections were deduced by taking into the account the thickness of the targets, tagging counter counts, a tagging efficiency, a geometrical acceptance and the branching ratio () [7]. The tagging efficiency was measured with a total absorbing lead glass detector positioned in the direct beam. The geometrical acceptance of the detection system was calculated by the Monte Carlo simulation based on GEANT3 [23]. The systematic uncertainties of the overall normalization come from photon flux (1%), background determination (5%) and the geometrical acceptance (5%). Consequently the overall systematic uncertainty is 7%.
Differential cross sections of the (,) reaction were deduced for the polar angles from 0∘ to 110∘ with respect to the photon beam direction by integrating the double differential cross sections. We show excitation functions of the photoproduction cross section, which were deduced by integrating differential cross sections for 0, on C and Cu targets in Fig. 2(a) and 2(b), respectively. Missing yields for were estimated to be 2% of the integrated values at most, and the total cross section in the present work is the angle integrated one. For comparisons, also plotted are the previously reported data on C indicated with open squares up to 800 MeV [10] and with open circles up to 1000 MeV [11] and on Cu with open circles up to 1000 MeV [11]. It can be said that the present data and the reported ones are in good agreement. Moreover, the statistical accuracy is much improved for the photon energies higher than 800 MeV. The shape of the total cross section for C and Cu is quite similar as expected. The cross section increases rapidly from the threshold energy (561 MeV for C and 550 MeV for Cu), shows a broad bump structure which has the maximum at around 850 MeV, and gradually decreases as the photon energy increases. This trend has been known from the previous investigations [11] to be basically due to the excitation of the (1535) resonance in a nucleus. The present data for C and Cu may serve for detailed comparisons with model calculations.
In Fig. 2(c), ratios of the cross section of Cu to that of C (/) are plotted against the photon energy. One can roughly say that the observed -mesons are mainly emitted from the surface region of the nucleus and those emitted in deeper region are absorbed in the nuclear medium, since the ratios are close to 3.05 (the dotted line), corresponding to the ratio of for Cu to C. However, there exist non-negligible and systematic deviations from the dependence for photon energies larger than 800 MeV; the ratio becomes about 3.5 at about 900 MeV. This requires more careful and detailed analysis.
In order to explain the present data, we have performed a QMD model calculation in a different way from the previous one [11] as follows. At first, the proton and the neutron are treated independently so as to see the effect of the difference of the elementary cross sections for and . This modification is necessary, because rather large difference between the total cross sections of and has been predicted by the unitary isobar model, -MAID [9]. The simple relation ()/() = 2/3, established empirically for 800 MeV [25] and used in the previous model calculations [11, 24], might not be correct at the higher energy region. Secondly, the effect of the interference between two resonances in this energy region, (1535) and (1650), is included in the calculation as the form of the cross section. The reason of this modification is as follows. Saghai et al. [8] and Chiang et al. [9] analyzed the total cross section of the reaction. They came to the same conclusion that the experimentally observed cross section below 1100 MeV is not only due to the (1535) resonance but also due to the (1650), and both resonances make a destructive interference in the cross section of production off the nucleon. In the present QMD calculation, it is impossible to treat directly the transition amplitudes, and, thus, the calculated cross section including a destructive interference term is incorporated instead of an incoherent sum of two single resonances which cannot reproduce the experimental data well.
In Fig. 3, the total cross sections of the (,) reaction are shown in order to explain input quantities to the present QMD calculations. The experimental cross sections of the reaction are shown in Fig. 3(a); data plotted with circles from Ref. [12], triangles from Ref. [16] and squares from Ref. [18]. Also shown are the results of the -MAID calculation, on which we have based for the elementary cross section. The characteristic feature of the experimental data is a broad peak followed by a flat region with a small dip at 1010 MeV. The single resonance excitation can reproduce only the broad resonance shape but fails to reproduce the dip and flat as indicated by the dotted line, which corresponds to the elementary cross section used in our previous analyses [11]. The dashed line is the result of the full -MAID calculation which includes all the resonances in this energy region with direct production processes. As mentioned above, the essential point is the destructive interference of the (1535) and the (1650) resonances, which reproduces the dip and flat behavior very well. Another non-negligible process is the excitation of the (1710) resonance which slightly contributes to the flat region around 1100 MeV. Therefore, we have included three resonance excitations, (1535), (1650), and (1710), and the direct processes in the cross section of the reaction for the QMD calculation. The total cross section of the elementary reaction is calculated practically by summing up the cross sections of the double , the , and the direct processes, although the exact calculation should be the square of sum of the amplitude of each process. The solid line in Fig. 3(a) is the elementary cross section used in the present QMD calculation, being slightly larger than the full calculation of the -MAID.
For the cross section of the reaction, no experimental data have been reported so far. We, again, follow the -MAID calculation as shown in Fig. 3(b). The dashed line corresponds to the full calculation of the -MAID including all the resonances and the direct processes. We select the double resonance, the (1675) resonance as major processes of excitations and the direct processes for the QMD input. The -MAID calculation predicts rather large cross sections through the (1675) resonance excitation, which is essentially prohibited in the reaction by the Moorhouse selection rule [26]. The cross section through the two resonances is calculated with the destructive interference term. It shows a dip at around 1000 MeV as shown by the dot-dashed line in Fig. 3(b), where one sees that the large contribution from the (1675) resonance, which is plotted by the dotted lines, fills the dip and appears like a shoulder of the (1535) resonance. The sum of the cross sections of the selected process, which is employed as the elementary reaction, is plotted by the solid line. The difference from the full calculation is very small as in the case for the reaction.
Having discussed the elementary cross section, we now return to the C(,) and Cu(,) reactions. In Figs. 2(a) and 2(b), the cross sections obtained in the present work are compared with the QMD calculations. As mentioned above, the elementary cross sections of the and reactions are treated independently; they are the solid lines in Fig. 3(a) and Fig. 3(b) for proton and neutron, respectively. The -emission probability through the resonance excitation is calculated according to the Breit-Wigner resonance formula for the (1710) and the (1675) resonances. For the resonance excitation in the present work, however, the cross section including the interference of the two resonances is used as if a resonance of the mixed state which is not described by the single Breit-Wigner formula is excited, and the lifetime and the decay branch of the (1535) resonance is applied to the mixed state. This approximation seems to be allowed, since the -meson is mainly emitted via the (1535) resonance. The resonance parameters in the -MAID are used for each resonance, and are summarized in Table 1.
It should be noticed for the QMD calculations in the present work that the effective energies of the incident channel are calculated for each photon-nucleon collision with a nucleon bound in a mean field potential. The effective energy which results in the reduction of the yield for the threshold region has been discussed [24, 27] and the result of such calculation improves the reproduction of the cross sections below 800 MeV. Thus, we have calculated the effective total energy followed as , where is the effective total energy, is the c.m. energy of the incident photon and a nucleon in the nucleus and is the nucleon potential calculated from the mean field potential in Ref. [28]. As described in Ref. [11], the Fermi motion of nucleons, the Pauli blocking, collisions of nucleon resonances with nucleons and the absorption of the -mesons are taken into account in the calculation.
In Fig. 2(a) and 2(b), the dashed line is the results of the QMD calculation in which only the (1535) resonance is incorporated with the assumption of / = 2/3. This corresponds to the previous calculation in Ref. [11]. For both C(,) and Cu(,) reactions, the calculation reproduces data up to 950 MeV. However, it underestimates the yield for 1000 MeV. The solid line corresponding to the new recipe covers the deficit and reproduces the data well up to 1100 MeV. Contributions of each process are also shown in Fig. 2(a) and 2(b). As can be seen, in addition to the largest contribution of the double resonance indicated by the dotted line 1, the contributions of the (1675) resonance and the direct processes are expected for 900 MeV. The present calculation suggests that more than 18% of the cross section at 1000 MeV originates from other processes than the excitation of the resonance. It is of particular interest that the (1675) resonance plays an important role for higher photon energies, since only neutrons can be excited in a naive quark model. The dot-dashed lines labeled a and b in Fig. 2 correspond to the contributions of protons and of neutrons, respectively. The ratio of the contribution of neutrons to that of protons is nearly 0.67 for C and 0.84 for Cu at 800 MeV, where only the resonance formation process can contribute, and becomes 0.97 for C and 1.23 for Cu at around 1100 MeV due to the existence of the (1675) resonance. The change of the contribution of neutrons to protons may explain the change of the ratio of the total cross section / plotted in Fig. 2(c), where the calculated ratio is also shown by the solid line. The calculation explains the trend of the ratio very well, although it fails for the lowest two points.
The above discussion on Fig. 2 requires at least the following; the elementary cross section of the reaction exceeds that of the for 1000 MeV, due to another process besides the resonance formation. Recently, Kuznetsov et al. reported the and coincidence measurements in the D(,) reaction [29]. Their result that yields of the coincidence events are larger than those of the events at around 1000 MeV is consistent with the present interpretation.
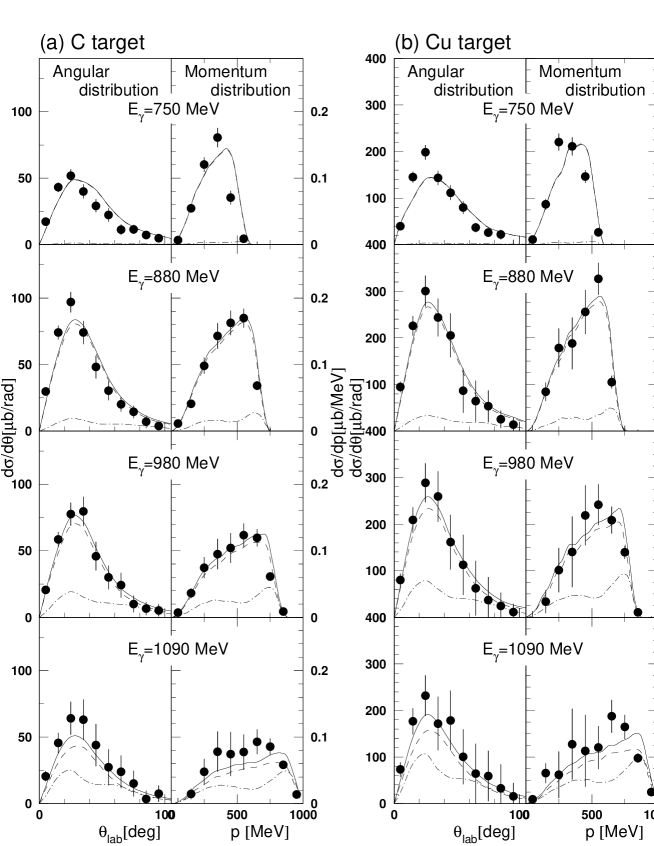
Additional effects that might possibly give rise deviations from the pure resonance formation may be seen in the angular and momentum distributions of the emitted -mesons. They are shown in Fig. 4 for = 750, 880, 980, and 1090 MeV, and compared with the QMD calculations. The results for the C target are shown in Fig. 4(a), and the Cu target in Fig. 4(b). All the angular distribution data show a broad structure peaked at around 30∘. This is a characteristic of the quasi-free -wave production. The solid lines in the figure are the results of the QMD calculation, and the experimental data for both angular and momentum distributions are essentially well reproduced by the corresponding calculations. The dashed lines shows the results without the contribution of the (1675) resonance and the dot-dashed lines correspond to the contribution of the (1675) resonance multiplied by 4. As shown, the contribution of the (1675) resonance has a different structure in these distribution because of the -wave emission. Since the contribution of the (1675) resonance is not large, the present data, unfortunately, cannot give a firm evidence for the excitation of the (1675) resonance in both reactions.
As we have discussed above, the comparison of new data with the QMD model calculations suggests strongly that the cross sections of photoproduction off nuclei contain non-negligible quantities through the process other than the (1535) resonance formation for the photon energies above 850 MeV. Thus, in order to investigate the change of the properties in the nuclear medium such as the mass shift proposed in Ref. [2], one needs precise data of the cross section for the reaction. The present work has shown that the use of the elementary cross sections of -MAID can reproduce the experimental data very well but remains an interesting subject for future investigations.
In summary, the photoproduction cross sections were measured on the C and Cu targets for the photon energies between 600 and 1100 MeV. The excitation functions of the total cross section as well as angular and momentum distributions were in quantitative agreement with the QMD model calculations in which the cross sections proposed in the -MAID model were used for the elementary reactions and . The agreement suggests that there is a difference in the shape of the cross sections between proton and neutron in a nucleus. In order to discuss the change of the properties of the (1535) resonance, the cross section of the reaction experimentally measured is highly desirable to be incorporated in the model calculations.
| N∗ | Mass | Width | |||||
|---|---|---|---|---|---|---|---|
| [MeV] | [MeV] | [%] | [10-3GeV-1/2] | ||||
| (1535) | 1541 | 191 | 50 | +118 | — | 96 | — |
| (1650) | 1638 | 114 | 7.9 | +68 | — | 56 | — |
| (1710) | 1721 | 100 | 26 | +23 | — | 0 | — |
| (1675) | 1665 | 150 | 17 | 0 | 0 | 43 | 58 |
| (1535) | 1542 | 150 | 55 | +102 | — | 83 | — |
References
- [1] T. Hatsuda, S.H. Lee, Phys. Rev. C 46 (1992) 34.
-
[2]
H.C. Kim, D. Jido, M. Oka,
Nucl. Phys. A 640 (1998) 77;
D. Jido, Y. Nemoto, M. Oka, A. Hosaka, Nucl. Phys. A 671 (2000) 471;
D. Jido, T. Hatsuda, T. Kunihiro, Phys. Rev. Lett. 84 (2000) 3252. - [3] G. J. Lolos et al., Phys. Rev. Lett. 80 (1998) 241.
- [4] B. Krusche et al., Phys. Rev. Lett. 86 (2001) 4764.
-
[5]
G. Agakichiev et al.,
Phys. Lett. B 422 (1998) 405;
D. Adamova et al., Phys. Rev. Lett. 91 (2003) 042301. -
[6]
E.L. Hjort et al.,
Phys. Rev. Lett. 79 (1997) 4345;
D. Pelte et al., Z. Phys. A 359 (1997) 55. - [7] S. Eidelman et al., (Particle Data Group), Phys. Lett. B 592 (2004) 1.
- [8] B. Saghai, Z. Li, Eur. Phys. J. A 11 (2001) 217.
-
[9]
G. Knöchlein, D. Drechsel, L. Tiator,
Z. Phys. A 352 (1995) 327;
W.T Chiang, S.N. Yang, L. Tiator, D. Drechsel, Nucl. Phys. A 700 (2002) 429. - [10] M. Röbig-Landau et al., Phys. Lett. B 373 (1996) 45.
-
[11]
T. Yorita et al.,
Phys. Lett. B 476 (2000) 226;
H. Yamazaki et al., Nucl. Phys. A 670 (2000) 202c. - [12] B. Krusche et al., Phys. Rev. Lett. 74 (1995) 3736.
- [13] J. Ajaka et al., Phys. Rev. Lett. 81 (1998) 1797.
- [14] C.S. Armstrong et al., Phys. Rev. D 60 (1999) 052004.
- [15] R. Thompson et al., Phys. Rev. Lett. 86 (2001) 1702.
- [16] F. Renard et al., Phys. Lett. B 528 (2002) 215.
- [17] M. Dugger et al., Phys. Rev. Lett. 89 (2002) 222002.
- [18] V. Credé et al., Phys. Rev. Lett. 94 (2005) 012004.
-
[19]
F. Hinode et al.,
Proceedings of the 2005 Particle Accelerator Conf.,
Knoxville, TN, U.S.A., To be published;
H. Hama et al., Proceedings of the 18th International Conference on High Energy Accelerators (HEACC2001), Tsukuba, March 2001. - [20] H. Yamazaki et al., Nucl. Instr. Meth. A 536 (2005) 70.
-
[21]
H. Yamazaki et al.,
Proceedings of the International Workshop on Physics with GeV Electrons
and Gamma Rays, Sendai, Japan, February, 2001, Universal Academy Press, Inc. pp. 151;
J. Kasagi, Prog. Theo. Phys. Suppl. 149 (2003) 215. -
[22]
H. Okuno et al.,
Nucl. Instr. Meth. A 365 (1995) 352;
H. Yamazaki et al., Nucl. Instr. Meth. A 391 (1997) 427. - [23] CERN Program Library Long Writeup W5013: Geant Detector Description and Simulation Tool, (1993).
- [24] J. Lehr, M. Post, U. Mosel, Phys. Rev. C 68 (2003) 044601.
- [25] B. Krusche et al., Phys. Lett. B 358 (1995) 40.
- [26] R.G. Moorhouse, Phys. Rev. Lett. 16 (1966) 772.
- [27] T. Maruyama, S. Chiba, Prog. Theor. Phys. 111 (2004) 229.
- [28] K. Niita et al., Phys. Rev. C 52 (1995) 2620.
- [29] V. Kuznetsov et al., hep-ex/0409032.