Consequences of energy conservation in relativistic heavy-ion collisions
Abstract
Complete characterization of particle production and emission in relativistic heavy-ion collisions is in general not feasible experimentally. This work demonstrates, however, that the availability of essentially complete pseudorapidity distributions for charged particles allows for a reliable estimate of the average transverse momenta and energy of emitted particles by requiring energy conservation in the process. The results of such an analysis for Au+Au collisions at = 130 and 200 GeV are compared with measurements of mean- and mean- in regions where such measurements are available. The mean- dependence on pseudorapidity for Au+Au collisions at 130 and 200 GeV is given for different collision centralities.
pacs:
25.75.-q, 13.85.Ni, 21.65.+fI Introduction
In recent studies of ultra-relativistic heavy-ion collisions at the Relativistic Heavy-Ion Collider (RHIC) at Brookhaven National Laboratory much attention has been devoted to measurements of particles and radiation emitted in the transverse direction. This focus is well justified because particles emitted in this direction are expected Bjorken to carry information about the region of highest energy density formed in the process, which is believed to consist of de-confined quarks and gluons QGP . Experimental evidence based on Au+Au collisions BRAHMS_WP ; PHOBOS_WP ; STAR_WP ; PHENIX_WP indicates that a phase of matter with extreme energy density is indeed formed in such collisions, the properties of which correspond to an ideal fluid of quarks and gluons.
The present paper is instead focussed on following the total energy in the collision and how it is distributed in the exit channel. It is interesting to note that the number of particles emitted at mid-rapidity increases only slowly as a function of collision energy PHOBOS_PRL88 . The increase in collision energy by more than a factor of one hundred from the CERN SPS facility to RHIC thus result in only doubling of the mid-rapidity particle multiplicity. The bulk of the additional energy is carried off by particles emitted away from this region. Thus, in order to study the energy balance in the reaction it is necessary to measure particles emitted over essentially the full solid angle. The PHOBOS experiment at RHIC PHOBOS_NIM is unique in being close to achieve such coverage for charged particles and nearly complete distributions of charged particles in pseudorapidity space, , have been reported PHOBOS_limfrag . In this work, these and other data are used to show that energy conservation places severe constraints on the transverse momentum distributions away from midrapidity, outside the range where they can be measured. The results are used to calculate the pseudorapidity dependence of the mean transverse momentum, mean transverse energy and an estimate of the initial energy density in the spatial region from which particles with large longitudinal momenta originate.
II Entrance channel
At relativistic energies, it is normally assumed that only a fraction of nucleons, , of the incoming heavy ions take part in the collision. The non-participaring nucleons, the spectators, are assumed to continue unaffected by the collision between the participants and do therefore not contribute to the particle production. For the purpose of the present work, the energy of the spectators will therefore not be included in the energy accounting. At the 130 GeV and 200 GeV collision energies studied here, it is believed that the pseudorapidity distribution of the spectators falls outside the PHOBOS acceptance. On the other hand, it is assumed that all of the energy carried by the participants will appear in the exit channel. In a recent analysis of net baryons in the rapidity range =0-3.2, the BRAHMS collaboration BRAHMS_protons have concluded that they retain 27% of their initial energy, which might lead one to the conclusion that only 73% should appear in the exit channel. It is important, however, to realize that also the partially stopped net baryons are included in the measured (and extrapolated) distribution of charged particles considered in this work as demonstrated in Sect. VII. Consequently, one needs to account for all of the energy of the participants, namely
| (1) |
where is the center-of-mass energy per nucleon pair and is the number of such pairs. The value of is normally calculated in the Glauber model Glauber for collisions at different impact parameters using experimental nucleon-nucleon cross sections. The centrality of heavy-ion collisions is typically given by the fraction of the total cross sections such that the 0-6% centrality bin corresponds to essentially head-on collisions exhausting 6% of the total cross section, the 6-15% centrality bin is associated with the 9% of the cross section with increasing impact parameter, etc.
III Exit channel
Since the analysis is based on measurements of pseudorapidity distributions of charged particles, , one should expect to account for only this fraction of the total energy, i.e.
| (2) |
where is the fraction of exit particles that are charged.
The energy of a particle is , where is the transverse mass, is the rest mass, is the transverse momentum, and is the rapidity of the particle. Using the identity one finds
| (3) |
The total energy of charged particles may be evaluated by summing over pions, kaons, and protons and integrating over the distribution in and
| (4) |
where
| (5) |
and is the relative abundance of particles with mass .
In the Appendix, the effects of computing (Eq. 5) under different assumptions are explored and it is shown that using an average mass is an excellent approximation to an accurate evaluation of the individual contributions from the three particle species with different values. The dependence of on particle mass has been observed experimentally and is normally interpreted as a consequence of radial flow of the hot fireball. In the following, the expression
| (6) |
is therefore used to find those -dependences of that satisfy energy conservation.
IV Input data
The distributions the and corresponding values of were taken from Ref. PHOBOS_limfrag . The data and error bands were fitted to a high accuracy using three Gaussians, one centered at , and two of identical shape centered at using five fit parameters.
IV.1 130 GeV
Measurements by STAR STAR_pt0 ; STAR_pt ; STAR_0311017 have shown that the overall charged particle -distributions near mid-rapidity follow a power-law behavior,
| (7) |
where and are adjustable parameters. The values of and were taken from STAR_0311017 and interpolated to match the centrality bins of the PHOBOS data. In the Appendix it is shown that the total energy in the exit channel is very insensitive to the particle rest mass. This power-law shape of the spectra (in -space) is therefore used for all three particle types (pions, kaons, protons/anti-protons).
The charged particle fraction was estimated using identified particle multiplicities from Refs. STAR_0311017 (pions), STAR_kaons (kaons), and STAR_ppbar (protons/anti-protons) and converting to pseudorapidity space by using the fitted spectral shapes. The results were again interpolated to match the PHOBOS centrality bins.
IV.2 200 GeV
As yet, no analysis of charged hadron -spectra has been published for 200 GeV Au+Au collisions. In this case it is therefore assumed that the centrality dependence of the parameter is identical to that found at 130 GeV. In order to estimate and for unidentified hadrons at this energy, the values of of charged particles were taken from STAR STAR_PRL92 and PHENIX PHENIX_PRC69 , converted to pseudorapidity space using the fitted spectral shapes, interpolated to match PHOBOS centrality bins and averaged (with equal weights). Note that the transformation from rapidity to pseudorapidity space increases the values of to be larger than those obtained directly from the -spectra measured for a fixed rapidity interval.
The charged particle fractions, , were obtained from the same data according to the method used for 130 GeV. All resulting values are listed in Table I.
V Average transverse momentum
In this section it is shown that the requirement of energy conservation and the fact that is experimentally known at imposes severe restrictions on the -distribution of particles emitted at large pseudorapidities.
First, it is shown that a constant (as a function of ) does not conserve energy. By assuming that particles emitted at all values are characterized by = 21.9 and = 0.544 (GeV/c), corresponding to those measured at mid-rapidity for 200 GeV Au+Au collisions at 0-6% centrality, Eq. 6 gives a total energy of = 35,523 GeV, which is substantially larger than the = 21,844 GeV expected in outgoing charged particles on the basis of energy conservation. One must therefore conclude that assumes smaller values (softer -spectra) away from mid-rapidity. In the following, different shapes of the -dependence on are explored. Guided by predictions of theoretical models, such as HIJING HIJING , RQMD RQMD , and AMPT AMPT it is assumed that falls off monotonically away from =0. Only analytical functions which have this property are therefore considered.
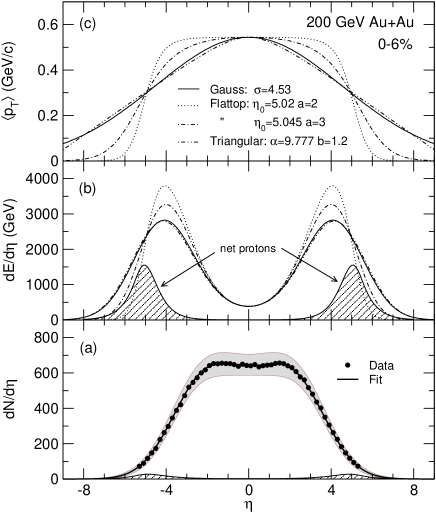
Assuming a Gaussian dependence of and requiring energy conservation allows for a determination of the standard deviation of the Gaussian dependence. The solid curves in Fig. 1 represent a calculation of for 200 GeV central (0-6%) Au+Au assuming
| (8) |
using the parameters = 0.544 GeV/c, =4.53. These parameters result in a total charged particle energy which reproduces the expected value of = 21,844 GeV (obtained from Eq. 2 using parameters listed in Table I).
Although a Gaussian -dependence of the mean transverse momentum probably approximates the actual dependence quite well other dependencies have also been studied. One parametrization is given by
| (9) |
i.e. a flat-top distribution which falls off at over a range of . Since this form contains two adjustable parameters, a family of curves exists that will obey energy conservation as illustrated in Fig. 1 where such curves are shown for (dashed) and (dotted-dashed) for the 200 GeV 0-6% central Au+Au collision data.
Finally, a triangular” shape given by
| (10) |
where controls the slope away from and the radius of curvature at midrapidity is explored. This function does not deviate significantly from the Gaussian when both are required to yield the expected total energy.
It is interesting to note that the four curves shown in Fig. 1c representing different dependences of , all converge at at a value of = 0.312 GeV/c at = 5.05. This value of value may be considered a direct experimental measurement because it is independent of the assumed functional form of the -dependence on .
| =130 GeV | Gaussian | |||||
| Bin | ||||||
| (GeV) | (GeV/c) | |||||
| 0-6% | 34011 | 0.6270.017 | 22.1 | 13857585 | 0.5190.008 | 4.34 |
| 6-15% | 2759 | 0.6270.017 | 20.7 | 11208476 | 0.5160.008 | 4.04 |
| 15-25% | 1968 | 0.6270.020 | 18.5 | 7988414 | 0.5110.008 | 3.68 |
| 25-35% | 1366 | 0.6250.023 | 17.2 | 5525317 | 0.5040.007 | 3.42 |
| 35-44% | 905 | 0.6240.029 | 16.4 | 3650264 | 0.4900.008 | 3.32 |
| 45-55% | 595 | 0.6220.034 | 14.8 | 2385208 | 0.4780.007 | 3.36 |
| =200 GeV | Gaussian | |||||
| Bin | ||||||
| (GeV) | (GeV/c) | |||||
| 0-6% | 34411 | 0.6350.025 | 22.1 | 218441108 | 0.5440.021 | 4.53 |
| 6-15% | 2749 | 0.6360.026 | 20.7 | 17426912 | 0.5380.021 | 4.42 |
| 15-25% | 2008 | 0.6360.027 | 18.5 | 12720742 | 0.5300.021 | 4.21 |
| 25-35% | 1386 | 0.6380.029 | 17.2 | 8804554 | 0.5190.021 | 3.82 |
| 35-45% | 935 | 0.6390.030 | 16.4 | 5943424 | 0.5080.021 | 3.78 |
| 45-55% | 595 | 0.6400.031 | 14.8 | 3776315 | 0.4960.021 | 4.06 |
VI Results
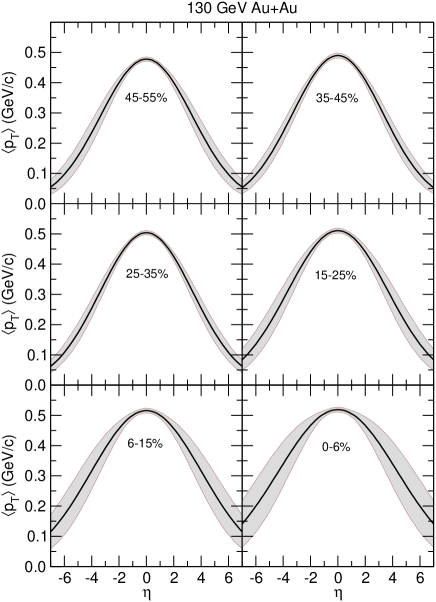
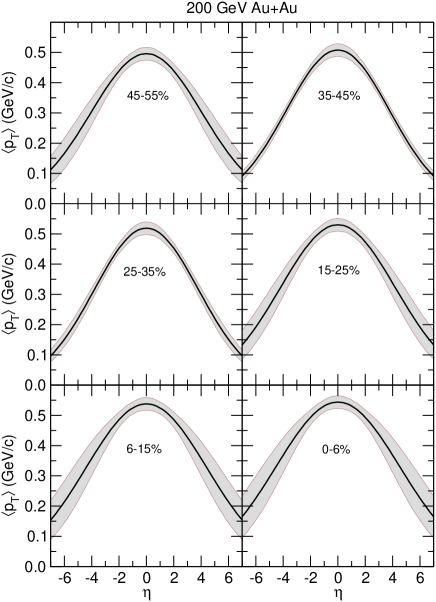
The Gaussian functions, consistent with energy conservation, are shown for 130 and 200 GeV Au+Au collisions in Figs. 2 and 3 for six different centrality bins in each case. The parameters describing these functions are listed in Table I. Based on spectra, measured by BRAHMS BRAHMS_mesons ; BRAHMS_protons over a limited (pseudo)-rapidity range it is believed that the Gaussian shape is realistic.
The error bands were obtained by propagating the errors on the experimental input parameters used in the analysis. These are: and . The uncertainty on the mean of hadrons, , was obtained from Refs. STAR_0311017 ; PHENIX_PRC69 ; STAR_PRL92 . The uncertainty on the total charged particle energy in the exit channel, , has two sources, namely the uncertainty on the charged-particle fraction, , which has been propagated from the measured values of for identified spectra of pions, kaons and protons and converted to the pseudorapidity space using the relevant fit functions. The second term, , was taken directly from Ref. PHOBOS_limfrag , as was the last component . The final error on the functions were computed as a function of pseudorapidity. Clearly, the contribution from dominates near , whereas the errors on and prevail at larger values of . In comparison to the uncertainty on experimental input data, the errors stemming from using an average rest mass of all hadrons ( GeV/c2) are insignificant as demonstrated in the Appendix.
VII Comparison to BRAHMS results
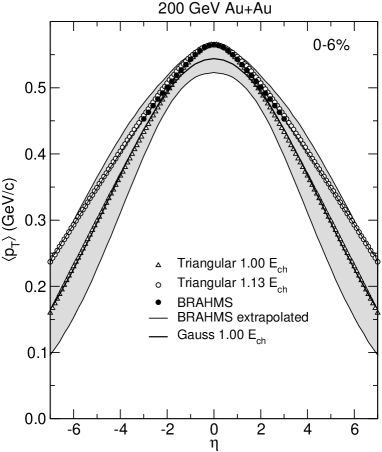
In recent publications, the BRAHMS collaboration has presented transverse momentum spectra and rapidity densities for pions, kaons BRAHMS_mesons and protons/anti-protonsBRAHMS_protons for rapidities ranging from to . It is therefore of interest to compare these data to the results of the present analysis. Using double-gaussian fits to the BRAHMS data on and , and by using the spectral functions (exponential for pions and kaons and Gaussian for protons/anti-protons) for the shape of the -spectra, the values of has been calculated over the full pseudo-rapidity range. The results are shown as solid circles in Fig. 4 in the range where experimental data are available and as a solid curve in the extrapolated region. The BRAHMS data fall within the error band of the present analysis, but lie in the upper range near mid-rapidity. The open circles represent a triangular (=11.2, b=1.2) -dependence, which exceeds energy conservation by 13%, but follows the extrapolated BRAHMS data quite closely. The open triangles achieve energy conservation and are seen to follow the Gaussian shape obtained in the analysis presented in the previous section (note that the slightly higher value at =0 accounts for an insignificant portion of the total energy balance).
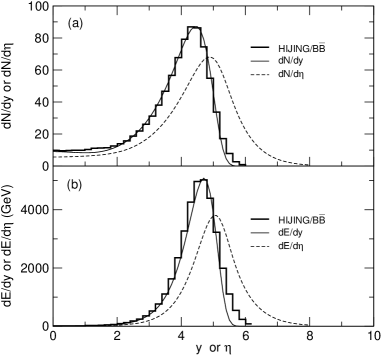
In a recent analysis, the BRAHMS collaboration has found that of the initial energy remains in net baryons after the collisionBRAHMS_protons . In agreement with predictions by the HIJING/B model HIJING_BB2 it is found that the net-protons are emitted in the region , which explains why a relatively small number of particles can account for such a large fraction of the available energy. A simple model which approximates the rapidity distribution of net-baryon predicted by Ref. HIJING_BB2 as
| (11) | |||||
and uses an exponential distribution, with (MeV/c) also accounts well for the predicted HIJING_BB2 rapidity distribution of net-baryon energy per participant, , see Fig. 5. This model also predicts the pseudorapidity distribution of net baryons and their energy shown as dashed curves in Fig. 5. The pseudo-rapidity distributions of net protons and the energy they carry according to this simple model are also shown as shaded regions in Figs. 1a and 1b, respectively. It is evident that the predicted net proton distribution is easily accomodated within the measured distribution. The associated energy appears, however, to exclude a range of dependencies using the flattop function with . Functions with a sharper maximum at , such as the Gaussian or triangular functions studied here, are clearly preferred.
VIII Comparison to theory
The results concerning the dependence on pseudorapidity obtained in the previous section were based almost exclusively on constraints of experimental data; the measured and net proton distributions in pseudo-rapidity space. It is, however, of interest to compare these results to predictions of theoretical models of particle production in relativistic heavy-ion collisions. In a recent work, Topor-Pop et al. HIJING_BB1 have presented the predictions for the transverse energy of the HIJING/B and RQMD RQMD models.
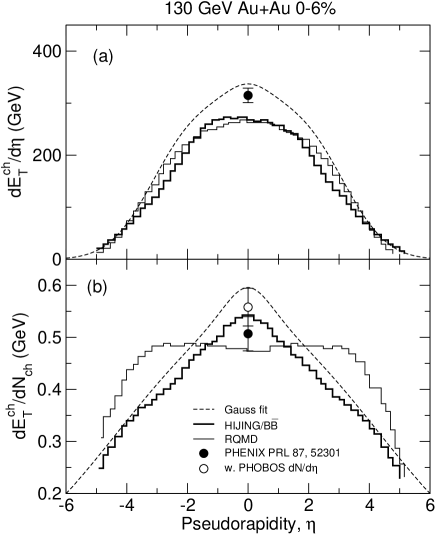
The mean transverse energy of charged particles as a function of pseudorapidity obtained in the present analysis using a Gaussian -dependence of (dashed curve) is in Fig. 6a compared to those predicted by the HIJING/B (thick histogram) and RQMD (thin histogram) models. The overall distribution of transverse energy obtained in the present analysis agrees reasonably well with the model predictions. The value at mid-rapidity exceeds the prediction somewhat, which is also in agreement with the measurement of Ref. PHENIX_Et . The latter has been multiplied by a factor of =0.627 to account for the fact that only charged particles are considered here; the PHENIX experiment refers to both charged and neutral particles. Fig. 6b shows a comparison of the charged particle transverse energy per charged particle, i.e. between the present analysis and the HIJING/B and RQMD predictions. While the RQMD model predicts a rather flat dependence on pseudorapidity, we find that the nearly triangular shape derived from the present analysis is quite well reproduced in the HIJING/B calculations. The closed and open circles in Fig. 6b represent values obtained using the PHENIX PHENIX_dndeta and PHOBOS PHOBOS_limfrag data on , respectively. The latter is in better agreement with the present analysis (dashed curve), which is based on the experimentally derived value of listed in Table I.
IX Energy density
A crucial prerequisite for achieving the quark-gluon plasma phase is the initial energy density produced in the collision. Based on lattice QCD calculations Karsch it is estimated that the transition to this phase occurs at an energy density of 0.7-1.0 (GeV/fm3). Different estimates of the maximum energy density reached in central Au+Au collisions at RHIC energies PHENIX_Et ; PHOBOS_WP all indicate that the predicted threshold value of in these collisions is exceeded by a large factor dependent on the assumed value of the equilibration time , for which a conservative value of = 1 (fm/c) is often used. Estimates of the energy density are normally based on the Bjorken prescription Bjorken applied to particles emitted near mid-rapidity that probe the highest energy density of the fireball. It is, however, also of interest to use the same prescription to study how the energy density falls off away from the central region. Since the longitudinal position of a particle at the time is related to its rapidity by one can study the initial energy density felt by particles as a function of rapidity, and therefore, pseudorapidity. Starting from the normal Bjorken estimate
| (12) |
where is the overlap area of the two nuclei, one may write
by transforming into -space.
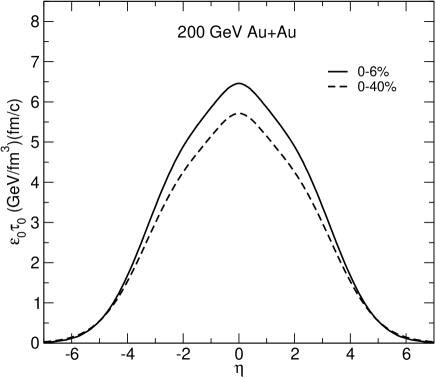
The result is illustrated in Fig. 7 for 200 GeV Au+Au collisions at 0-6% (solid curve) and 0-40% (dashed curve) centrality. The quantity is seen to be sharply peaked at mid-rapidity and falling off rapidly for larger values of . Note that this result is about 25% larger than obtained in other works. The reason is that the overlap area, , for 0-6% is actually 25 % smaller than for a head-on collision, which has often been used. As a similar behavior has been seen in the pseudo-rapidity dependence of the elliptical flow signal, , PHOBOS_flow measured for 0-40% centrality. It is reasonable to assume that the ideal liquid behavior observed at mid-rapidity via the strong flow signal is associated with the high energy density in this region. Consequently, it is tempting to speculate that there is a direct relation between the -dependence of and that of the energy density . In this context it is noteworthy that purely hydrodynamical models Kolb have had difficulty reproducing the observed pseudorapidity dependence of , although recent work buda-lund appears to have been more successful.
X Conclusions
By requiring energy conservation in ultra-relativistic heavy-ion collisions it has been shown that unique information about the average transverse momentum of charged particles emitted in such collisions can be obtained in regions of phase space, where direct experimental measurements are not available, and, indeed, are virtually impossible. Based on measurements over a limited rapidity region to by the BRAHMS collaboration, it is believed that a Gaussian dependence is quite accurate. Under this assumption, predictions for are given for collisions at =130 and 200 GeV as a function of centrality. In a recent analysis of the net-proton abundance away from mid-rapidity by the BRAHMS collaboration BRAHMS_mesons it is concluded that only about 73% of the available collision energy leads to particle production, with the remaining energy being carried away by net baryons leaving the collision with near beam rapidity. Based on predictions of the HIJING/B model the present analysis shows that these particles are included in the measured -distributions. Thus, the full energy of the participating nucleons is needed to account for the observed charged-particle multiplicity. Based on the Bjorken prescription, the pseudorapidity dependence of the energy density has been derived assuming an -independent equilibration time, . For 200 GeV central (0-6%) Au+Au collisions the mid-rapidity energy density peaks at (GeV/fm3), but falls off rapidly away from midrapidity. It is suggested that this mid-rapidity peaking of the energy density may be related to the observed elliptical flow signal, which exhibit a similar pseudorapidity dependence.
XI Acknowledgements
This work was supported by the U.S.Department of Energy, Office of Nuclear Physics, under contract No. W-31-109-ENG-38.
XII appendix
It is convenient to factorize the distribution such that
| (14) |
Furthermore it is assumed that the relative abundance of pions, kaons, and protons/anti-protons is fixed as a function of pseudo-rapidity, i.e.
| (15) |
Under this assumption we may write
| (16) |
which is well supported by recent measurements of the identified particle distributions over a wide range of rapidity BRAHMS_protons ; BRAHMS_mesons . As illustrated in Fig. 7a, it is, however, clear that dependence on the rest mass of the particle is important only in the mid-rapidity region, which contributes only a relatively little to the total energy.
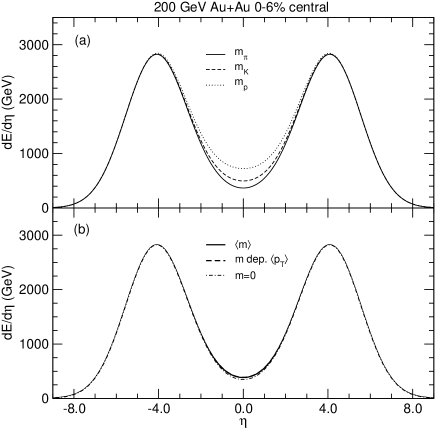
The present analysis is based on the expression given in Eq. 6, which furthermore assumes that the average of distributions is well approximated by a single distribution substituting the average particle mass, obtained from the relative abundance of pions, kaons, and protons/anti-protons. The fact that this is an accurate approximation is demonstrated in Fig. 7b, where the solid curve was obtained under this assumption. It is seen to coincide with the dashed curve representing a calculation using the expression of Eq. 5 with individual values of the particle mass and mean transverse momentum of =0.488 GeV/c, =0.777 GeV/c, and =1.126 GeV/c, which were obtained from converting the values PHENIX_PRC69 measured in rapidity space to pseudo-rapidity. The success of this approximation is caused partly because of the relatively small abundance of kaons and protons, which is however known experimentally in the mid-rapidity region, where the total particle energy is dependent on the rest mass. At larger pseudorapidities, which account for the bulk of the energy, the results are insensitive to the particle masses.
References
- (1) J. D. Bjorken, Phys. Rev. D 27, 140 (1983)
- (2) J. C. Collins and M. J. Perry, Phys. Rev. Lett. 34, 1353 (1975); E. V. Shuryak, Phys. Rep. 61, 71 (1980); D. J. Gros, R. D. Pisarski, and L. G. Yaffe, Rev. Mod. Phys. 53, 43 (1981)
- (3) I, Arsene et al. (BRAHMS), Nucl. Phys. A757, 1 (2005)
- (4) B. B. Back et al. (PHOBOS), Nucl. Phys. A757, 28 (2005)
- (5) J. Adams et al. (STAR), Nucl. Phys. A757, 102(2005)
- (6) K. Adcox et al. (PHENIX), Nucl. Phys. A757, 184 (2005)
- (7) B. B. Back et al. (PHOBOS), Phys. Rev. Lett. 88, 022302 (2002)
- (8) B. B. Back et al. (PHOBOS), Nucl. Phys. A499, 603 (2003)
- (9) B. B. Back et al. (PHOBOS), Phys. Rev. Lett. 91, 052303
- (10) I. G. Bearden et al. (BRAHMS), Phys. Rev. Lett. 93, 102301 (2004)
- (11) R. J. Glauber, in Lect. in Theor. Phys., ed. W. E. Brittin and L. G. Dunham, Interscience, New York 1959, Vol. 1, p. 315.
- (12) C. Adler et al. (STAR), Phys. Rev. Lett. 87, 112303 (2001)
- (13) C. Adler et al. (STAR), Phys. Rev. Lett. 89, 202301 (2002)
- (14) J. Adams et al. (STAR), nucl-ex/0311017
- (15) C. Adler et al. (STAR, Phys. Lett. B595, 143 (2004)
- (16) J. Adams et al. (STAR), Phys. Rev. Lett. 70, 041901 (2004)
- (17) J. Adams et al. (STAR), Phys. Rev. Lett. 92, 112301 (2004)
- (18) S. S. Adler et al. (PHENIX), Phys. Rev. C69, 34909 (2003)
- (19) X. N. Wang and M. Gyulassi, Phys. Rev. D 44, 3501 (1992); M. Gyulassi and X. N. Wang, Comp. Phys. Comm. 83, 307 (1994); X. N. Wang, Phys. Rep. 280, 287 (1997; Nucl. Phys. A661, 609c (1999).
- (20) H. Sorge, Phys. Rev. C 52, 3291 (1995); Z. Phys. C67, 47 (1995); M. Berenguer, H. Sorge, and W. Greiner, Phys. Lett. B 332, 15 (1004).
- (21) B. Zhang et al, Phys. Rev. C 61, 067901 (2000)
- (22) I. G. Bearden et al. (BRAHMS), Phys. Rev. Lett. 94, 162301 (2005)
- (23) V. Topor Pop et al., Phys. Rev. C. 70, 064906 (2004)
- (24) V. Topor Pop et al., Phys. Rev. C. 68, 054902 (2003)
- (25) K. Adcox et al., Phys. Rev. Lett. 87, 052301 (2001)
- (26) K. Adcox et al., Phys. Rev. Lett. 86, 3500 (2001)
- (27) F. Karsch, J. Phys. G 30, S887 (2004)
- (28) B. B. Back et al. (PHOBOS), Phys. Rev. Lett. 94, 122303 (2005)
- (29) P. F. Kolb and U. W. Heinz, ”Quark Gluon Plasma 3”, eds. R. C. Hwa and X. N. Wang, World Scientific, Singapore, 2003, p. 634-714
- (30) M. Csanád, T. Csörgő, B. Lörstad, A. Ster, J. Phys. G30 (2004) S1079-S1082