STUDY OF HEAVY ION INDUCED FISSION FRAGMENT ANGULAR AND MASS DISTRIBUTION AT NEAR AND SUB-COULOMB BARRIER ENERGIES
STUDY OF HEAVY ION INDUCED FISSION FRAGMENT ANGULAR AND MASS DISTRIBUTION AT NEAR AND SUB-COULOMB BARRIER ENERGIES
A THESIS SUBMITTED TO THE
JADAVPUR UNIVERSITY
FOR THE DEGREE OF
DOCTOR OF PHILOSOPHY IN SCIENCE
(PHYSICS)
By
TILAK KUMAR GHOSH
SAHA INSTITUTE OF NUCLEAR PHYSICS,
KOLKATA 700 064, INDIA.
June, 2005
CERTIFICATE
This is to certify that the thesis entitled Study of heavy ion induced fission fragment angular and mass distribution at near and sub-coulomb barrier energies submitted by Sri Tilak Kumar Ghosh who got his name registered on 31.01.03 for the award of Ph.D.(Science) degree of Jadavpur University, is absolutely based upon his own research work under the supervision of Prof. Pratap Bhattacharya, Saha Institute of Nuclear Physics, Kolkata, and that neither this thesis nor any part of it has been submitted for any degree/diploma or any other academic award anywhere before.
To my sister-in-law
Rekha Ghosh
for her motherly love, affection and inspiration
Acknowledgments
Just after finishing my Post M.Sc course when I had opted for the experimental nuclear physics as my subject of research, I was advised that one experimentalist should learn at least few things first: cooking, driving, spending sleepless night and ….., let it be secret, but it seemed to me that doing experiment is a fun. Now after spending more than five years when I am in the juncture of a major step toward my research carrier, I believe that choosing this field of research has allowed me to get to be acquainted with some outstanding feelings of life and existence.
With gleeful heart I at the very outset offer my sincerest regard to my thesis supervisor, Prof. Pratap Bhattacharya who has allowed me to work independently and I have been blessed with his guidance whenever needed. This work couldn’t be flourished without his enormous support. The close association of his family member made my tenure enjoyable here. While Puchi was a great critique (which turns out to be the words of appreciation after going out to ice-cream parlor with her!) of mine, Radha-di (Prof. Radha Bhattacharya) was always caring. I am obliged to them.
With deep respect I remember the inspiration of Dr. Nanda Dasgupta and Prof Bhupal Chandra Samanta who taught me Nuclear Physics at the Burdwan University. I remember the encouragement of Nanda-madam who motivated me to join in research. I reagrdfully acknowledge her best wishes for my research carrier.
All the experimental work of this thesis was carried out using the 15 UD Pelletron of the Nuclear Science Centre (NSC), New Delhi. I thank the Accelerator User Committee for providing me a beam time account. Dr. S.K. Datta, who was my local collaborator at NSC, always extended his helping hand during our experiments. I am grateful to him. I am particularly obliged to Dr. Ranjan Bhowmik not only for his valuable and expert comment during the experiment but also for many illuminating discussions with him prior to and following the experiments. Dr. Amit Roy, Director of Nuclear Science Centre showed interest in our work and I am thankful to him for sanctioning me from Director’s quota an extra beam time which was quite useful to finish this thesis work. I am also thankful to all the operating staff members of NSC Pelletron, especially to Abhijit Sarkar for delivering good quality of pulsed beam ; Mr Debashis Sen for his scientific coordination in the official side , Avilash for helping target preparation and Bivash who helped a lot during one of my initial experiments.I would like to acknowledge Ms. K.S.Golda, my collaborator at NSC, whose immense help at every step was more than responsibility.
I am thankful to all my collaborators from Saha Institute of Nuclear Physics, Prof. S. Chattopadhayay, Dr. N. Majumdar, Dr. T. Sinha and Mr. S. Pal. Thanks are due to Dr Manoj Sharan who took part one of the initial experiments at NSC. I acknowledge the help of Mr. Dipankar Das and Mrs Lipy Paul during the design and fabrication of the gas detectors.
I would like to express my gratitude to my collaborators Dr D.C.Biswas, Dr. A.Saxena, Mr. P.K.Sahu of Bhaba Atomic Research Centre, Mumbai for their sincere involvement in the experiments. I would also thank Dr L.M.Pant and Mr. R.G.Thomas who took part in one of the preliminary experiment at TIFR Pelletron.
I am indebted to Prof. B.C. Sinha, the Director of Saha Institute of Nuclear Physics for extending the different facilities to work in the institute. In this context I don’t want to lose the opportunity to express my deepest gratitude to Prof Prasanta Sen, whose interest about my research work, despite his busy schedule of work, encouraged a lot to me.
Special gratefulness is expressed to the staff of the workshop for their support, which helped a lot for the successful completion of this work. Thanks are due to the library staff of our institute.
I consider myself lucky to met many people whom I consider as fountain of knowledge, during the course of my thesis work. Discussions with Prof Binayak Dutta Roy (BDR-sir), one of the best teachers I saw in my student life, were always enjoyable and not necessarily restricted within the classroom or laboratory. He illustrated me the magnificence to resolve problem from the very first principle. I deeply appreciate help of Prof Susanta Dattagupta, Director of S. N. Bose National Centre for Basic Science, for understanding basic ideas of nuclear dissipation. I am indebted to Dr. R. K. Choudhury, Director of Institute of Physics, Bhubaneswar for his keen interest in our work and suggestions regarding the work.
I am grateful to all my friends who supported and inspired me during the awful phases of my life and shared joy and happiness during the good times. Immediately I remember to my friend Mishreyee who deserves special mention. Dr Dipak Goswami, one of my best friends from College days, has always extended a constant support and encouragement. I also cherish to share the hostel room with Sanjib (popularly name as Maji) during my Post M.Sc. days. My sincere thankfulness should be recorded to Shakti-da, Suresh-da and Madhu-da of the hostel canteen, for their care that made my hostel life homely. My thanks also to all my well-wishers, who have given their generous help and made my stay at Kolkata enjoyable.
Finally my boundless gratitude are due to my mother and family members
for their love and care and constant support without which I could not reach
this stage.
Tilak Kumar Ghosh
List of publication
Published and communicated in journals
11footnotetext: * Indicates papers included in this
thesis.
- *[1]
-
Anomalous increase in width of fission fragment mass distribution in 19F+232Th.
T. K. Ghosh, S. Pal, T.Sinha, N. Majumdar, S. Chattopadhyay, P. Bhattacharya, A. Saxena, P. K. Sahu, K.S. Golda and S. K. Datta.
Phys. Rev. C69, (2004) 031603. (Rapid Communication). - *[2]
-
Anomalous increase in width of fission fragment mass distribution as a probe for onset of quasi fission reactions in deformed target-projectile system at near and sub-barrier energies.
T. K. Ghosh, S. Pal, T.Sinha, S. Chattopadhyay, P. Bhattacharya, D.C. Biswas and K.S. Golda.
Phys. Rev. C70, (2004) 011604. (Rapid Communication). - *[3]
-
Time of Flight (TOF) spectrometer for accurate measurement of mass and angular distribution of fission fragments in heavy ion induced fission reaction.
T. K. Ghosh, S. Pal, T.Sinha, S. Chattopadhyay and P. Bhattacharya.
Nucl. Instrum. Phys. Res. B540, (2005) 285. - *[4]
-
Evidence of microscopic effects in fragment mass distribution in fusion-fission reactions of light projectiles with heavy targets .
T. K. Ghosh, S. Pal, P. Bhattacharya and K.G. Golda.
Accepted for publication in Phys. Lett. B. (nucl-ex/0502013). - *[5]
-
Comment on ”Fission mass widths in 19F + 232Th, 16O + 235,238U reactions at near barrier energies”.
T. K. Ghosh and P. Bhattacharya
Submitted to Phys. Rev. C. (nucl-ex/0505019). - [6]
-
Observation of antimagnetic rotation in 108Cd .
P. Datta, S. Chattopadhyay, S. Bhattacharya, T. K. Ghosh, A. Goswami, S. Pal, M. Saha Sarkar, H. C. Jain, P. K. Joshi ,R. K. Bhowmik, R. Kumar, N. Madhaban, S.Muralithar, M. Rao, and R. P. Singh
Phys. Rev. C71, 041305 (2005) (Rapid Communication). - [7]
-
Observation of magnetic rotation in odd-odd 104Ag.
P. Datta , S. Chattopadhyay, P. Banerjee, S. Bhattacharya, B. Dasmahapatra, T. K. Ghosh, A. Goswami, S. Pal, M. SahaSarkar, S. Sen , H.C. Jain, P.K. Joshi, Amita
Phys. Rev. C 69, 044317 (2004). - [8]
-
Possible coexistence of principal and tilted axis rotation in 103Ag.
P. Datta, S. Chattopadhyay, P. Banerjee, S. Bhattacharya, J. Chatterjee, B. Dasmahapatra,C. C. Dey, T. K. Ghosh, A. Goswami, S. Pal, I. Ray, M. Saha Sarkar, S. Sen, H. C. Jain, P. K. Joshi , Amita
Phys. Rev. C 67,014325 (2003).
Conference Proceedings:
- *[1]
-
Performance characteristics of a MWPC detector for time of flight measurement
T.K. Ghosh, T. Sinha, N. Majumdar, S. Chattopadhyay, P. Bhattacharya, D.C. Biswas, L.M. Pant, A. Saxena and R.K. Choudhury
Proc. Int. Nucl. Phys. Symp. (Mumbai, India) 43B (2000) 486. - *[2]
-
Mass distribution study of 16O + 209Bi
T.K. Ghosh, S. Pal, N. Majumdar, D.C. Biswas, S. Chattopadhyay, M.K. Sharan, S. Mukhopadhyay, S.K. Datta and P. Bhattacharya
Proc. of DAE. Symp. (Tirunelvelli, India) 45B (2002) 166. - *[3]
-
Near barrier fragment mass and angular distribution in 19F + 209Bi
T.K. Ghosh, S. Pal, N. Majumdar, S. Chattopadhyay,S. Mukhopadhyay, P. Bhattacharya,P.K. Sahu, A. Saxena, K.S. Golda and S.K. Datta
Proc Int. Nucl. Phys. Symp. (Mumbai, India) 46B (2003). - [4]
-
Multi-particle response of a Cathode Pad Chamber (CPC)
P. Bhattacharya, S. Bose, S. Chattopadhyay, D. Das, P. Datta, T.K. Ghosh, N. Majumdar, S. Mukhopadhyay, S. Pal, L. Paul, P. Roy, A. Sanyal, S. Sarkar, P. Sen, M. Sharan, S.K. Sen, T. Sinha and B.C. Sinha
Proc Int. Nucl. Phys. Symp.(Mumbai, India) 43B(2000) 504. - [5]
-
Design and fabrication of an ultra-thin Cathode Pad Chamber (CPC)
P. Bhattacharya, S. Bose, S. Chattopadhyay, D. Das, P. Datta, T.K. Ghosh, N. Majumdar, S. Mukhopadhyay, S. Pal, L. Paul, P. Roy, A. Sanyal, S. Sarkar, P. Sen, M. Sharan, S.K. Sen, T. Sinha and B.C. Sinha
Proc. Int. Nucl. Phys. Symp.(Mumbai, India) 43B(2000) 506. - [6]
-
Simulation studies on the spatial resolution and reconstruction efficiency of cathode pad chamber (CPC)
P. Bhattacharya, S. Bose, S. Chattopadhyay, D. Das, P. Datta, T. Ghosh, N. Majumdar, S. Mukhopadhyay, S. Pal, L. Paul, P. Roy, A. Sanyal, S. Sarkar, P. Sen, S. Sen, M.K. Sharan and B.C. Sinha
Proc. DAE-BRNS Symp. Nucl. Phys. 44B(2001) 308. - [7]
-
Numerical simulation of gas detectors
S Pal, P. Datta, T.K. Ghosh, S. Mukhopadhyay
Proc Int. Nucl. Phys. Symp. 45B (2002) 456. - [8]
-
Study of the characteristics of Cathode Pad Chambers with new generation of MANAS 1.2-3.1
P. Bhattacharya, S. Bose, S. Chattopadhyay, D. Das, P. Datta, T. Ghosh, N. Majumdar, S. Mukhopadhyay, S. Pal, L. Paul, P. Roy, A. Sanyal, S. Sarkar, P. Sen, S. Sen, M. Sharan and B. Sinha
Proc. DAE-BRNS Symp. Nucl. Phys.45B(2002) 484.
Summary
The thesis presents investigations on the angular and mass distribution of fission fragments on heavy ion induced fission reactions. The present investigations address current issues in heavy ion induced fission reactions. For the last few years, the focus on the research in this field was on the formation of compound nucleus close and below the Coulomb barrier, as such studies have a direct bearing on the synthesis of super heavy nuclei, an island of stable or quasi-stable nuclei far from the beta stability line far out in neutron and proton numbers from the known trans- uranium elements. Since the principal decay mode of the super heavy nuclei would be fission reaction, the studies of the competition between the fusion and fission and the factors hindering the yields of super heavy elements are intensely followed.
One of the findings in the nineties in this field was the anomalous angular anisotropy observed in the near and sub-Coulomb barrier energies, particularly in reactions of heavy ions on heavy, deformed, actinide nuclei. The explanation of the anomaly was in terms of fission from a non-equilibrated compound nucleus or alternately, a quasi-fission mechanism signaling a possible hindrance to the production of super heavy nuclei.
The present investigations were carried out to measure precisely the distribution of fragment mass in the same reactions, which showed departure from production of an equilibrated compound nucleus. We have used a double arm time-of flight spectrometer over a long flight path to measure the precise masses of complementary fission fragments. Necessary large area position sensitive gas detectors, the method of experiments and data analysis were developed for measurement of angular distribution and mass distribution of fission fragments, exclusively for events in which the incoming projectile momentum was fully transferred to the fissioning composite or compound nucleus. The experiments were done using pulsed heavy ions from the 15UD Pelletron at the Nuclear Science Centre, New Delhi.
The first string of measurements were for a spherical target, 209Bi, with oxygen and fluorine projectiles. The angular distribution measurements in the same experiments supplemented the existing angular anisotropy measurements to establish beyond doubt the systems scrupulously followed the predictions based on the macroscopic theories of the production of equilibrated compound nucleus. The mass distributions were symmetric around the average of the target and projectile mass, and the width of mass distribution varied smoothly with the beam energy, fully conforming to a statistical binary split of the compound nucleus.
The next series of experiments were done using a deformed target of 232Th and projectiles of carbon, oxygen and fluorine. The angular anisotropy data existing in these systems showed an anomalous increase of the anisotropy as the beam energy decreased through the Coulomb barrier. The mass distributions were measured for these systems. In case of all the systems with deformed target, at all energies, the mass distributions were symmetric, peaked around the average of the target and projectile masses, as in the case of systems with spherical target, viz, . However, the width of the mass distribution, , showed completely anomalous behaviour. For 19F + , the decreased monotonically as the energy is decreased, but near the Coulomb barrier, value of started to rise and reached a value which is more than 150 of the extrapolated value at that energy. Thereafter, value again started to decrease. Exactly similar trend of the values were observed for oxygen and carbon projectile, although the sharp increase of values progressively got smaller for oxygen and carbon projectiles.
The close similarity of the trends of the fragment angular anisotropy and the width of mass distributions immediately suggested a common explanation of the observed anomalous rise in both the observable for deformed target and the same energy regions. A review of the possible explanations of anomalous anisotropies, in terms of a pre-equilibrium model and orientation dependent quasi-fission prompted the probability of the latter explanation being applicable to explain the observed anomalous rise of the values with decreasing energy.
In orientation dependent quasi-fission formalism, it has been postulated that due to microscopic effects of the relative elongated configuration of the projectile fusion with the deformed target through the polar region, the fusion barriers are lowered and simultaneously, the system prefers to reach directly a saddle shape (which may be mass asymmetric) in a quasi-fission reaction, in contrast to the initial compact configuration leading preferentially to a formation of compound nucleus when the projectile hits the equatorial region of the deformed target. Hence, it was conjectured that up to a critical angle on the relative orientation of the symmetry axis of target with respect to the projectile trajectory, normal compound nuclear fission and the quasi fission mechanisms can be mixed. With cross section weighted admixture of the two fission modes, the observed anomalous rise in could be phenomenologically explained for all the systems.
In last few years, considerable progress has been achieved in
numerical simulation to calculate the path followed by fusing nuclei,
through a multidimensional energy landscape. The present investigations
show a possible scenario in the paths followed by the systems for a deformed
target projectile combination . In addition to the normal fusion over a
barrier, followed by fission over a unconditional mass symmetric fission
barrier, the system can hit a ridge for certain orientations, when the
normal route is blocked, and transit to fission over a conditional saddle
with zero or small mass asymmetry in a quasi fission mechanism. The present
investigations re-emphasize the need of dynamical calculations of fusion paths
of ions in a dissipative medium.
Outline of the thesis:
The work to be presented in this thesis is divided into five chapters with a appendix. Chapter 1 gives an overview of the subject, briefly mentioning the investigations of fission fragment mass and angular distribution study reported by other experimental groups. Necessity to introduce a new probe to study the fusion-fission dynamics, which is the main motivation of this work has been discussed in this very first chapter of the thesis. Chapter 2 deals with design and fabrication of a large area multi-wire proportional counter that was developed in our laboratory at Saha Institute of Nuclear Physics. Chapter 3 describe the details of the experimental technique and the data analysis procedure. Different methods to determine the mass distributions of fission fragments are compared and the performance of a dual time of flight (TOF) spectrometer using the two position sensitive MWPCs used by us are discussed. In Chapter 4, the results of the measurements of mass distributions for both spherical and deformed targets are presented.Chapter 5 is devoted for the discussions on the findings of this thesis work. Conclusion of the thesis work is given at the end of this chapter. Some details of the formulations of angular and mass distributions are derived at the appendix. Cumulative references are given at the end of the each chapter.
Chapter 1 Introduction
Nuclear fission was discovered sixty five years ago in which a heavy nucleus breaks up into two nuclei. The general features of fission reactions were well understood both experimentally and theoretically, still it continues to throw up new challenges from time to time consistently in last six decades. The reason for that is the involvement of a very large number of nucleons and the macroscopic and microscopic forces that influence the fission phenomena.
The macroscopic forces largely determines the gross features of the fission phenomena. Liquid drop model of Bohr and Wheeler [1] explained fission, particularly tunneling of the fragments through a fission barrier in spontaneous or low energy fission reactions. Subsequently, the inclusion of shell effects [2] defined the finer effects of modulating the fission barrier as function of nuclear deformations and modifying the mass and kinetic energy distributions in the fission fragments.
New observables were introduced as the experimental techniques advanced. Fission isomers, super-deformed shapes, pre-scission particle emission and fission times scales were introduced in neutron, light and heavy ion induced fission reaction studies. As the excitation energy and the angular momentum brought-in, in the heavy ion induced fission reaction, interest was renewed in the fission studies as the new probes of the distributions of the fragments with respect to the angle, in and out of plane of the reaction plane, total kinetic energy, mass, and the number and time of emissions of neutrons or charged particles. For the first time the probes presented the opportunity of studying the dynamics of the fission reactions. In other words, definite clues could be found about the entire history of the fission of two accelerated ions to a composite system and resepartion into two fragments with damping of radical motions and alterations in mass and excitations compared to the initial reactants.
The first insight into the dynamics of fission reaction was the observation that the reaction proceeds with complete oblivion of the initial experimental parameters of the mass and kinetic energies of the reactants, the target and projectile. It was observed that the angular distribution of the fission fragments do not follow the expected behaviour observed in reactions where the ejectiles are formed in one step, direct reactions. A statistical theory of fission [3] based on the equilibrium properties of a hot, rotating nuclei successfully explained the observed ratio of yields of fission fragments, parallel and perpendicular to the beam axis. A very large number of experimental reports fully complied with the picture that fission takes place from a fully equilibrated compound nucleus undergoing shape changes to reach a saddle configuration following statistical rules, and undergo fission. Hence the first step in the heavy ion induced fission is clearly established - the target and projectile fuse together and then the composite system equilibrates before fission takes place. The damping of the incoming radial motion relaxes the excitation energies by inducing spinning of the composite system and also a statistical evaporation of particles (mostly neutron). Hence the average number of particles and their energy defined a time scale of the equilibration of the compound nucleus. A fission time scales of a few tens of sec was inferred for the systematics of neutron evaporation before scission occurs.
The main feature of the fusion-fission reactions of the compound nuclear fission was established, but by early nineties, it became quite apparent that considerable departures were possible and new reaction paths or mechanism were needed to explain anomalous properties in fission observables. As the total angular momentum of the rotating CN increased, the fission barrier began to drop and ultimately reached zero where the compound nucleus was spontaneously unstable against fission. Such prompt fission reaction was called fast fission [4]. The angular distributions of the fragments were forward peaked and the mass distributions were extremely wide. However, the mechanism did not point to any basic change of the reaction dynamics but a mere breakdown of the compound nucleus before it had chance of formation.
In energies intermediate between the Coulomb barrier and the onset of fast fission, and systems which are mass symmetric, it was increasingly becoming evident that mass distributions are transforming from symmetric shape peaking around average of target and projectile masses, to that of an asymmetric mass distribution. It was appropriate that such processes were named as ”quasi-fission” as it is apparent that the systems are not proceeding along the fusion-fission path and following an entirely different path. This is an important new clue about the dynamics of the heavy ion induced fusion- fission reactions.
Departures from the SSPM predictions of the fragment angular distributions were observed in many systems, particularly with highly deformed targets, in energies close to any below Coulomb barriers in ejectiles in 1980’s and 1990’s and quickly became subject of intense experimental and theoretical investigations. It had been of interest because of the excitation energies and the total angular momentum of the systems were within reasonable ranges and the systems were fully expected to follow the compound nuclear fusion-fission paths. Spectacular rise in the angular anisotropies of the fission fragments [defined as the ratio of yields, ] as the energy is lowered through the Coulomb barrier were observed [5, 6, 7]. As the angular anisotropy can be related to the macroscopic properties where is the mean square angular momentum and is the width of the distribution of K-values; K being the projection of total angular momentum on the nuclear symmetry axis at saddle point, both or may be the reason for enhanced A values.
The average value of is determined from the fitting of the fusion-fission excitation functions and dependent on the reaction mechanism and optical model parameters. The average width of the K-distribution, is in turn, related to the temperature and the moment of inertia of the nucleus about the symmetry axis. The value of could be calculated from the macroscopic properties of a finite rotating liquid drop in a heat bath and considered to be reliable. Hence, the initial explanation of anomalous angular anisotropies pointed to an anomalous widening of spin distribution i.e., .
The uncertainties in determining was slowly resolved, both experimentally and theoretically. In the systems where targets were heavy deformed actinides, like thorium or uranium, the fission of target like nuclei following excitation by transfer of few nucleons from the projectile, the so called transfer fission channel, was significantly populated. The mixture of transfer fission was argued to be the cause of the broadening of the spin distribution. The thrust of experimental investigations were directed to isolate the pure fusion-fission events.Folding angle between complementary fission fragments was found to be dependent on the recoil velocity of the CN and a precise measurement of the () distribution of the fission fragments easily separates exclusive fusion-fission events following full transfer of the incident momentum [8, 5]. However, exclusion of transfer fission from the total fission events increased the angular anisotropy compared to inclusive measurements. The angular anisotropy of the exclusive fusion-fission reaction became more anomalous [9] compared to that predicted by macroscopic theories.
Smaller corrective steps, viz, taking into consideration of cooling of compound nucleus by pre-saddle neutron emissions, or the appropriate values of the level density parameter did not improve the fit between the experimental data and theoretical predictions. An important break-through, out of the impasse, was achieved when the calculation of the could be made more reliable. The basic uncertainty in determined from fission excitation function came from the optical model parameters of the coupled channel calculations. [One-dimensional barrier penetration model was inadequate to explain the large magnitude of enhancement in fusion (fission) cross sections observed in below barrier energies]. However, another check of the model parameters could be done by comparing the predicted distribution of fusion barriers (which is a function of ) with a precise experimental determination of the same quantity [6]. Hence a precise and unambiguous determination of and subsequent calculations of the angular anisotropy proved beyond doubt that width of the K-distribution, must have been smaller than that calculated from finite rotating liquid drop model to explain the observed anomalously enhanced angular anisotropies [9].
The above experimental observation of the anomalous fragment angular anisotropy and narrowing down of the cause to a diminished width of the K-distribution over that expected from complete equilibration, prompted theoretical assumptions regarding the fusion and fission reaction mechanisms.
In order to explain the angular distributions of fission fragments in energies much lower in which quasi-fission prevails, Kapoor and Ramamurthy (KR) [10] postulated a pre-equilibrium model. According to KR, for fission time smaller than 8 sec, the K-quantum number do not reach equilibrium and the width of the K-distribution . Hence the smaller value of explained larger fragment angular anisotropies. However it was difficult to imagine that as energy is decreased through the fission barrier, the fission time scale becomes smaller than 8 sec and pre-equilibrium mode becomes more dominating reaction mode, particularly for deformed target projectile system.
An argument circumventing the above to apply the pre-equilibrium model at near and below Coulomb barrier was put forward by Vorkapic and Ivanisevic [11]. According to their idea, the width of the K-distribution,varies with the orientation of the nuclear symmetry axis. In lower energies, where the fusion cross sections are primarily due to reactions on the polar region of the deformed target, the calculated fission time scales following the macroscopic properties of liquid drop model are smaller than the K-equilibration times and boosts the fragment angular anisotropy.
The pre-equilibrium model of Kapoor and Ramamurthy and the later modified version of Vorkapic and Ivanisevic do not change the basic path of the system in a multi-dimensional energy landscapes, but only indicates that the fission following fusion can be faster than the equilibration time of some quantum numbers (namely the projection of spin on symmetry axis). However, an entirely new postulation was made by Hinde et al., [6] to introduce a quasi-fission mechanism, analogous to the one observed at much higher excitation energies and nearly symmetric nuclei pair, to near and below barrier energies, but applicable to only specific deformed target-projectile combinations. The postulated quasi-fission mechanism, which points to the system going over the initial two-nucleus configuration in the entrance channel to a final binary fragments in a fission like reaction, skipping the intermediate equilibrated compound nuclear state altogether, resulting in enhanced fragment angular anisotropy. The onset of the quasi-fission depends on the relative compactness of the target and projectile and is assumed to be probable for the projectile hitting the ”polar” region of the deformed target rather than the equatorial region, as the former configuration favours a more elongated intermediate mono-nucleus prone to reach the saddle shape on a asymmetric mass ridge in the energy landscape while for the later configuration, a compact mono-nucleus preferentially ends up to nearly spherical compound nucleus. As the energy is decreased, the reaction proceeds only through the polar region and the orientation dependent quasi-fission dominates.
Such a reaction mode composed of two fusion-fission paths - the normal path over a fusion barrier to CN and then riding over a mass symmetric fusion barrier, and the quasi-fission path over a ridge along the fusion barrier for deformed target and hitting a mass asymmetric barrier, with characteristic widths for K-distribution. The mixture of two modes could successfully explain the observed angular anisotropies [6, 7].
Around late nineties, experiments on the angular distribution of fission fragment in heavy ion reactions could be summarized as to lead to two view points - in large number of systems the systems follow the statistical fusion-fission path, but in deformed target projectile systems, particularly around and below the Coulomb barrier, notable deviations are evident, presumably due to pre-equilibrium effects or due to a quasi-fission mechanism dependent on the relative orientation of the symmetry axis of the deformed target with respect to the fusing projectile. To choose between the two explanations, the focus shifted to other experimental probes.
Hinde et al., tried to measure [12] the mass distribution of the fission fragments in 16O + 238U (ground state deformation ) in energies close to the Coulomb barrier. The authors a priori assumed that mass distribution for quasi fission reaction would be asymmetrical and they analyzed the experimental distribution of fragment masses in terms of a mixture of three normal distributions - one symmetric for the normal fusion-fission path, the other two Gaussians due to mass asymmetric quasi-fission. Although the authors claimed a systematic change in the ratio of the asymmetric to symmetric fraction, absence of an evidence of a discernible separation of symmetric and asymmetric mass distributions in the experimental data rendered the probe doubtful.
If quasi-fission is present, the fusion process would be hindered, particularly at energies where the cross section for the fission reactions are primarily enhanced due to reaction through the polar region of the deformed target. Berriman et al., [13] studied the relative fusion cross sections with different target-projectile combinations leading to the same compound nucleus of 216Ra. They reported inhibition of the production of evaporation residues (ER) in more symmetric target-projectile combinations of 19F + 197Au and 30Si +186W, but no inhibition of ER in asymmetric 12C + 204Pb system. Later experiments on a host of systems on production of , the (HI, xn) cross-sections got hindered as the entrance channel mass asymmetry got lowered in several systems. However, it was also noted that microscopic effects such as the binding energies of the systems also played a significant role [14].
The above findings clearly points to the possible quasi-fission reactions hindering the fusion process. However, the nice scenario achieved in the above experiments have become hazy once again, in the report by Nishio et al., [15], of their inability to confirm any inhibition of production of the ER’s in 16O + 238U system.
The present investigations started in early 2000 and it had been planned that we will concentrate on investigating the fusion-fission process with the help of an accurate determination of the masses of fission fragments.
The determination of precise masses itself was a challenging task, particularly for fission reactions with very low cross sections. In a series of initial experiments on fission fragment mass measurements, which are not reported here, we realised that a double arm time of flight spectrometer for simultaneous detection of complementary fragments over a large flight path of at least 50 cms offers a decent method, with mass resolutions of a few atomic mass. We also noted that the complementary fragments detected with a position sensitive detectors also enable separation of the complete fusion reactions with incomplete momentum transfer events.
We took up the fabrication of large position sensitive gas detectors with high gas gains to have a good position and timing properties. Operating the detectors with small gas pressures, we could virtually make the detectors transparent to the projectile-like particles.
We chose the target and projectiles with the option of studying the reactions on spherical and deformed target. The projectiles were chosen to have the entrance channel mass asymmetry larger and smaller than the Businaro-Gallone ridge. Simultaneous measurement of mass and angular distributions were done in systems where reported data on the angular distribution data were not available or not extensive.
The experiments were done at the 15 MV Pelletron accelerator at the Nuclear Science Centre, New Delhi. Pulsed and bunched beams of carbon, oxygen and fluorine beams were used. Typically 96 hour beam slots were utilized for the experiments with 2-4 pnA. The center also offered for scattering experiments, a 1.5 m diameter scattering chamber with provisions of putting gas detectors inside the chamber. The analysis of signals from the detectors and the supply of high voltage supplies, along with slow control of the chamber parameters could be handled from remote locations. Data stored on optical disks could be analysed off line with data analysis softwares developed indigenously at the laboratory at SINP, Kolkata.
We studied the systems of oxygen and fluorine on a self supporting bismuth target. The angular distributions and mass distributions were studied. The angular distributions were found out from the yields of complementary fragments as a function of the angle of the fragment in the forward detector. The mass distributions were determined from the difference of time of flight between the two detectors. We concluded that the systems with spherical target and projectile, fusion-fission paths follow the expected compound nuclear fission reaction. The mass distributions show a smooth variation of the width of the distribution with energy. In the experiments, we could eliminate any effect of elastic, quasi-elastic or transfer fission channels and precise measurements of the masses were possible with a mass resolution of 3-4 a.m.u. The systematic effects for elimination of experimental errors were finalized in this set of experiments.
In the next series of experiments, projectiles of carbon, oxygen and fluorine were used on the deformed target of thorium. Self supporting rolled foil of thorium was used as target. Since angular distributions, excitation functions, barrier distributions were experimentally measured earlier, only precise measurement of the mass distributions of fragments were attempted. The experiments were repeated to confirm the results. In the case of 19F+ 232Th, the first experiments showed decisive departures of the width of the mass distributions from a smooth behaviour observed in the variation of width with energy in 19F + 209Bi system. Similar experimental observations on O+Th system established that width of the mass distribution is also an important tool to pick up the deviations from the normal compound nuclear fusion-fission reactions, as effectively as in the study of angular anisotropy of fission fragments. The effect of the direction of flow of nucleons were studied in the 12C+ 232Th system, with an entrance channel mass asymmetry greater than the Businaro-Gallone value.
The results on the variation of the widths of the mass distribution in deformed target and projectile system for the first time showed a clear effect due to non-compound fusion-fission channel. The variations of the widths could be phenomenologically explained with an assumed mixture of normal fusion-fission and quasi fission channels. We could successfully use fragment mass distributions as a probe and establish that postulation of the quasi-fission dependent on orientation of the nuclear symmetry axes can be a viable explanation of the observed departure of the systems from a purely macroscopic picture.
During the course of work, detailed computer simulations of the paths of the fusion-fission and other probable channels through a multidimensional energy landscape were reported. The present investigations strengthens the need for more detailed calculations and simulations to get an insight into the dynamics of the damping and motion of the nucleons in a quantum dissipative medium.
Bibliography
- [1] N. Bohr and J.A. Wheeler, Phys. Rev. 56 426 (1939).
- [2] V.M. Strutinsky, Nucl. Phys. A 95 420 (1967).
- [3] I. Halpern and V. M. Strutinsky, in Proc. of 2nd International Conference on Peaceful Uses of Atomic Energy, (United Nations Publication, Geneva, 1958), Vol. 15, p 408.
- [4] C. Gregorie, C. Ngo and V. Remaud, Phys. Lett. B 99 17 (1981).
- [5] Huanqiao Zhang, Zuhua Liu, Jincheng Xu, Xing Qian, Yu Qiao, Chengjian Lin and Kan Xu, Phys. Rev. C 49 926 (1994).
- [6] D. J. Hinde, M. Dasgupta, J. R. Leigh, J. P. Lestone, J. C. Mein, C. R. Morton, J. O. Newton, and H. Timmers, Phys. Rev. Lett. 74 1295 (1995).
- [7] N. Majumdar, P. Bhattacharya, D.C. Biswas, R.K. Choudhury, D.M. Nadkarni and A. Saxena, Phys. Rev. Lett. 77 5027 (1996).
- [8] P. Bhattacharya, N. Majumdar, P. Basu, M.L. Chatterjee, D.C. Biswas, A. Saxena, V. S. Ambekar, R.K. Choudhury and D. M. Nadkarni, Nuovo Cimento 108 819 (1995).
- [9] N. Majumdar, P. Bhattacharya, D.C. Biswas, R.K. Choudhury, D.M. Nadkarni and A. Saxena, Phys. Rev. C. 51 3109 (1995).
- [10] V. S. Ramamurthy and S. S. Kapoor, Phys. Rev. Lett. 54 178 (1985).
- [11] D. Vorkapic and B. Ivanisevic, Phys. Rev. C 52 1980 (1995).
- [12] D. J. Hinde, M. Dasgupta, J. R. Leigh, J. C. Mein, C. R. Morton, J. O. Newton, and H. Timmers, Phys. Rev. C. 53 1290 (1996).
- [13] A.C. Berriman,D. J. Hinde, M. Dasgupta, C. R. Morton, R.D. Butt and J. O. Newton, Nature (London) 413 144 (2001).
- [14] P. Moller and A.J. Sierk, Nature 422 485 (2003).
- [15] K. Nishio, H. Ikezoe, Y. Nagame, M. Asai, K. Tsukada, S. Mitsuoka, K. Tsuruta, K. Satou, C.J. Lin and T. Ohsawa, Phys. Rev. Lett. 93 162701 (2004).
Chapter 2 Position sensitive detector
2.1 Introduction
In heavy ion induced reactions at bombarding energies below 10 MeV/amu the reaction mechanisms which contribute to the total reaction cross sections are elastic and inelastic scattering, fusion like process (fast fission, quasi fission and pre-equilibrium fission) and compound nucleus formation followed by its statistical decay. If the compound nucleus is heavy and fissility is higher than unity, the most probable statistical decay mode is fission. A significant part of the information available on fission has been provided by the mass-energy-velocity analysis of fission fragment (FF) distributions. The measurement of the mass, energy and angular distributions for FF gives the possibility to study the dynamic aspects of the fission process when the compound system moves through the saddle point to scission. However, in such studies, it is essential to separate the fission fragments from a compound nuclear reaction from those following elastic, quasi-elastic and non-compound fission reactions. The separation of different reaction channels can be obtained from precise measurement of the linear momentum transferred in the reaction. A signature of the linear momentum transferred in the heavy ion induced fission reaction is the folding angle between the complementary fission fragments. So, simultaneous measurements of velocity, energy and angular distributions of the two correlated reaction products can give information about the contributions of the different types of reactions as well as dynamics of fission.
Based on the correlation method, we designed a spectrometer for investigating the binary fission process. Instead of determining the fragment-mass distributions by a combined velocity-energy measurement [1] of the reaction products (which requires high individual resolving powers of the time and energy detectors [2]) we preferred the accurate measurement of the TOF difference of the two correlated fragments. The fission fragments have to be isolated in presence of large back ground of undesired events, such as gamma quanta, electrons, light charged particles and neutrons. The task becomes more difficult as the cross sections for fusion fission reactions falls of steeply with decreasing projectile energy below the Coulomb barrier. Therefore, the experimental arrangement should be based on large-area position sensitive gas detectors.
It is from the early 1970s when the new available accelerators could deliver good quality beams, sophisticated low pressure gas detectors started to take over - covering large solid angles. These detectors efficiently measure the TOF, position, energy loss and are capable of handling high particle rates without any radiation damage. The development of gas detectors was truly revolutionized by the invention of the Multi-Wire Proportional Chambers (MWPC) [3] by Georges Charpak in 1968. MWPCs are suitable to detect heavy ionising particle selectively when operated at very low gas pressure. These detectors offer very high gain, fast rise time, good position resolution and excellent detection efficiency for fission fragments [4, 5, 6, 7, 8]. With judicious choice of gas and gas pressure, heavy ions can easily be discriminated from a background of light ions. In early 1980s, Amos Breskin in The Weizmann Institute of Science, Israel, developed a detector (known as Breskin detector) [9, 10] which consisted of a pre-amplification stage operating as a parallel plate chamber (PPAC) directly coupled to a MWPC. Breskin detectors proved to be the most suitable in heavy ion induced fission studies at low energies. These detectors has high gain (105 - 106; 100 times more than MWPCs), good time resolutions ( 200 ps fwhm) and position resolution ( 200 m fwhm). A number of Breskin detectors were designed and fabricated in our laboratory at Saha Institute of Nuclear Physics and was used in the TOF spectrometer which was set up inside the 1.5 meter diameter General Purpose Scattering Chamber (GPSC) at Nuclear Science Centre, New Delhi.
Design and construction details of the detectors are described in subsection 2. Operational principle of the detector has been discussed in subsection 3. Subsection 4 is devoted to the electronics and offline test of the detector at our laboratory.
2.2 Design and Construction of Detector
For the detection of low energy heavy ions, the thickness of the entrance window of a detector should be very thin. This demands that, the detector be operated at low gas pressure (less than 5 Torr) . But at such low gas densities, heavy particles of low energies have comparatively low electronic energy loss, and therefore produce only a few primary electrons in the gas. For example, only few tens of electrons are produced per mm at 1 Torr of isobutane. Hence, Parallel Plate Avalanche Chamber (PPAC) with typical amplification of 104-105 are excluded. Even low pressure MWPC with typical gains of 105-106 do not have sufficient amplification to provide good timing and position information. In PPACs and MWPCs, the electrons are exponentially multiplied according to their distance from the anode, i.e., the avalanche basically generates from the primary electrons produced close to the cathode. So, under the low ionization conditions, poor response is obtained.
To solve this problem, the idea [10] was to increase the number of primary electrons by drifting the electrons produced along the ion path in the collection stage into a MWPC and thereby multiplying each of them with an equal gain. This structure improves the primary ionization statistics, but, due to the drift time of the electrons, rise time of the anode signals become larger and hence the time resolution goes poorer. However, this problem can be overcome by operating the first stage, not as a slow collection space, but as a pre-amplification stage. This gives an efficient multi-step operation mode, which provides high total gain, first time response and good position resolution.
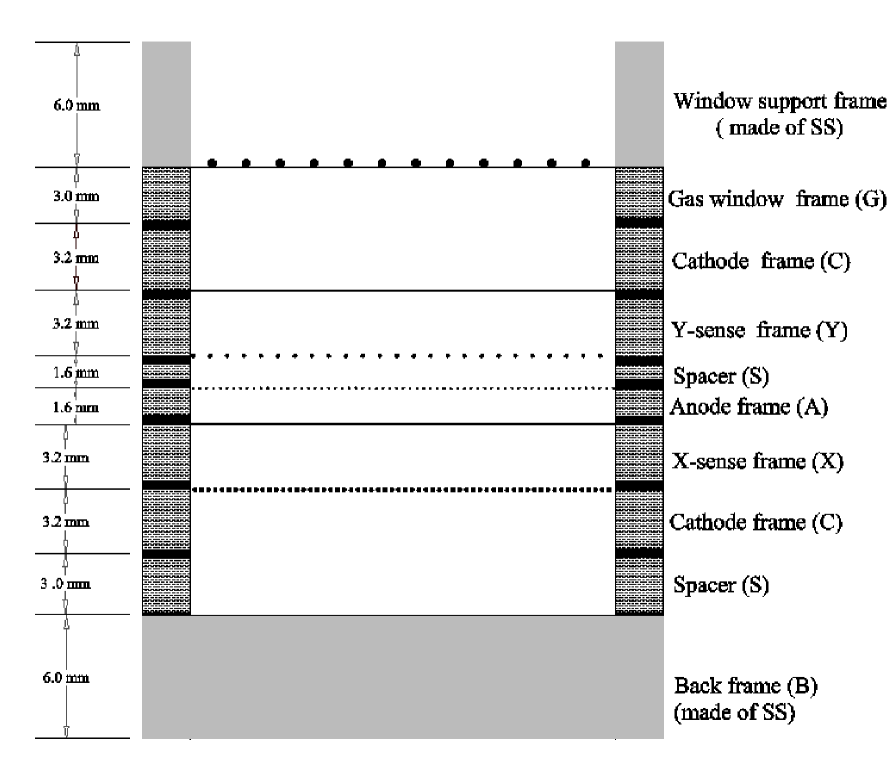
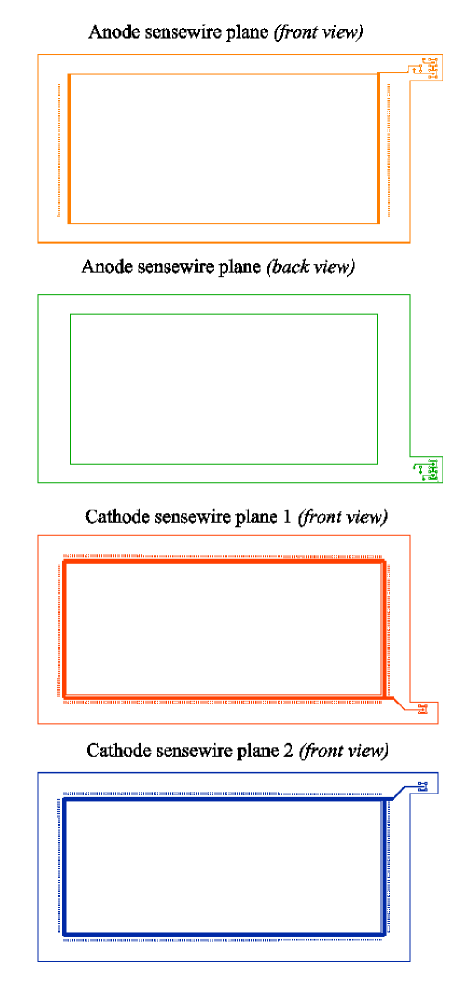
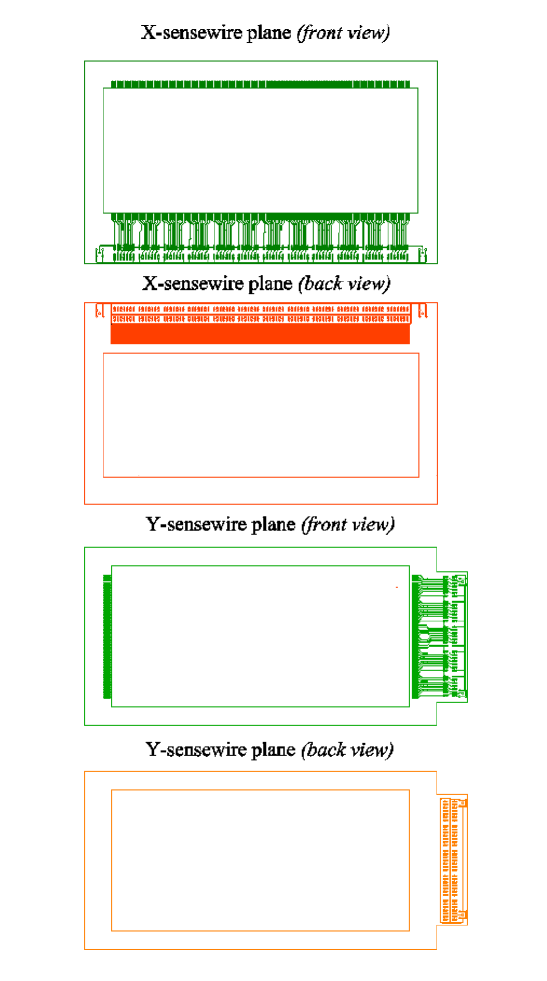
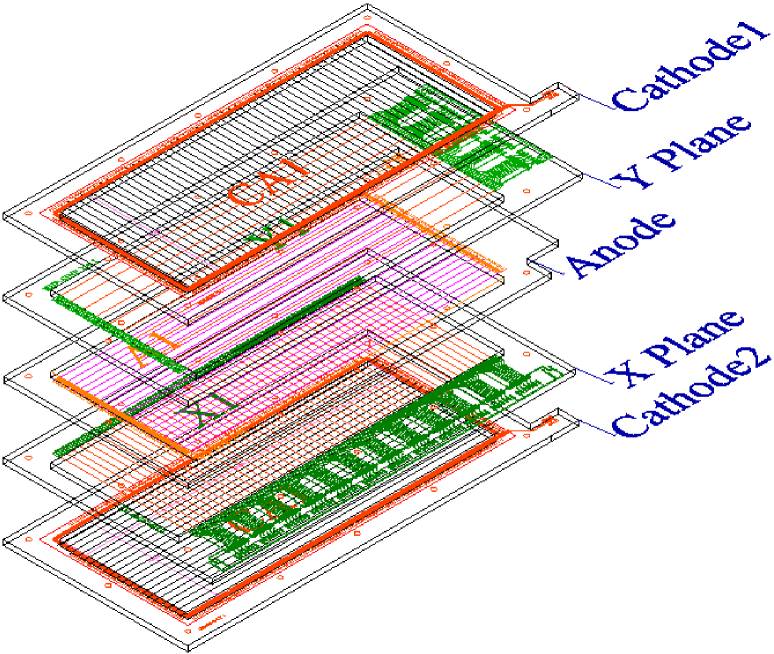
The detectors we made, consisted of two PPAC stage coupled to a low pressure MWPC. The active area of the detector was 24 cm 10 cm. A schematic diagram of the cross sectional view of the detector is shown in Fig.2.1. There was five wire planes, one anode (A), two sense wire planes (X, Y) and two cathode (C) wire planes. Design of the anode, cathode and sense wire planes are shown in Fig.2.2 and Fig.2.3. The anode wire planes consisted of 12.5 m diameter gold plated tungsten wires (manufactured by LUMA, Sweden), soldered 1 mm apart. The X and Y sense wire planes were perpendicular to each other and were made of 50 m diameter gold coated tungsten wire, placed 2 mm apart. The cathode wire planes were also made of 50 m (or 20 m) diameter gold coated tungsten wire, placed 1 mm apart. The separation between anode and X (or Y) planes was 1.6 mm while separation between X (or Y) and a cathode plane was 3.2 mm. All the wire planes were made of G - 10 quality double sided epoxy, copper plated boards (PCB). A 3 dimensional view of the detector wire planes is shown in Fig.2.4
The position informations were derived from the X and Y sense wire planes with delay line read out. The X sense wire plane consisted of 120 wires at a pitch of 2 mm and 50 wires at 2 mm pitch was used as Y sense wires. The position signals were read by tapped delay lines. The delay between successive X-sense wires was 2 ns, while that between Y-sense wires was 5 ns. The delay line chips, made of Rhombus Industries, USA provided ten delay lines per chip and twelve such (TZB12-5) delay lines chips were used for the X-sense plane where as five chips (TZB36-5) were used for Y-sense plane. The chips had characteristics impedance of 50 and fast rise time ( 7 ns). One end of the delay line chain was terminated on board through 50 and signal was taken from the other end.
The anode wires were soldered on to conducting strips. The cathode wires were similarly soldered to a conducting pad. The two cathode wire planes were shorted outside and connected to a power supply through a charge sensitive pre-amplifier (ORTEC 142 IH). This gives the provision to get the energy loss signal from the cathode. In X and Y sense wire planes, the wires were connected to the individual pad which were connected to successive pads of delay line chips.
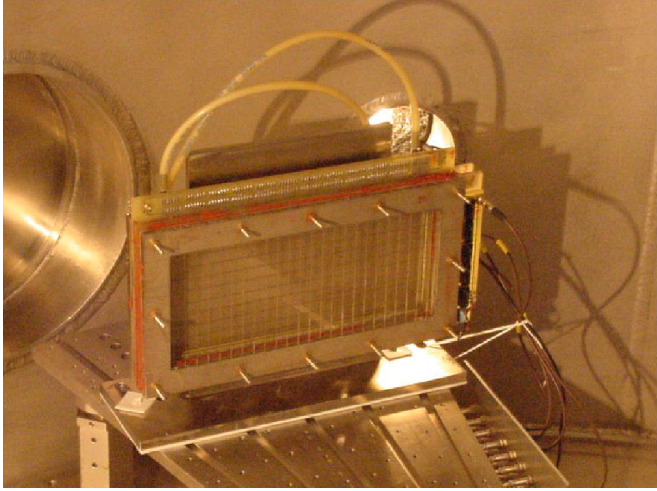
Successive layers of PCB boards with spacers(S), also of G-10 boards were vacuum sealed with RTV88 sealant (General Electric, USA). Stretched polypropylene films of thickness 50 - 100 g/ cm 2 were used as the entrance windows (G) of the detector. A 1 cm 1 cm wire mesh of stainless steel wires of diameter 0.4 mm was used as a support to the polypropylene film. Two gas feed-throughs were connected to the back support frame (B) which is made of stainless steel. Isobutane gas is continuously sent through the detector at a constant pressure flow mode with baratron feed-back closed loop flow control system (made of MKS, USA). Typical operating pressure was about 2 Torr. A photograph of the detector is shown in Fig.2.5
2.3 Operational principle of the detector
The properties of the multi-wire proportional counters was extensively investigated [5, 11] since their introduction by Charpak in 1968. First measurements with MWPCs at pressure as low as 3 Torr showed [12] that a time resolution of 2.5 ns (fwhm) could be reached with 5.5 MeV particles. However, more careful study by Breskin et al. [13] reported a time resolution about 0.8 ns at a pressure of 5 Torr of ethylene. This rather astonishing time performance was two orders of magnitude better than that usually achieved at normal gas pressure and was first attributed to a faster collection of electrons rapidly drifting in the presence of high electric field. Some further investigations [6, 14] had led to consider an entirely different operation process.
In order to achieve the multi-step avalanche of electrons, the detectors were operated with a high reduced electric field for substantial gas multiplication. Typical voltages applied on anode and cathode planes were +280 Volt and -250 Volt respectively. The sense wire planes were grounded through delay lines. The operating pressure was about 2 Torr. The reduced electric field E/p, where E is the electric field between the cathode and and sense wire plane, and p is the gas pressure, was high enough ( 450 Volt cm-1/Torr) to produce secondary multiplication of the primary electrons produced in the region between cathode and sense wires. However, the electric field in the cathode to anode region is a constant accelerating field. The constant filed in this region is not qualitatively changed by the introduction of the grounded X, Y sense wire planes at 1.6 mm distance. The intense field region around the central anode wire extends roughly twenty times the diameter, i.e., in this case about 0.25 mm.
When an ionising particle passes through the detector volume primary ionisation are produced. In the gap between cathodes and sense wire planes, the detector works as a parallel plate avalanche counter which means the reduced field in this region is high enough to produce secondary electrons. The secondary electrons are accelerated by the field and produce a swarm of electrons which pass through the sense wire grid. In the sense wire to anode gap, the operation of the detector is similar to that of a MWPC. The swarm of electrons continue to grow and expand till those experience the intense attractive field around the anode. A large avalanche of electrons produces a fast localised current pulse on the concerned anode wire. The production of secondary electrons, all along the electron trajectories, combined with the intense avalanche near the anode produces very high gas amplification ( 108). A large fast negative signal on the anode wire is produced which induces positive voltage signals in the nearby X, Y sense wire. Typical anode signal is 5 mV on 50 and rise time 1 ns. The positive ion sheath is collected with in a few microseconds and the detector can withstand large counting rates. The position signals develop over a few adjacent wires for every event. The average position of the avalanche in the detector can be determined from the centroid of the avalanche triggering pulses in sense wires. These pulses are delayed by delay lines and average time delay measured with respect to the anode pulse is the measure of X, Y positions of an event.
The detector was operated at pressure 2 torr. Hydrocarbons, like isobutane, n-heptane and propane are popularly used as operating gas. The factors which govern the signal amplitude and pulse rise times are the inelastic electron scattering cross section and mean free path between collision and the mobility of the electron in the gas. Quick neutralisation of the positive ion sheath is also important. A slight admixture (1%) of electronegative gas like freon may improve the performance of the detector. We used isobutane as a operating gas because the energy loss density dE/dx, is higher and so the thickness of the detector can be reduced. Also for this gas, the inelastic cross section for the interaction of electrons with the gas molecule is high. The detectors were operated in constant flow mode with precise electronic regulation of gas pressure.
2.4 Offline test at laboratory
After the fabrication, the detectors were tested in the laboratory for uniformity of the position read outs and correspondence between the timing (anode pulse) and position (X-Y delay line signals). A 252Cf source was mounted in front of a detector which was placed inside a evacuated chamber.
The electronic set up for operating a single detector is shown in Fig.2.6. Positive and negative high voltages, required for anode and cathode of the detector can be supplied from the 2 fold over current protected high voltage supply module (N471A,CAEN). The current limit is set to 500 nA.
| Gas | Isobutane |
|---|---|
| Operating pressure | 2.5 torr |
| Operating bias: | |
| Anode | +280 Volt |
| Cathode | -250 Volt |
| Anode pulse height: | |
| Fission fragment | 1-2 Volt |
| Alpha | 50 mV |
| Noise | 20 mV |
| Position pulse height: | |
| Fission fragment | 400-600 mV |
| Alpha | Not observed |
| Noise | 30 mV |
The fast negative anode pulse is boosted by a fast current sensitive ORTEC VT120A preamplifier with high gain of 200 and large bandwidth of 1.2 GHz. The positive X, Y sense pulses from the detector are picked off by PHILLIPS 6955B preamplifier and are amplified and inverted by ORTEC 474 timing filter amplifiers (TFA) before deriving the time information. The characteristics of the test pulses of a
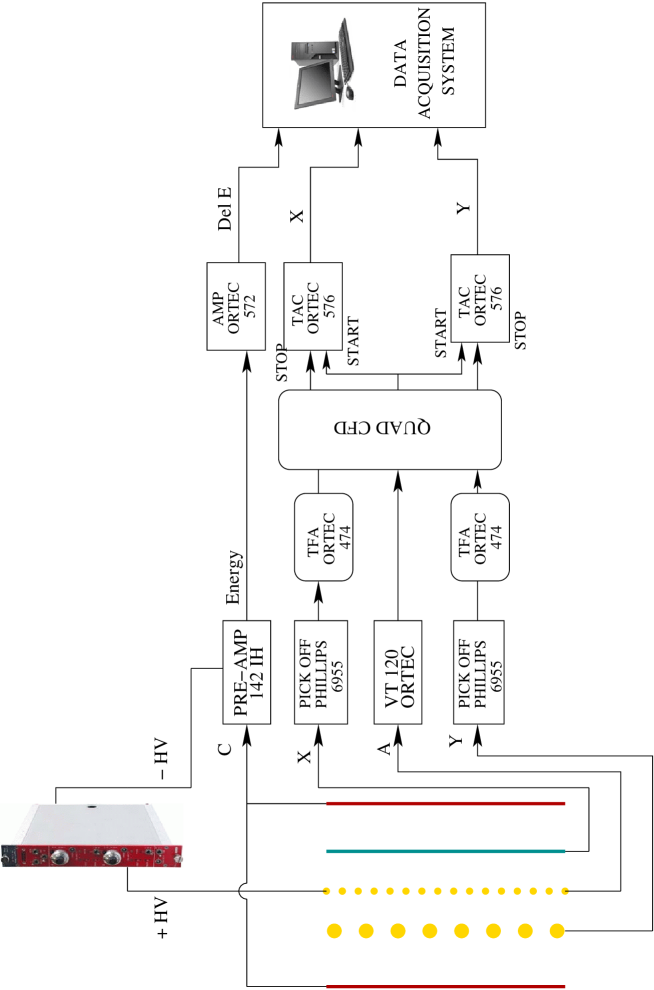
typical detector for fission fragments is tabulated in table 2.1.
The negative outputs from PA and TFA are connected to TC 454 TENNELEC quad constant fraction discriminators (CFD). The timing informations for the anode and X,Y sense pulses of the detectors from each CFD are connected to ORTEC 567 time to amplitude converters (TAC). Appropriate delays are given between start (anode) and stop (X,Y) signals. The outputs from the TAC’s measure the time differences between the arrival times of the anode and sense wire signals, thus representing the positions of the ionising particles hitting the detector. The position resolutions can be found by taking the image of a mask put on the detector and illuminating the detector with the fission fragments. The images of the stainless steel support wires for the thin window foils also serve as measure for position resolution.
Bibliography
- [1] H.W. Schmitt, W.E. Kiker and C. W. Williams, Phys. Rev. B 137, 837 (1965).
- [2] A. Oed, P. Geltenbort, R. Brissot, F. Gonnenwein, P. Perrin, E. Aker and D. Engelhardt, Nucl. Instr. and Meth. 219, 569 (1984)
- [3] G. Charpak, R. Bouclier, T. Bressani, J. Favier and C. Zupancic, Nucl. Instr. and Meth. 62, 262 (1968).
- [4] G. Charpak, G. Peterson, A. Policarpo and F. Sauli, Nucl. Instr. and Meth. 148, 471 (1978).
- [5] G. Charpak, and F. Sauli, Nucl. Instr. and Meth. 162, 405 (1979).
- [6] A. Breskin, R. Chechik and N. Zwang, Nucl. Instr. and Meth. 165, 125 (1979).
- [7] A. Breskin, R. Chechik I. Levin and N. Zwang, Nucl. Instr. and Meth. 217, 107 (1983).
- [8] M.M. de Moura et al., Nucl.Instr. and Meth. A433, 623 (1999).
- [9] A. Breskin, Nucl. Instr. and Meth. 196, 11 (1982).
- [10] A. Breskin, R. Chechik, Z. Fraenkel, P. Jacobs, I. Tserruya, and N. Zwang, Nucl. Instr. and Meth. 221, 363 (1984).
- [11] G. Charpak, Ann Rev. Nucl. Sci. 20, 195 (1970).
- [12] F. Binon, V.V. Bobyr, P. Duteil, M. Gouanere, L. Hugon, M. Spighel and J.P. Stroot, Nucl. Instr. and Meth. 94, 27 (1971).
- [13] A. Breskin, Nucl. Instr. and Meth. 141, 505 (1977).
- [14] A. Breskin, R. Chechik and N. Zwang, IEEE Trans. Nucl. Sci. NS-27, 133 (1980).
Chapter 3 Experimental procedure and data analysis
The general reaction mechanism in the heavy ion induced reaction is quite well known. The dominant reaction is the damping of the radial motion and fission of the projectile and target. The combine system usually equilibrates in various kinematic and macroscopic degrees of freedom to a compound nucleus. If the fissility is large, the compound nucleus may also undergo binary compound nuclear fission.
The compound nuclear fission reaction is not the only reaction channel and the non-compound nuclear fission process like fission following transfer of few nucleons in several fissioning system is quite significant at energies near and below Coulomb barrier [1]. This mode of fission of a target like fragment, produced due to the transfer of a few nucleons, is of different characteristics vis-a-vis the direction and the velocities of the recoiling composite system prior to fission compared to the FFCF. The velocity and direction of recoil of the target like fissioning system depends on the momentum and the direction of the ejectiles and generally differs from the recoil of the compound nucleus in the beam direction with full transfer of the incoming projectile momentum. The energy, direction and intensity of the elastic and quasi-elastic particles may also be significant compared to the fission fragments and be serious contaminant of the spectrum of fission fragments. So, in the study of the dynamics of fusion-fission reaction, it is essential to separate the fission fragments (FF) from a compound nuclear reaction from elastics, quasi-elastics and transfer fission channels.
The separation of fusion fission and transfer fission reaction can be obtained from precise measurement of the linear momentum transferred in the reaction. A signature of the linear momentum transferred in the heavy ion induced fission reaction is the folding angle between the complimentary fission fragments in the predominantly binary fission reaction.
3.0.1 Folding angle for fusion-fission:
In compound nuclear reactions full projectile momentum is transferred to the fused fissioning system and the fragment folding angle depends on vector sums of the velocity of the fission fragments and the recoil velocity of the fissioning nucleus as shown in Fig. 3.1.
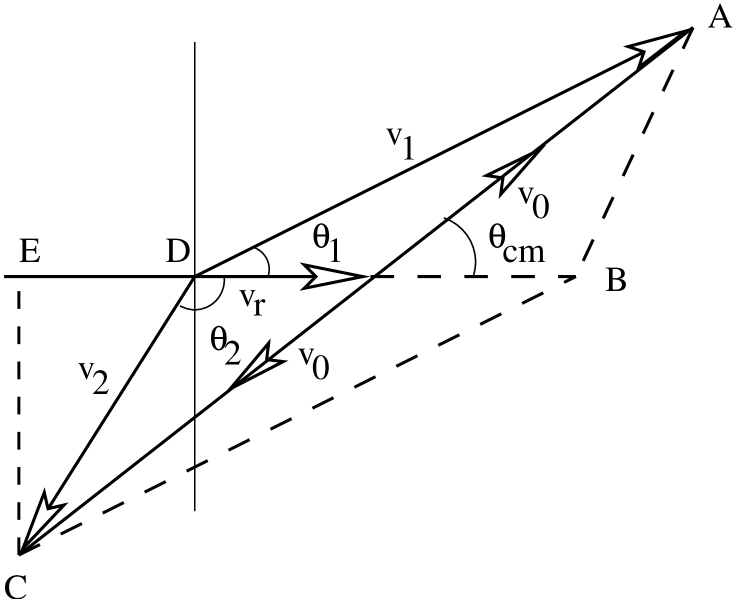
The first detector to detect the fragment F1 is kept at forward hemisphere (0). The fragments F1 and F2 are emitted with velocities and in the laboratory frame and with velocity in c.m. frame. is the recoiling velocity of the compound nucleus. The folding angle can be written according to the diagram as,
| (3.1) |
The angle is known and to calculate the folding angle, must be evaluated in terms of known quantities. Considering the geometry of the diagram,
which can be written as,
| (3.2) |
Then finally, the folding angle can be written according to eqn.(3.1) as,
| (3.3) |
From the figure, following the vectorial relationship,
Then,
where is the angle where one detector is kept to detect the fragment F1. The above expression can be written as a quadratic equation of .
| (3.4) |
Then , solving equation 3.4, the roots can be written as,
| (3.5) |
The positive root is considered only, as for negative root, for increasing becomes negative. The velocity of the fragment F1 can be written as,
| (3.6) |
The recoil velocity can be calculated as,
| (3.7) |
where is the recoil energy. The mass of the fissioning system is . The recoil energy can be calculated from the incident momentum because
where is the recoil momentum. Then the recoil energy is,
| (3.8) |
The fragment velocity in c.m. frame can be calculated from the average total kinetic energy released in fission process.
| (3.9) |
The energy can be determined from the mass and the charge of the fissioning nucleus assuming symmetric mass split, following Viola’s systematics [2]
| (3.10) |
For the fissioning system 19F + 232Th the value of and are 192.04 MeV and 1.21 cm/ns respectively. With the quantities involved, calculated in this way, the folding angle can be determined for fission following complete fusion reactions.
To convert the values of in lab. frame to c.m. frame, a relation must be established between and . From the Fig 3.1, it can be written that
So the relation between the angle of two frames of reference is
| (3.11) |
The angle in c.m. frame can be evaluated in terms of known quantities, and .
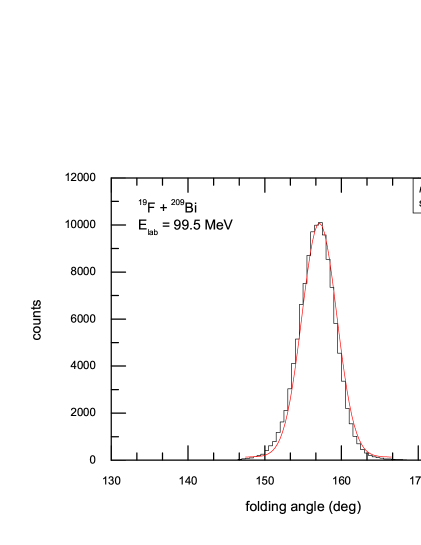
The folding angle and the width of the folding function for complementary fragments is a slowly varying function of the angle of emission of the fragment in laboratory frame. The width of the folding function (angular range of the folding angle between complementary fragment pairs) depends on the kinematic factors due to asymmetric mass splitting and variation of total fragment kinetic energy on asymmetric mass splitting, and to a large extent due to pre and post saddle neutron emission. The velocity of the fission fragments can be calculated assuming symmetric mass splitting from the phenomenological rules (Viola’s systematic [2]) and the velocity of the recoil. The distribution of folding angle is experimentally found to of Gaussian shape to even very forward angles of the detector. A typical distributions of folding angles for complementary pairs for the reaction 19F + 209Bi reaction at 99.5 MeV is shown in Fig 3.2. The reaction cross section is almost purely FFCF ( 98) and the folding angle distribution is well fitted with a single Gaussian.
At beam energies above Coulomb barrier, in transfer reactions, typically a few nucleons are transferred to the target and the erectile is emitted mostly in the forward directions and takes away a large portion of the incident momentum. As a result, fission takes place from a slower recoiling nucleus compared to that to the case of the compound nucleus in FFCF reaction. Thus the fragment folding angle in the case of TF is larger than that in FFCF (shown in Fig 3.3).
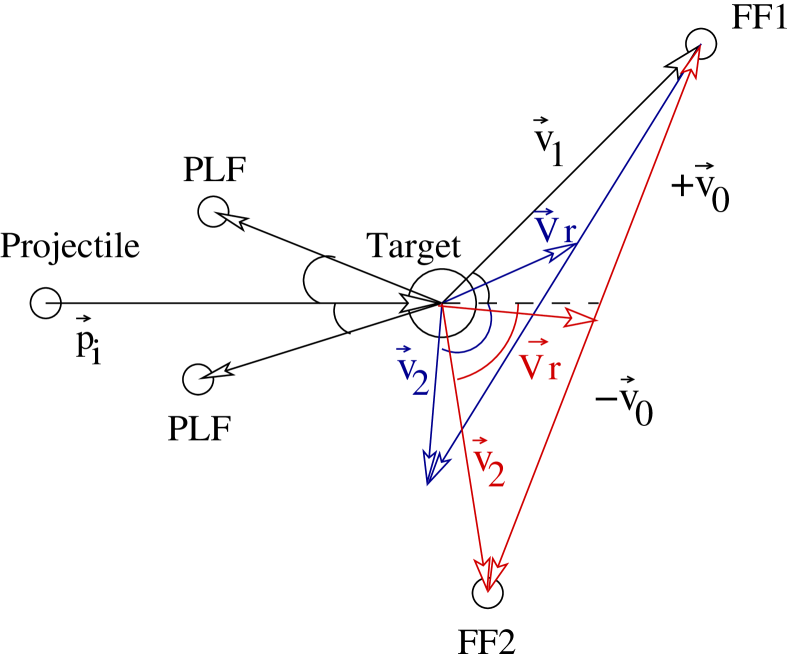
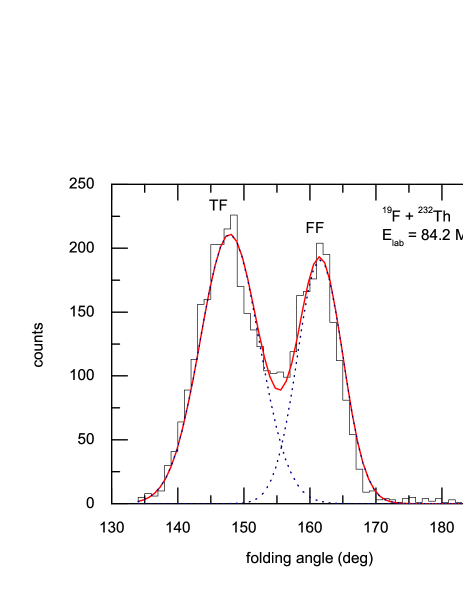
However at sub-barrier energies, heavy ion transfer cross-sections peak in the backward angles, and the backward moving ejectiles imparts more momentum to the target than even in compound nuclear reaction. Consequently the fragment folding angle is smaller than that in FFCF (shown in Fig 3.3). The folding angle distributions for FFCF are thus separable from that of TF at much above and below Coulomb energies more efficiently. The width of the folding angle distributions for TF is much wider than that for compound nuclear fission. The kinematic broadening is larger due to large variations in the recoils and is a complicated function of the angle of the detectors. The folding angle distributions are also increasingly non-Gaussian in forward backward orientations of the complementary fragment detectors. Typical mixtures of folding angles for TF and FFCF reactions are shown in Fig 3.4 for the 19F + 232Th at 84.2 MeV energy, where TF reaction cross section is significant.
3.1 Conventional experimental techniques
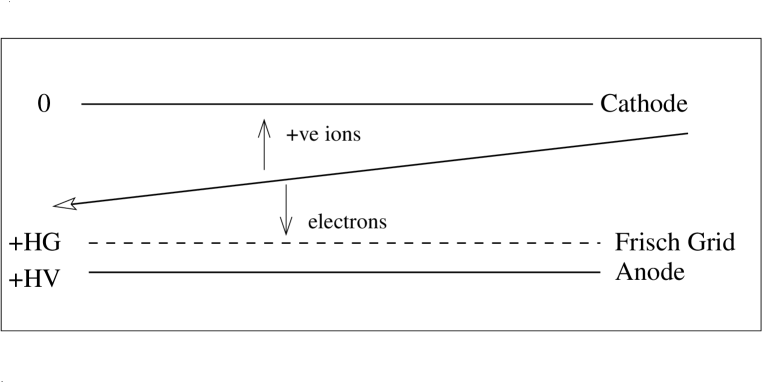
Probably the most simple device to detect individual fission events is an ionisation chamber (IC). A schematic diagram of IC is shown in Fig. 3.5. IC is a gas filled parallel plate chamber with a voltage applied across the electrodes. When an ionizing particle like fission fragment travels through the gas volume, the electrons and positive ions will drift in the electric filed of the chamber toward the anode and cathode respectively. Usually the anode is shielded by a high transparent wire mesh, a so called Frisch grid, placed just in front of the anode. The Frisch grid has the effect that the movement of electrons and ions within the grid-anode gap are sensed by an electronic amplifier coupled to the anode, thus eliminating the spatial effect on the charge collection. To a good approximation the total charge accumulated on the anode is a measure for the kinetic energy E of fission fragment being stopped in the gas volume. For binary fission events the two complementary fragments are recorded in coincidence in the two chambers.
Provided the detector has been properly calibrated, the total kinetic energy can be calculated from the energies and of the individual fragment as
| (3.12) |
where the indices L and H stand for the light and heavy fragment, respectively. From the correlated energies obtained from in the double energy experiment, the fragment masses may also be found. Neglecting the prompt neutron evaporation, mass conservation for the primary fragments give,
| (3.13) |
with and the masses of the primary fragments and the mass of the fissioning nucleus. From momentum conservation in the centre of mass system of the fissioning nucleus one gets in the non-relativistic limits,
| (3.14) |
where and are the velocities of the primary fragments. The above equations gives
| (3.15) |
with and the kinetic energies of the primary fragments. Once these energies are known, the fragment masses are readily calculated from equations 3.13 and 3.14.
Unfortunately, the determination of fragment masses from a double energy (2E) measurement experiment is accurate if the energy losses in the target is negligible and no neutrons are evaporated. In the large majority of events the evolution scheme laid down in equations 3.13 and 3.14 has to be modified and fragments after particle and neutron emission are detected. It is known that a number of prompt neutrons are emitted from the fully accelerated fragments. Assuming neutrons were evaporated isotropically relative to the fragment, the energy E would simply be reduced by a factor , i.e., a mere shift in energy. A further complication arises with the neutron emission number being not constant but showing a distribution. The average emission numbers depend furthermore on the fragment mass. Finally, any finite velocity of the neutron relative to the fragment will impart a momentum to the residual fragment upon neutron evaporation. Therefore, starting with a primary fragment at fixed energy (say ), the observed energy E will not only be shifted, but also broadened into a distribution around an average energy .
At the time solid-state devices came into widespread use in electronics, the gas filled ionisation chambers were replaced by solid state detectors. The solid state devices are rugged and easy to use and show reasonably good energy and timing resolutions. For fission fragments the energy resolution (FWHM) E achieved 1 to 2 MeV. However, there is one drawback of using solid state detectors. They suffer from a size-able pulse-height defect, i.e., for fixed incoming energy, heavy ions produce a smaller integrated charge at the electrodes of the junction than light ions (e.g., particles).
The main tool to investigate the kinematics of fission fragments is the time of flight (TOF) method. In this approach the time of flight for a given flight path and thus velocity of the fragment is determined. Both timing devices, at the start and the stop of the flight path should of course have the best feasible time resolution. An additional requirement for the start detector is, however, that the least possible amount of material should be placed in the fragment path, in order to avoid excessive velocity and angular straggling being introduced by the measurement. Energy loss in the start detector also affects the ultimate mass resolution. Start time is deduced from detector, usually a PPAC [3, 4, 5] or a micro-channel plate picking secondary electrons produced in passage of the particles through a foil. The start time can also be picked off from the pulsing of a bunched beam [6]. For a pulsed beam, time spread of the bunched beam limits the achievable mass resolution. The stopping time can be derived from a PPAC or from a silicon detector. The TOF has to be calibrated by elastically scattered particles and the mass resolution critically depends on the flight path and the accuracy of flight time measurement.
Thus, it is straightforward to perform a double velocity (2V) experiment where the complementary fragments are detected in coincidence. Mass of the fragments can be calculated from the 2V data using the mass and momentum conservation for the primary fragments prior to neutron emission. As already discussed for a 2E-experiment, one again has to be aware of neutron emission. Unlike kinetic energy, however, the fragment velocity is on the average not shifted by the isotropic evaporation of neutrons. However, for a fixed initial velocity V⋆, neutron emission will introduce a spread in the measured final velocity V of the secondary fragments. The variance of V leads in turn to a variance of the calculated mass M⋆. It can be shown that [7] that the mass variance of a 2V experiment is only about that of a 2E experiment. In this sense 2V data are superior in quality compared to 2E data.
The measurements of angular distribution require separation of elastic and quasi-elastic reaction channels and the conventional energy measurements [8, 9] with silicon or ionization chambers are not efficient to completely separate the the contaminants due to large energy straggling of fission fragments. Moreover, fragments due to different reaction mechanism (e.g., compound and non-compound channels) can not be separated in the above method. Position sensitive gas detectors with small radiation length are effectively transparent to elastic and quasi-elastic particles in low mass heavy ion ( 40) induced fission experiments and were used in complimentary fission fragment detection method to completely eliminate contamination from elastic and quasi-elastic channels.
To get accurate mass and angular distribution, we applied a double arm TOF system using fairly large, low pressure, position sensitive Breskin detectors and tuned the measurement of the fissioning systems produced in pulsed light heavy ion beam induced fission of heavy targets. The system was optimized for the available flight path and the experimental cross section. The details of the method has been extensively discussed in the following sections.
3.2 Experimental set up
To measure the TOF and the folding angle between two complementary fission fragments, two large area position sensitive detectors were employed. The construction and performance of these detectors have been discussed in chapter 2. The detectors were used to detect complementary fragments from binary fission.
The experiments were performed using a 15UD Pelletron facility of Nuclear Science Centre (NSC), New Delhi, India. The detectors and other necessary equipments were setup in a large scattering chamber of 1.5 meter diameter, popularly referred as General Purpose Scattering Chamber (GPSC) . The two arms in the scattering chamber can be rotated in the reaction plane over a wide angular range by means of motor driven pulley. The angular positions of the arms, in reference to their central line, can be read from outside from a circular scale with a vernier, coupled to the rotational movement of the arm. The height of the arms from the floor of the scattering chamber was adjustable. Two detector stands were made in which the detectors can be mounted at different height to keep the detectors in the reaction plane and electrically isolated from the body of the chamber. Two stands were fixed generally on the central line of the two arms. Two identical detectors of active area 24 cm 10 cm were mounted on the two detector stands with anode plane normal to the particle trajectories passing through the center of the detectors. Care was taken to position the detectors (detector stands) vertically on the arms and secure them rigidly to avoid any accidental movement of the detector in course of the experiment. These precautions were needed as any small angular deviation of the detector in polar or azimuthal directions from the normal positions produces systematic errors in the calculation of the flight paths for fission fragments hitting away from the center of the detector.
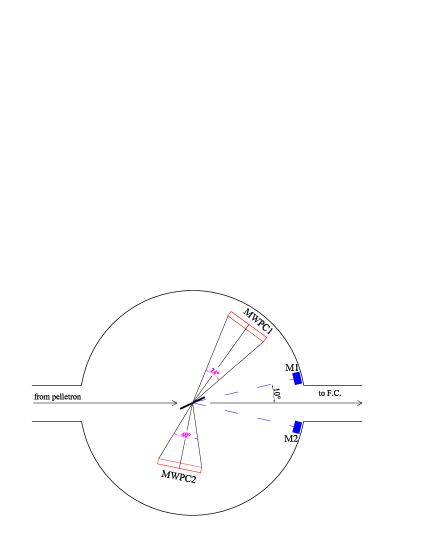
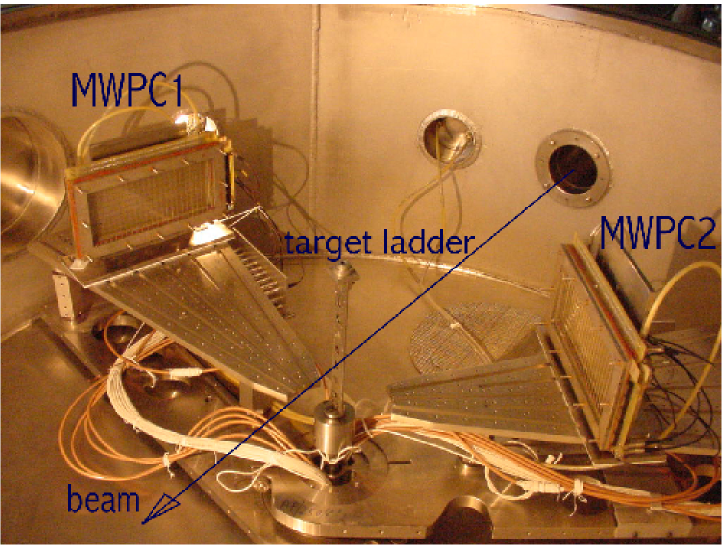
The schematic of TOF arrangement for complementary fission fragments is shown in Fig. 3.6. The detectors labeled MWPC1 and MWPC2 were kept at a distance of 52.6 cm and 33.2 cm , respectively from the target. The backward detector (MWPC2) was kept at smaller distance to ensure the full folding angle coverage for the fission fragments detected in forward (MWPC1) detector. The inner view of the scattering chamber is shown in Fig. 3.7.
The target ladder, made of stainless steel is placed at the center of the scattering chamber. The ladder can be rotated about its own axis and adjusted for different heights vertically from outside the chamber. The alignment of the incident beam upon the target was adjusted, if necessary, by illuminating a quartz target by the beam. During the experiment, if necessary, the target ladder can be removed/reintroduced into the chamber, for changing targets, with nominal disturbance to the vacuum of the chamber.
The beam is dumped on a Faraday cup with suppression for secondary electrons. The beam current is measured by a current integrator. Two silicon surface barrier detector of thickness 300 m, with a slit diameter of 2.0 mm in front of it, was kept at angle with respect to the beam at a distance about 70 cm from the target to monitor the yields for elastically scattered particles and were used to normalise the fission fragment yields of the PSD’s. One of these solid sate detectors was also used for on-line monitoring of the time structure of the beam.
The operating pressure in the scattering chamber was required to be of the order of 3 10-6 mbar. The MWPC’s within the chamber were connected to a separate gas handling system through two gas feed throughs attached to one of the side ports of the scattering chamber. One connecting valve was provided between the scattering chamber and the entrance feed-through of the detector. Cautious handling was required during the process of pumping down the system, operation of the detectors and allowing air into the system as the gas windows of the detectors were very thin ( 50 ). A small positive pressure with respect to the chamber needed to be maintained inside the detector during slow pumping down ( 10 mbar/min) or letting in air into the chamber. During pumping the detectors and the targets were kept in such a way that these avoided any direct blast of air. After the rough vacuum of the order of 10-3 mbar was achieved, the chamber is isolated from the detectors and further pumped down to about 3 10-6 mbar. For operation of the gas detectors with a steady flow of gas, the gas flow through the detectors were controlled at pressures about 2 mbar by an electronic pressure controller (MKS, USA).
3.3 Electronic setup
Fig. 3.8 shows a simplified block diagram of the associated electronics setup during one of the TOF experiment. The electronic set-up to obtain the X and Y position signals from a single MWPC has been discussed in Chapter 2. Timing pulses from the anodes (A1 and A2) were first pre-amplified by VT120A (ORTEC) pre-amplifier. These signals were then processed through constant fraction discriminators (CFD) and the ”OR” of the discriminator pulses corresponding to MWPC1 and MWPC2 signals were taken in coincidence with the RF pulse from the beam buncher of the Pelletron accelerator through the ”AND” gate. The coincidence pulse is used as master trigger (M) or the master gate for the computer automated measurement and control (CAMAC) base data acquisition system. The X and Y signals ( & ) were picked off by PHILLIPS 6955B picked off amplifier (PO) of gain 100 and fed to a CFD. The anode signals A1, A2 and the X-Y position signal pulses were then time analysed with a 12-bit time to digital converter (TDC) which was started by the master trigger. The timing diagram for the set up is shown in Fig. 3.9. The energy loss signal in the detector, E1 and E2 were pre-amplified by a charge sensitive ORTEC 142IH preamplifier. The pre-amplifiers were placed as near as possible to the detector, using short connecting cable, in order to avoid the degradation of energy resolution. The energy signal from the preamplifier was amplified and shaped by ORTEC 572 spectroscopic amplifier . The amplified signal was digitised by a 12 bit ADC’s connected to the CAMAC bus. The energy signal from the monitor detector were also similarly processed ( as the energy pulses of the MWPCs) and were recorded as histograms in the CAMAC data acquisition system. The multi-parameter data acquisition system was controlled by a standard control software, called ”freedom”.
The timing between one of the monitor detectors (MT1) and the RF were measured by a time to amplitude converter (TAC) and was recorded by a 13-bit ADC and also stored as histograms.(In some of the experiments, the timing of the monitor detector was recorded in TDC as list mode data. However, in that case master trigger was [(A1 .”OR”. A2).”AND”. RF].”OR”.(SCA output of the MT1 and RF).)Thus, during experiment eight parameter list mode data and three histograms were recorded in the hard disk of a computer and were latter transfered to CDs for offline analysis.
Necessary interconnecting cables with common grounding and adequate shielding were provided to transfer all electrical signals from the ground floor beam hall to the counting room in the 1st floor where all pulse processing and electronic modules were stationed. The NIM modules were cooled by circulation of cool air for steady performance over a number of days of continuous running. On-line monitoring of the spectra were done during the experiment.

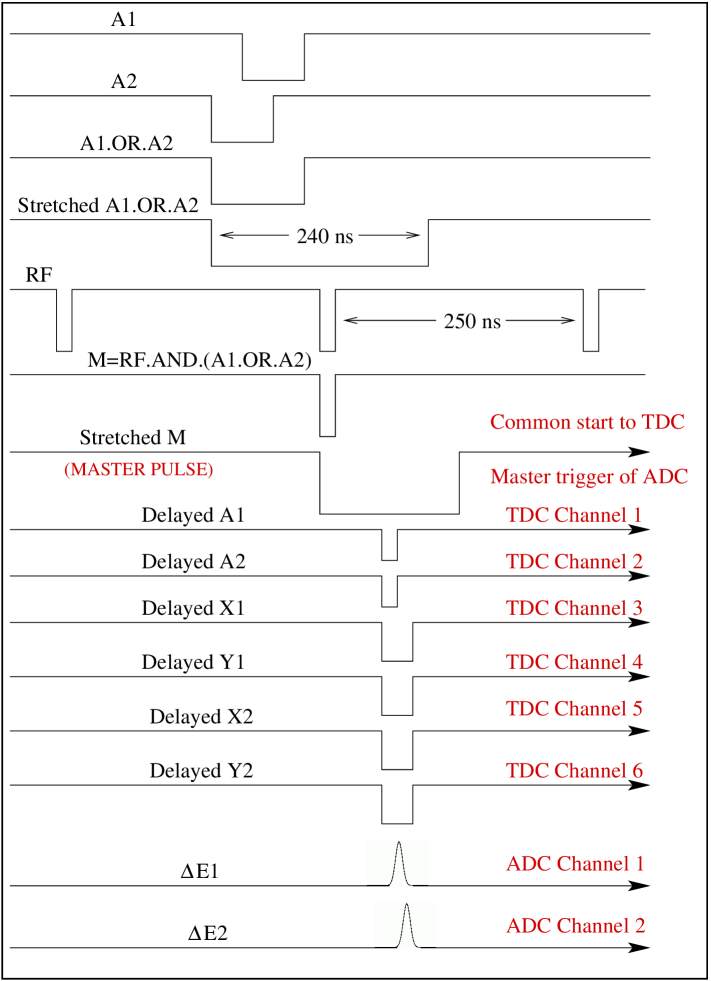
3.4 Time calibration
It has been discussed in the earlier section that the six parameters ( ), out of eight parameters collected in the list mode were basically timing signals. These signals were collected in a Time to Digital Converter (TDC), PHILLIPS 7186, in all experiments. Digitization in 12 bits starts following the COMMON start input. The time range was selected to be 400 ns. The time calibration was done using a dual pulser. One pulse starts the TDC, while another simultaneous output is delayed by calibrated delay cables and stops any particular TDC channel. The delay between the start and stop pulses of the TDC were varied and a time spectrum was generated.
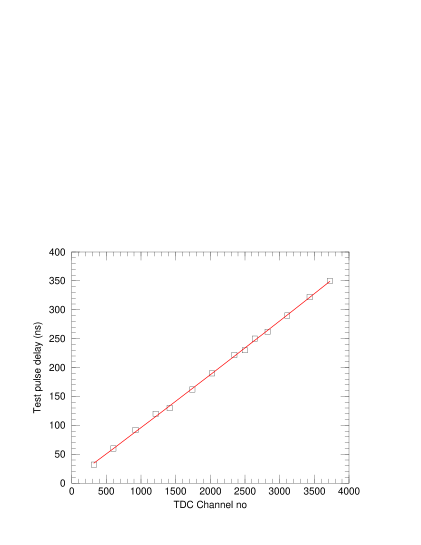
Fig. 3.10 shows time calibration of TDC channel
for spectrum in one of our experiments. The channel was found slightly
non linear and a second order polynomial was used for the calibration. The
value of the co-efficients in this particular channel were:
5.9360
Same procedure was applied to calibrate all the TDC channels in use.
3.5 Calibration of position
The position sensitive detector provides the position signal of a heavy fission fragment by measuring the delay of the sense wire pulse with respect to the anode pulse. After getting the position informations about two complementary fission fragments detected in the MWPCs, the corresponding angular measures were obtained to know the folding angle of the fission fragments. Hence, the conversion from the experimental TDC channels to angles is required to find the opening angle of fission fragments. Since the position resolution obtainable in these detectors are excellent in terms of angular resolution, position calibration procedure with shadows of the window support wires can be used for MWPCs.
In the above described calibration procedure, dips in both X and Y spectrums, for each of the mesh wire should have to be clearly visible. Moreover, because of large distance, very long exposure were needed to get clearer shadows of the wires in a two dimensional X-Y spectrum. Typical X and Y spectrum in one of our experiments for the system 19F + 209Bi at laboratory energy 96.0 MeV are shown in Fig. 3.11 and Fig. 3.12. From previous measurement [10], it is well known that a linear relationship, corrected for solid angle effects is adequate for the position calibration.
Here, the following calibration procedure was followed in our data analysis.
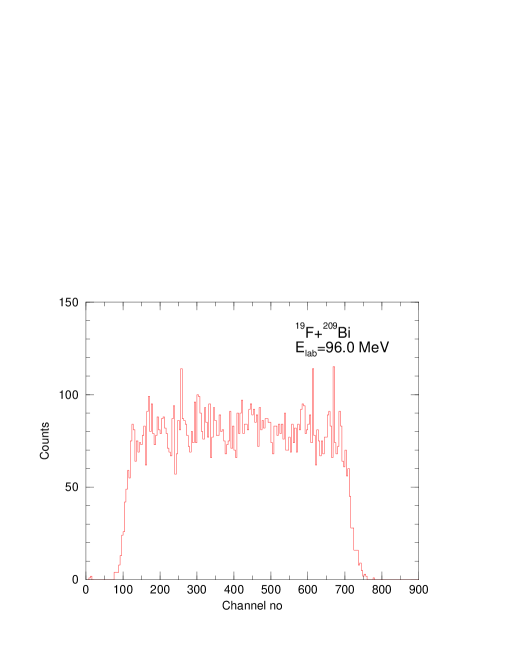
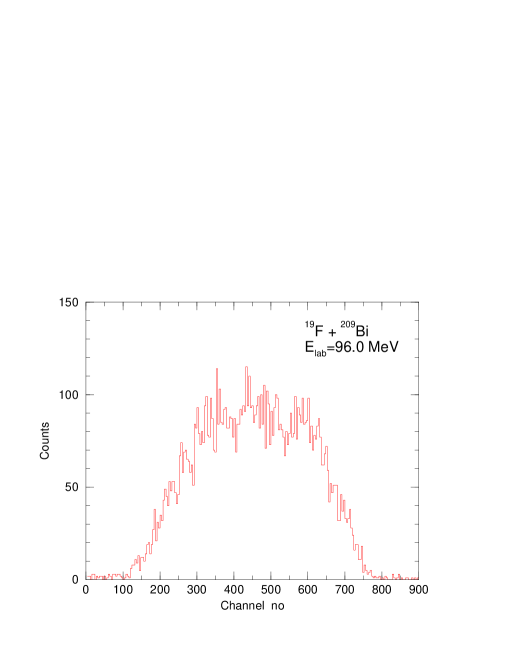
A schematic diagram used for the angular calibration of the detector is shown in Fig. 3.13. The active area of the detector was 24 cm 10 cm and was placed 33.2 cm from the target. The central position of the detector was assigned as l 0 cm while the right edge and left edge of the detector had l -12 cm and l +12 cm respectively. There were 24 wires (diameter 0.4 mm), provided as the support to the window foil of the MWPC, along the length of the detector and each were separated by 1 cm . The correlation between the length and the off-sets of the wire positions from the central position of the detector is tabulated in table 3.1. Fig. 3.14 shows the correlation plot between l and . The correlation is given by
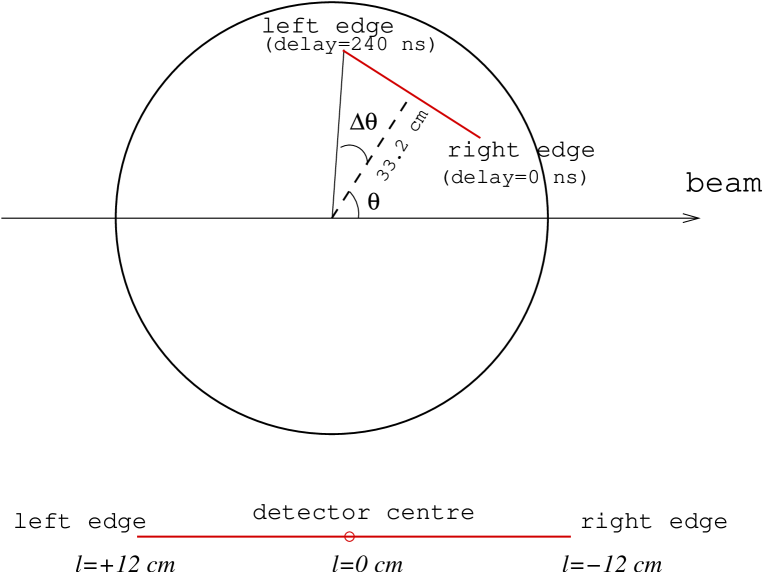
| (3.16) |
Value of the coefficients and are also shown in the figure. It is noted that the second order term has very small effect in calculation of . The position signal was taken from the right edge of the detector. It has been discussed in Chapter 2 that 12 delay line chips, each with 20 ns delay were used in the X-sense wire plane. So the delay at the right edge of the detector was 0 ns while at the left edge was 240 ns. Thus we define a relation between length (l) and delay () for MWPC2 as follows:
| (3.17) |
Therefore the angular off-sets can be found from the delay by the relation:
| (3.18) |
The value of for the channel no of any X-spectrum can be derived from the time difference between the initial channel and channel, i.e.,
| (3.19) |
and are calculated from the channel no () of the spectrum using TDC calibration which has been discussed in the section 3.4. A second order polynomial was fitted to calibrate the TDC channel. The value of and are given by,
| (3.20) |
| (3.21) |
with the value of the coefficients
5.9360, .
The actual angular position is found by adding with . It is to be noted that to use this calibration procedure the calibration data should be taken in singles mode for the full illumination of the detector. Using the TDC calibration it had been checked that the full spectrum corresponds to 240 ns.
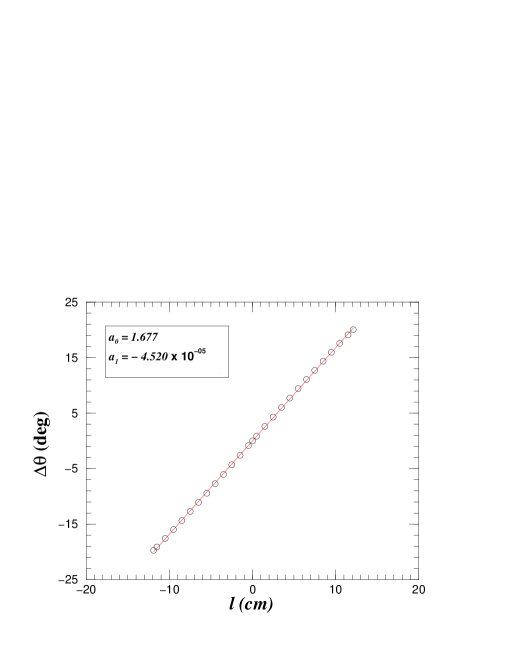
| Position | Length (cm) | |
|---|---|---|
| Right edge | -11.9 | -19.7∘ |
| Wire 1 | -11.5 | -19.1∘ |
| Wire 2 | -10.5 | -17.5∘ |
| Wire 3 | -9.5 | -15.9∘ |
| Wire 4 | -8.5 | -14.3∘ |
| Wire 5 | -7.5 | -12.7∘ |
| Wire 6 | -6.5 | -11.0∘ |
| Wire 7 | -5.5 | -9.4∘ |
| Wire 8 | -4.5 | -7.7∘ |
| Wire 9 | -3.5 | -6.0∘ |
| Wire 10 | -2.5 | -4.2∘ |
| Wire 11 | -1.5 | -2.5∘ |
| Wire 12 | -0.5 | -0.8∘ |
| Centre | 0.0 | 0.0∘ |
| Wire 13 | 0.5 | 0.8∘ |
| Wire 14 | 1.5 | 2.5∘ |
| Wire 15 | 2.5 | 4.2∘ |
| Wire 16 | 3.5 | 6.0∘ |
| Wire 17 | 4.5 | 7.7∘ |
| Wire 18 | 5.5 | 9.4∘ |
| Wire 19 | 6.5 | 11.0∘ |
| Wire 20 | 7.5 | 12.7∘ |
| Wire 21 | 8.5 | 14.3∘ |
| Wire 22 | 9.5 | 15.9∘ |
| Wire 23 | 10.5 | 17.5∘ |
| Wire 24 | 11.5 | 19.1∘ |
| Left edge | 12.1 | 20.2∘ |
3.6 Measurements of mass distributions
The kinematics of the TOF determination of masses is schematically is shown in Fig. 3.15. The masses of the fission fragments were determined from the angles , and TOF information obtained from the experiment using following expressions:
| (3.22) |
| (3.23) |
| (3.24) |
| (3.25) |
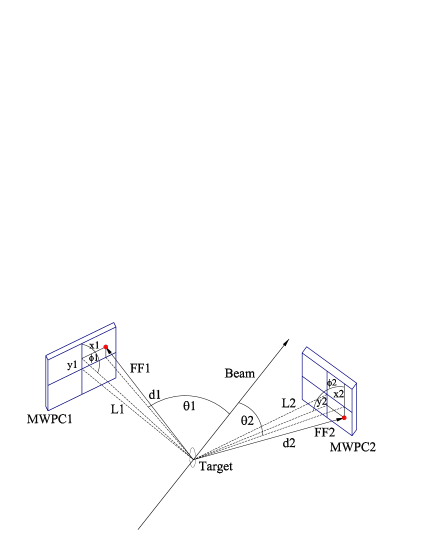
where , are the flight times of the fragments FF1 and FF2 respectively, over flight paths and . These flight paths ( and ) are determined from the distances and and the local coordinates and of the impact points of fission fragments in detectors, MWPC1 and MWPC2. The momentum of the FFs are and in the laboratory frame, while the polar and azimuthal angles were () and () respectively. is the machine delay between the two anode pulses. This was measured from the identity of the mass distributions in the two detectors. , and are the fragment and compound nuclear masses.
The above four expression can be derived from simple kinematics of mass and momentum conservation. This is illustrated in Fig. 3.16. Assumption of mass conservation gives equation 3.23. Equations 3.24 and 3.25 are derived using momentum conservation
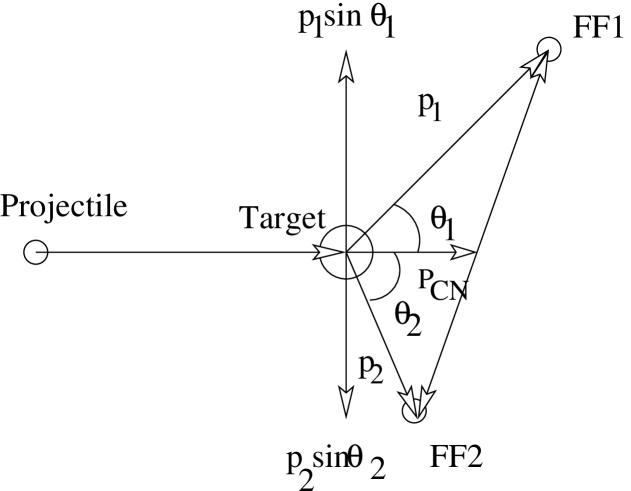
The time of flight difference of the two fission fragments can be written as,
which gives,
| (3.26) |
The experimentally measured time of flight of a fission fragment is basically the sum of exact time of flight and delay () introduced during the experiment by electronic modules and cables and the beam pulse time structure. So, in equation 3.26 and should be replaced by and respectively to get equation 3.22. The difference of and is written as , which is independent of the beam profile.
3.6.1 Mass distributions data analysis
A typical 2-D spectrum, of the time correlation between the two MWPCs for the system 19F + 209Bi measured at lab energy 95.5 MeV is shown in Fig. 3.17.
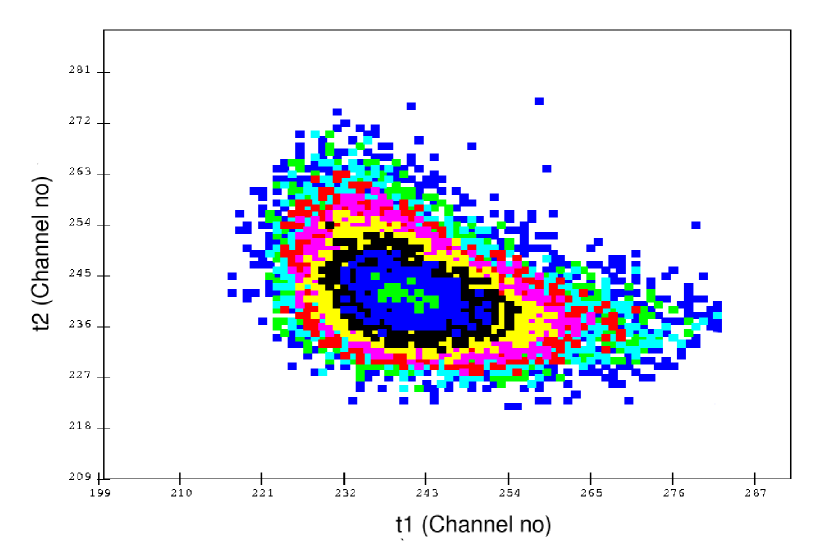
It can be easily observed that events from elastic and quasi-elastic reactions were effectively eliminated and purely binary FFs were selected. Contributions of elastic and quasi-elastic channels were less than 0.5 . Additional elimination of elastic and inelastic channels from fission fragments were obtained from the correlation of energy deposition signals from cathodes of two MWPCs. Fig 3.18 shows the correlation between the energy depositions in the two MWPCs at the same energy. Since the detectors are thin and operated at low pressure, the elastic and quasi-elastic channels have poor response and almost all ( 99 ) the events in the 2-D plot are from fission fragments.
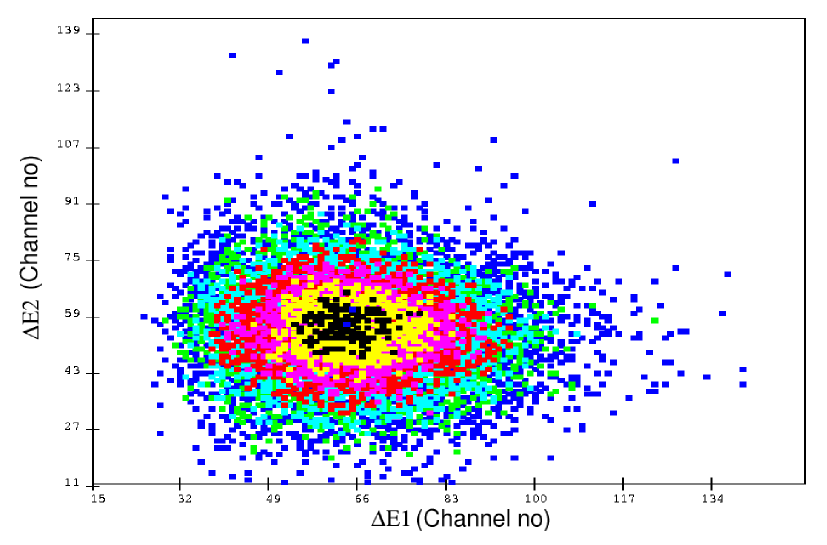
The upper two panels of Fig. 3.19 shows the one dimensional spectrums of the time of flights and . The difference of and which basically determines the mass distribution is shown in the lower panel. A typical 1-D energy spectrum is shown in Fig. 3.20.
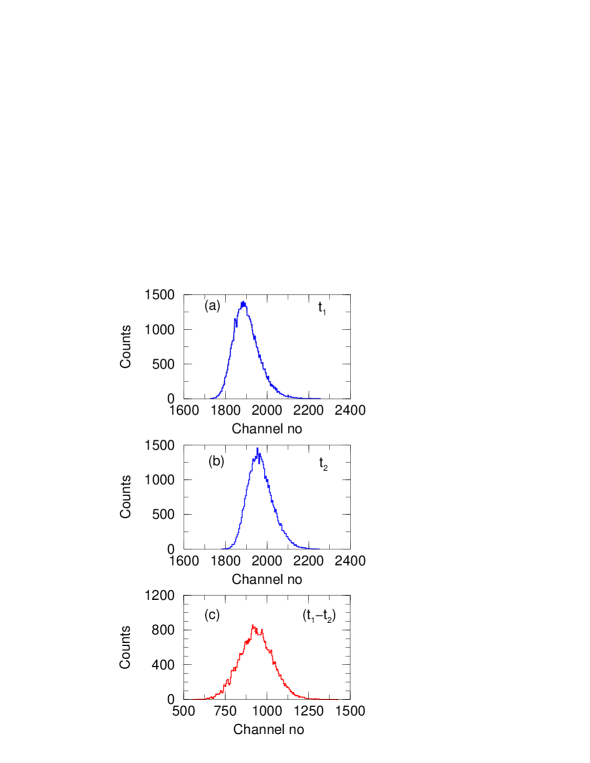
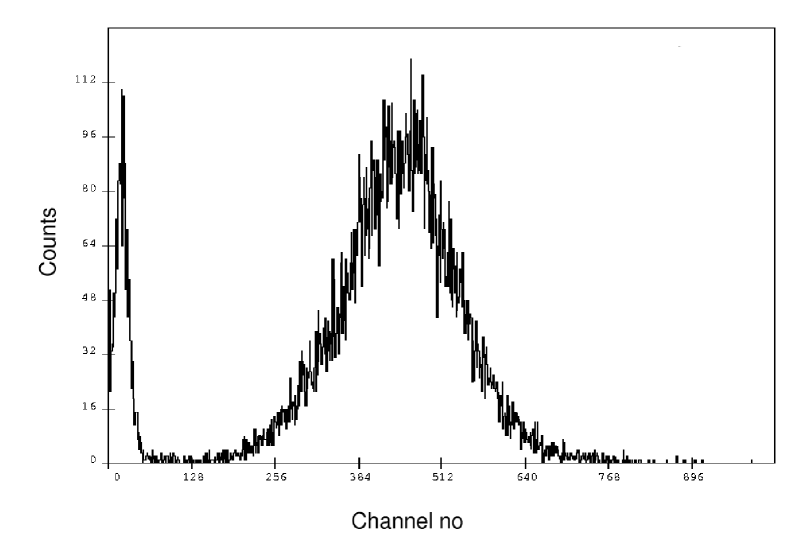
The machine time delays of the anode pulses ( ) from the buncher of the Pelletron varies with the change in the incident energy of the beam. At low bombarding energies, in some specific experimental arrangement (viz., at forward angles) we could determine the machine time delays from the timing spectra of elastically scattered projectiles from the target. In all cases, however, the machine time delays [() i.e., ] and the difference in the TOF of FFs in two MWPCs could be accurately determined from the identity of the mass spectra at the two detectors.
For determining the actual flight paths of the complimentary FFs in two MWPCs, the local co-ordinates of the impact point of the FFs with respect to the centers of the detectors, (, ) for MWPC1 and (, ) for MWPC2, were determined. In addition to the complementarity of the FFs, the correlation of the polar and azimuthal angles of FFs also carry the imprint of the linear momentum of the projectile transferred to the fused system of the projectile and target before fission occurs. A typical 2-D spectrum, taking the X position signals of two MWPCs, is shown in Fig 3.21, in terms of the channel numbers, for the fissioning system 19F + 232Th, measured at the sub-barrier energy ( 88.0 MeV) shows the correlation between the polar angles in two detectors. Two bands, representing the folding angle distributions of two different mechanism,
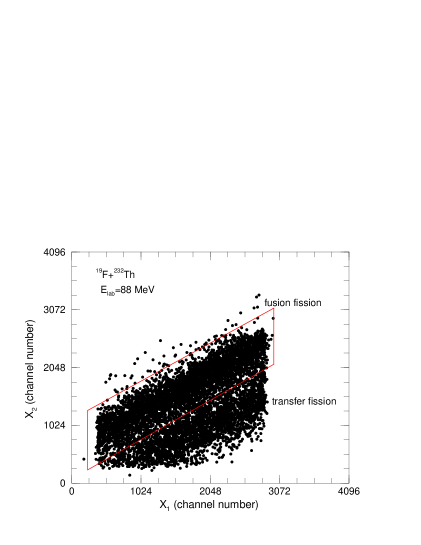
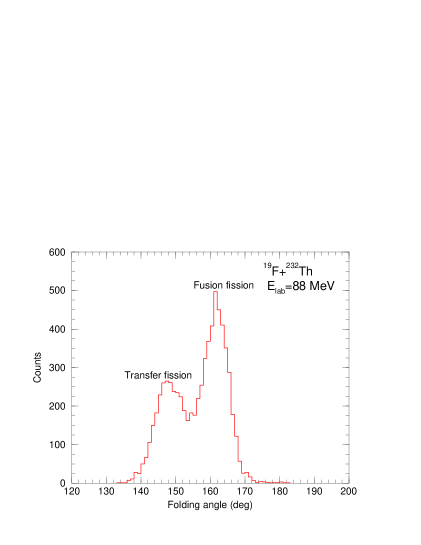
fusion fission and transfer fission, are clearly visible.
For each event, the X positions in the two detectors were transformed to polar angles plugging in the geometrical factors. The resulting distributions of counts as a function of the folding angle is shown in Fig 3.22. In the 1-D spectrum, the two distinct peaks for the fusion fission (FF) and transfer fission (TF) are observed. The position of the peak, marked ”fusion fission” at larger folding angle corresponds with the expected position calculated with symmetric fragment masses and total kinetic energy release in fission according to Viola’s systematics [2] and are due to fission after full momentum transfer from the projectile to the target. The broader structure, marked ”transfer fission”, at lower folding angles signifies a larger momentum transfer than that occurs in the fusion fission, presumable due to the ejectiles emitted in the backward direction after transfer of a few nucleons to the target. The distribution for the transfer fission component is wider than that of the fusion fission component at near and sub-barrier energies due to widely varying recoil angles and velocities.
Similarly correlations in were also monitored during the experiment. Fig. 3.23 shows the correlation between and measured for the fissioning system 16O + 232Th at laboratory energy 82 MeV and confirms full acceptance of the two MWPCs for complementary FFs in azimuthal plane.
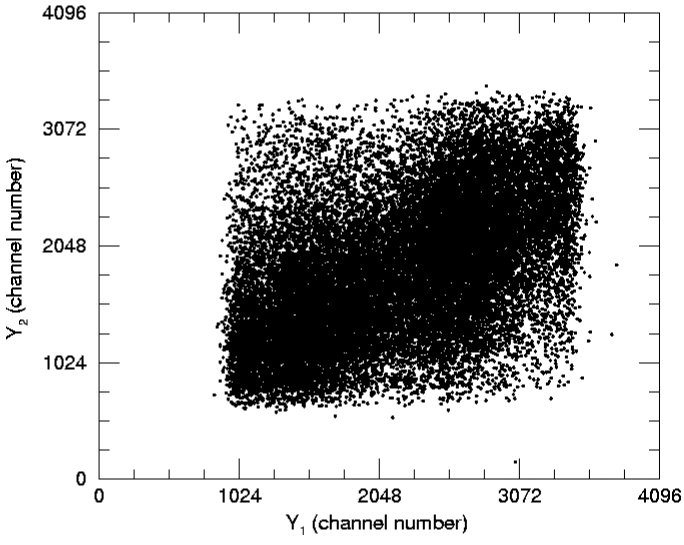
It is to be noted that 19F, 16O, 12C + 232Th reactions had a considerable cross sections for transfer induced events. The fission fragments for fusion fission events were exclusively determined from the distribution of polar and azimuthal angles. The measured polar () and azimuthal () correlations for the fissioning system of 16O + 232Th is shown in Fig. 3.24. The events within the rectangle ”ABCD” were due to fusion fission. However, in 19F, 16O + 209Bi reactions, the transfer fission channel contributes less than 1. This can be observed in Fig. 3.25, where very few events lie outside of the rectangle marked ”abcd” in correlated - distributions of fragments. The projections on and planes are shown in the insets.
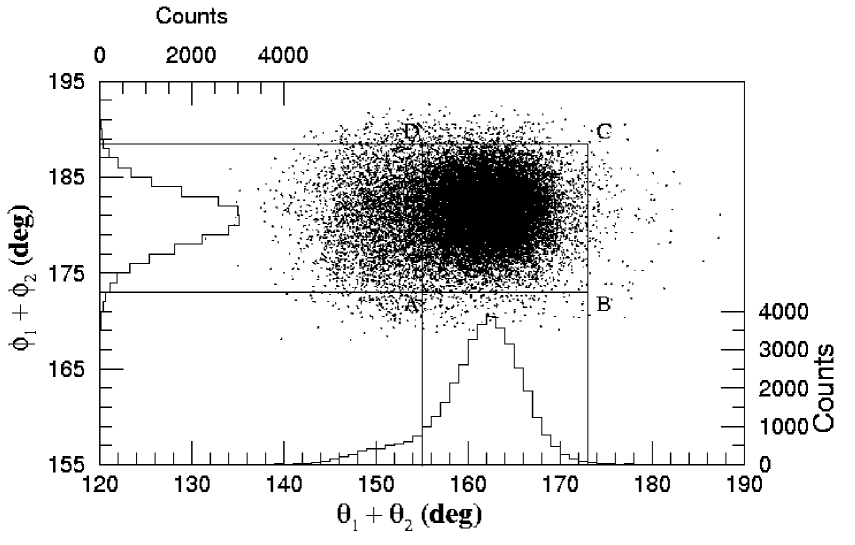

In a very similar analysis, the velocities of the recoiling fissioning system in the reaction plane and perpendicular to it can be used to separate the FF and TF component [11]. The two components of the velocity vector of each fissioning nucleus are determined . The component in the beam direction, was calculated from the folding angle and the velocities of the two fragments. The other component is in the plane perpendicular to the beam and is perpendicular to the projection of the scission axis onto this plane. It was determined from the azimuthal folding angle and the projection of the measured fragment velocities onto this plane.
In Fig. 3.26, the velocities of the fragments are denoted by and , the scattering angles are and , measured with respect to the beam direction. The parallel component of the recoil of the fissioning nucleus is given by , while the component of the recoil velocity perpendicular to the reaction plane is . Initially, it is taken that the two velocity vectors and the beam axis are co-planer which is equivalent to neglecting . In Fig 3.26(a), the velocities in the centre of mass frame are denoted by and while represents the component in the beam direction of the center of mass velocity of the fissioning system. The measured velocity vectors are decomposed into orthogonal components parallel (denoted by and ) and perpendicular (denoted by and ) to the beam axis. The velocity vectors ’s and ’s define the reaction plane for compound nuclear reaction. For compound nuclear reaction is essentially zero while a non-zero value of signifies a non-compound reaction. Thus a scatter plot of versus clearly de-markets the events for compound and non-compound fission events.
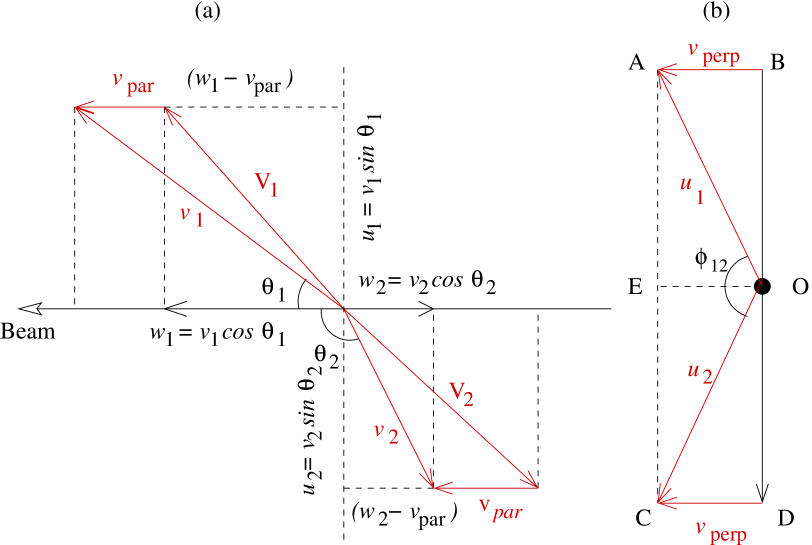
From the figure it is evident, , , and . Neglecting the small effects of prescission particle evaporation, the two fragments are taken as co-linear and co-planer in the centre-of-mass frame, and the ratio
| (3.27) |
can be defined. The minus sign is due to the fact that values (unlike ) can only be positive. Thus is given in terms of the measured velocity component by
| (3.28) |
For fission following complete absorption of the projectile by the target, the full momentum of the projectile is transferred and should be equal to the calculated centre of mass velocity for the collision . However, deviations from binary kinematics due to emission of light particles perturbs the fission fragment vectors, resulting in a significant spread in .
In Fig 3.26 the geometry in the plane perpendicular to the beam is shown. The measured component and are related to the actual velocities of the fragments in the centre of mass frame of the fissioning system by an in-plane vector having two components. From the triangle AOB and AOC we find,
| (3.29) |
| (3.30) |
Combining the above two equations velocities of the fissioning system perpendicular to the scission axis can be written as,
| (3.31) |
For full momentum transfer fission, only the light particle emission causes to deviate from zero which is very small.
Fig 3.27 shows the plot of the measured relative to against for the fissioning system of 19F + 232Th below the Coulomb barrier energy (92.3 MeV). For full momentum transfer fission, the distribution of would be expected to be centered around zero and would be expected to peak around the centre of mass velocity . The high concentration of events in the middle of the plots within the box corresponds to FF events where as the scattered events outside the box are attributed to transfer fission (TF) events.
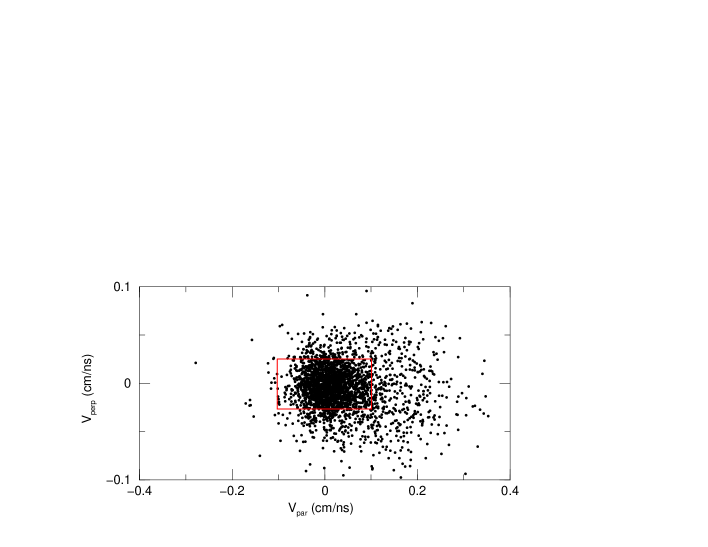
Fig 3.28 shows the comparisons of the separation of FF from TF events using both the procedures which do not show any significant difference of the contours of the FF events. In fact, the coincidence gates on are more compact excluding more transfer fission events than in the correlation of velocities of the fissioning system. We have used the gates on in our experimental analysis and cross checked with - distributions.
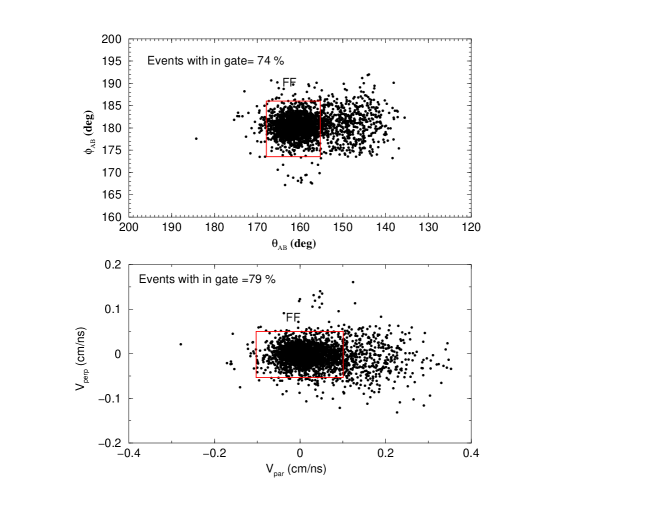
3.6.2 Mass resolution of the spectrometer
The mass resolution depends on errors of time measurements, ( - ) and , and also on the accuracy in measuring the angles , . Contributions of the MWPCs to the timing error is small, less than 250 ps because of short rise time ( 1 ns) and large signal ( 1 Volt for fission fragments) to noise ( 10 mV) ratio of the anode pulse. In fact, the transit time jitter of the primary electrons before striking avalanche is the main contributing factor to prompt resolution of the MWPC. The position resolution in the X-direction is of the order of 400 m and the corresponding polar angular accuracy was about 0.07∘. The accuracy in the azimuthal angle is about 0.15∘. Considering this, the variance () of the delay and the pulse width of the beam bunch are the crucial determining factor for the mass resolution of the TOF. The distribution of is shown in Fig 3.29. The root mean square (r.m.s) value of the distribution was about 420 ps.
The width of the beam bunch was measured by the distribution of delays of gamma rays from the target with fast plastic scintillator. The timing spectrum of gamma rays shows a variance of about 380 ps and is shown in Fig 3.30. The tailing at higher delay was coming from the slow neutrons. The time jitter in MWPC and the triggering time jitter of the event on the bunched beam time structure together with the uncertainty in measuring the machine delays in each TOF arm, defines the ultimate mass resolution of the double arm TOF if the masses are measured from the ratio method [11] [Ratio of the fragment mass ]. However, the difference of the TOF’s in two arms cancels the effect of the beam structure of the bunched beam. The mass resolution for the TOF spectrometer after considering the width of the beam bunch and the response of the detectors and the geometrical factors was found to be 4 a.m.u., which in most cases is sufficient for fission fragment mass distribution studies.
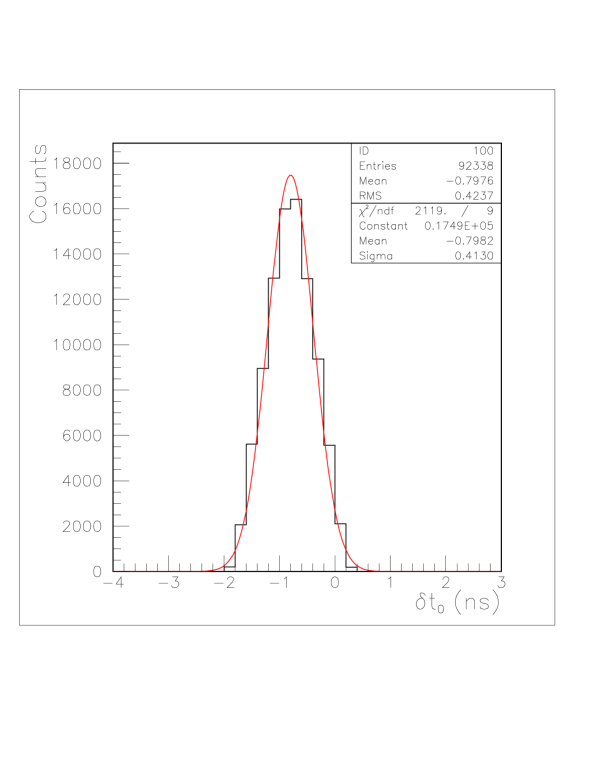
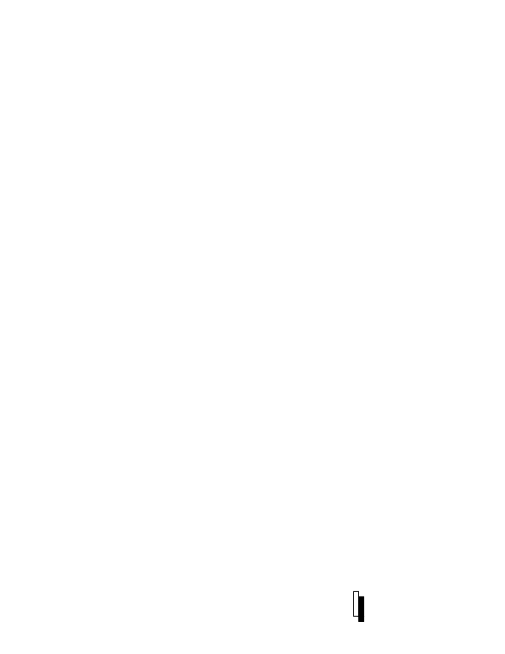
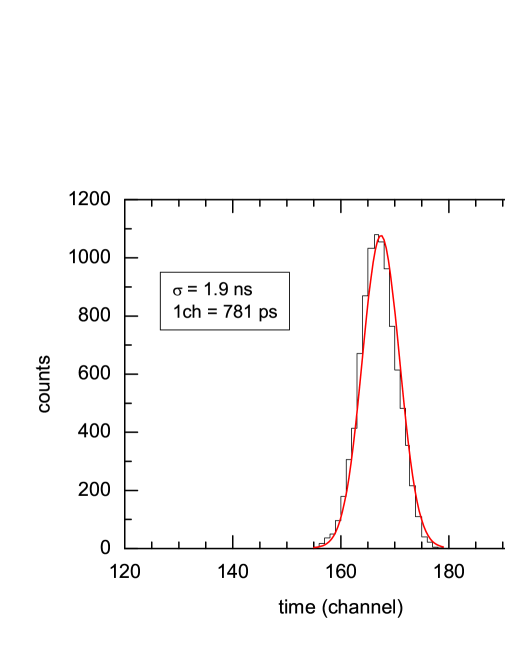
The MWPCs showed very poor response to elastics and only at a larger operating gas pressure and at extreme forward-backward geometry of the two detectors we could get anode pulses for elastics, but the corresponding position signals were poor. For the backward detector at 33.2 cm, the TOF spectrum collected using the bunched beam and the MWPC to observe elastically scattered 64MeV 12C ions is shown in Fig 3.31. The variance () of timing distribution was about 1.9 ns. The time distribution widens because of large acceptance angle of the detector and the mixture of elastic and quasi-elastic particles with a considerable energy spread. Because of the large variance in time, the start time delay in the two detectors, if measured separately, to determine the parameter in equation 2.11, resulted in larger variance ( 2.7 ns) in and hence, worse mass resolution of about 11 a.m.u.
3.6.3 Systematic error
A systematic error on the measured mass depends critically on the geometry of the experimental setup. Any rotation or tilt in the anode wire plane with respect to the reaction plane renders the machine time delay, as a function of X or Y positions ( , and , ) or both, depending upon which of the detector were misaligned. In the Fig 3.32 a plot of Y positions of backward detector is shown against . A straight line fit (solid blue line) clearly shows that the detector was tilted in azimuthal plane.
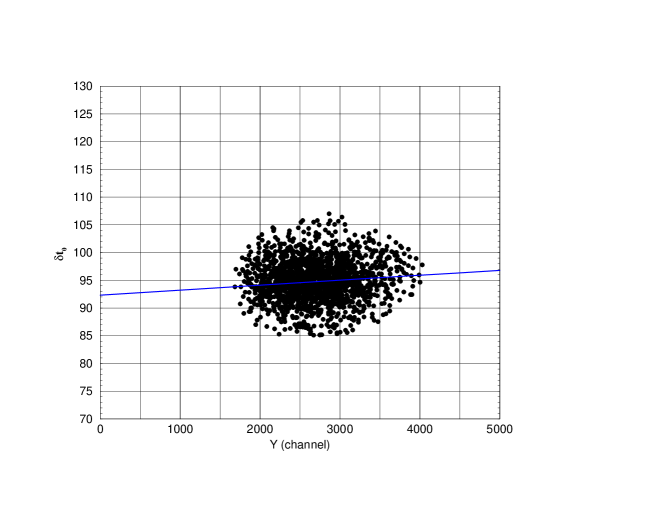
Correlations of the with , , and are shown in Fig 3.33 for the system 19F + 232Th at c.m. energy 92 MeV. Corrections were applied after determining the angle of rotation or tilt of the detectors. For example, from the data of vs , the slope in was found to be 0.01 cm/ns which corresponds to a rotation of 0.14∘ of the MWPC2 about the vertical axis. Similarly, the systematic error due to tilt of the MWPC2 was corrected from the variation of with .
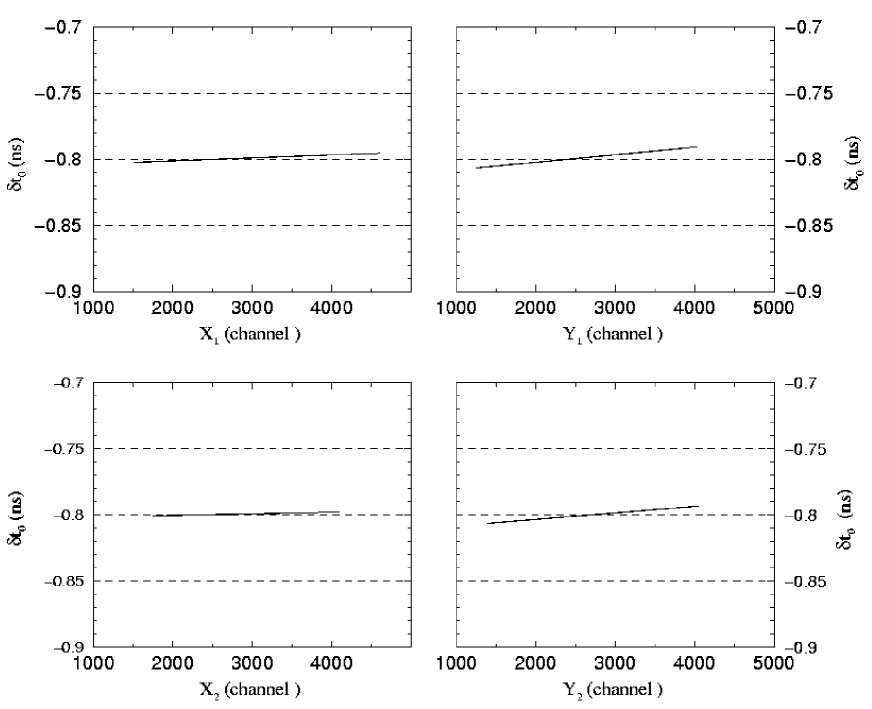
3.7 Measurement of fragment angular distributions
The fission fragment angular distribution is the distribution of yields of fission fragments at different c.m. angles. The measure of angular anisotropy, which can be related macroscopic properties of the nucleus at saddle point, expressed as the ratio of the yields at 0∘ and 90∘ with respect to the direction of beam or that of yields at 180∘ and 90∘.
| (3.32) |
To measure the angular distributions of the fusion fission events, transfer fission events should be exclusively separated using the folding angle measurement technique. However, in this thesis work we have measured the fragment angular distribution for the fissioning system 19F + 209Bi, where the contribution of transfer induced fission events are negligible. The folding angle for the complementary fragments were calculated from the event by event information on their positions. The polar angular correlation of the fission fragments in two MWPCs is shown in Fig. 3.34 for the fissioning system of 19F + 209Bi consists of a clear single band contrary to a double band structure for the fissioning system of 19F + 232Th as shown in Fig. 3.21.The folding angle distribution essentially consisted of a single peak, as shown in Fig. 3.2, since the transfer induced fission channel was populated for this system even at lower energies.
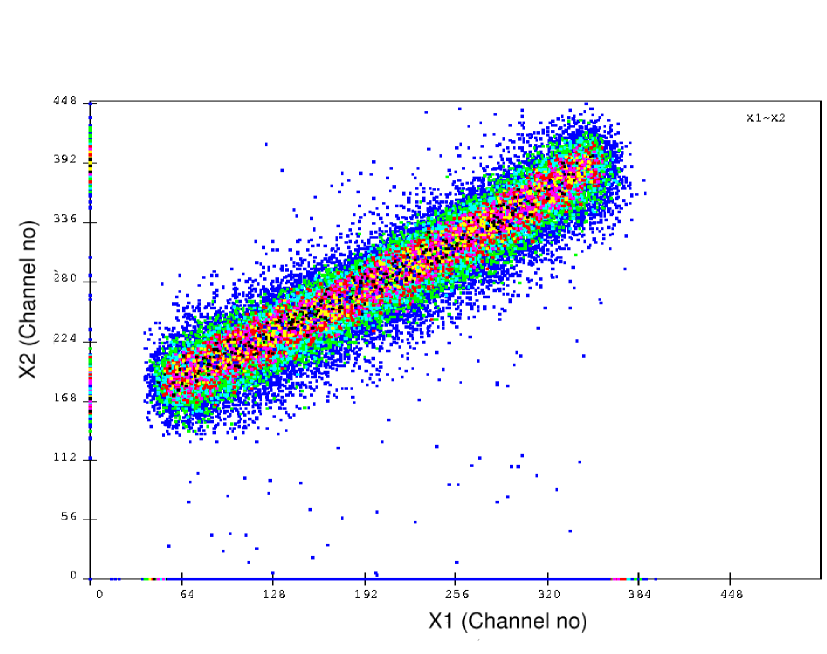
3.7.1 Angular distribution data analysis
The angular distributions were calculated from the distributions of the fission yields as a function of the polar angles. The azimuthal angles being the same for all the polar angles, the Y position co-ordinates of coincident counts (Y1 and Y2) were used only to effectively restrict the active area of the detectors about the reaction plane. Typical two dimensional plot of X1 and X2 are shown in Fig 3.34. The total counts corresponding slices of spectra for a fixed angular interval (e.g. 1∘ or 3∘), translated to the corresponding X1 channels, are determined from 2D spectrum. For each energy, angular distributions were obtained by normalising the fragment counts with geometrical factors and beam intensities. The angular distributions were converted to the c.m. frame using the fragment velocities in the c.m. frame evaluated from the total kinetic energies using Viola’s systematics [2] and recoil of the compound nucleus calculated using the two body kinematics . The anisotropy of the angular distribution was obtained from the ratio of the yields at 0∘ to that at 90∘ to from the fitting of the data with Legendre polynomial up to P6 terms.
3.8 Measurement of excitation function
The excitation function of the fusion fission events is the variation of cross sections of the fragments coming from the fusion fission events as a function of incident energy. In this thesis work we have measured the excitation function for the system 19F + 209Bi and compared with coupled channel calculations. To measure the excitation function for the fusion fission events, folding angle measurement technique was essentially the basic procedure to follow to separate the fusion fission events from the transfer induced fission events. However, it has be mentioned earlier that the transfer component in the total cross section is negligible in the reaction for this system. The total yields of the fusion fission events were obtained by integrating the fragment angular distribution functions over the angular range 0∘ to 90∘ and calculating the fission cross section in comparisons to elastic yields which was monitored on two solid state detectors at to the beam.
Bibliography
- [1] D.C.Biswas, R.K.Choudhury, B.K. Nayak, D.M.Nadkarni, V.S.Ramamurthy, Phys. Rev. C 56, 1926 (1997).
- [2] V.E. Viola, K. Kwiatkowski and M. Walker, Phys. Rev. C 31 1550 (1985).
- [3] D. Swan, J. Yurkon, D.J. Morrissey, Nucl. Instr. and Meth. A 348, 314 (1994)
- [4] A. Arefiev, G. Benczea, A. Bizzetib, E. Choumilovd, C. Civininib, R. D’Alessandrob, F. Dalla Santaa, M. Della Negraa, A. Ferrandoc, M. C. Fouza, A. Hervea, A. Iglesiasa, Yu. Kolotaevd, A. Malinind, L. Martinez-Lasoc, M. Meschinib, D. Peacha, V. Pojidaevb, E. Radermachera, A. Rozjkovd, C. Seeza, F. Szoncsoe, G. Wrochnaf and C. -E. Wulze , Nucl. Instr. and Meth. A 348, 314 (1994).
- [5] H. Kumagai, A. Ozaw, N. Fukuda, K. S mmerer and I. Tanihata, Nucl. Instr. and Meth. A 470, 562 (2001).
- [6] M. Ahmad, S. L. Graham, S. M. Grimes, R. Longfellow, H. Satyanarayana and G. Randers-Pehrson, Nucl. Instr. and Meth. A 228, 349 (1985).
- [7] J. Terrell, Phys. Rev. 127, 880 (1962).
- [8] S. Kailas, A. Navin, A. Chatterjee, P. Singh, R. K. Choudhury, A. Saxena, D. M. Nadkarni, S. S. Kapoor, V. S. Ramamurthy, B. K. Nayak, and S. V. Suryanarayana, Phys. Rev. C 43, 1466 (1991).
- [9] Huanqiao Zhang, Zuhua Liu, Jincheng Xu, Ming Ruan, and Kan Xu, Nucl. Phys. A538, 229c (1992).
- [10] Nayana Majumdar, PhD thesis, Investigations on Heavy Ion Induced Fission of Heavy Nuclei at Near and Sub-Coulomb Barrier Energies , University of Calcutta, India (1997)
- [11] D.J. Hinde, M. Dasgupta, J.R. Leigh, J.C. Mein, C.R. Morton, J.O. Newton and H. Timmers, Phys. Rev. C 53, 1290 (1996).
Chapter 4 Results
The mass distributions observed in heavy ion induced fission reactions are generally of symmetric shape because the compound nucleus is generally formed with large excitation energy () well above the fission barrier. The fragment shell effects observed in the mass distributions in the case of spontaneous and neutron or light heavy ion induced reactions at lower bombarding energies are not evident in the case of heavy ion induced reactions, due to washing out of the shell effects at high excitation energy and angular momenta brought into the fissioning composite system by the heavy ions. In general, an average increase in the width of the mass distribution is observed with the increase in the excitation energy of the fissioning nucleus [1, 2]. It has also been shown in earlier studies that the mass distributions of fission fragments in heavy ion induced fission may provide information on the reaction mechanism involved in the fission process, due to admixture of fully equilibrated compound nuclear events and non-compound nuclear reactions such as fast fission [3], quasi-fission [4] and pre-equilibrium fission etc [5, 6]. Mass distributions following such an admixture would be expected to be broader than those for normal fission, because non-compound fission reactions are expected to have more asymmetric component arising due to incomplete equilibration in mass degree of freedom.
4.0.1 Salient features of the different target projectile combinations:
The nucleus 232Th is deformed with quadrapole deformation parameter 0.217 while 209Bi is a spherical nucleus. Large deviations from the statistical theory [8] predictions in fragment anisotropy were reported [9, 10, 11, 12] for deformed 232Th target, while the those for spherical 209Bi target followed [7, 13, 14] the statistical prediction. For the spherical bismuth target, the entrant system is compact for any orientation whereas the entrance channel compactness in shape changes quite appreciably for the impact point of the projectile changing from equatorial to polar regions of the prolate thorium nuclei. The mass asymmetry parameters (defined as ()/() where and are the masses of the target and projectile respectively) for the systems 19F + 232Th (0.85) and 16O+232Th (0.87) are less than the Businaro Gallone critical value (0.90 for both systems). Thus for these two systems mass flow is from target to projectile. But (0.89) for the 12C + 232Th system and the flow of mass is from the projectile to the target. Thus the mass flow for 12C is opposite to that of 16O and 19F nuclei. However the expected mass flows are from target to projectile for both 19F + 209Bi ( 0.83 and 0.88) and 16O + 209Bi ( 0.86 and 0.88) system.
4.1 Results for 16O + 209Bi
Fission fragment mass distributions were studied for this system at six bombarding energies of the projectile near and below the Coulomb barrier. The component of transfer induced fission is expected to be quite small due to large fission barrier heights ( 10 to 12 MeV) of the target like fissioning nuclei in this mass region. The measured folding angle distributions and Gaussian fits to the experimental points at all energies are shown in Fig. 4.1. It is observed that the folding angle distributions are essentially single peaked and the events are almost entirely from the fission following complete fusion. It is found that the peak of the measured distribution matches with the calculated folding angle using Viola’s systematics [15] assuming binary fission.
The mass distributions calculated from the experiment following the procedure discussed in Chapter 3, at different centre of mass energies are shown in Fig. 4.2 at 81.6, 79.8 and 78.0 MeV, and Fig. 4.3 at 76.2, 74.4 and 72.6 MeV. It is observed that the mass distributions are in general symmetric in shape peaking around /2 where is the mass number of the compound nucleus. The width of the mass
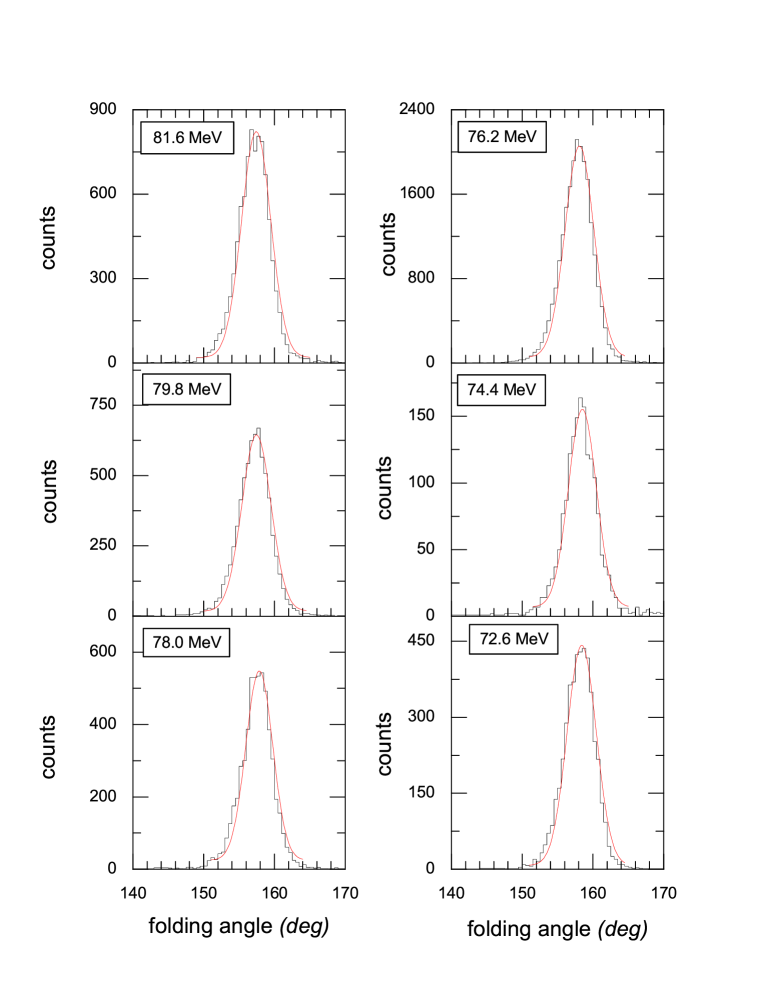
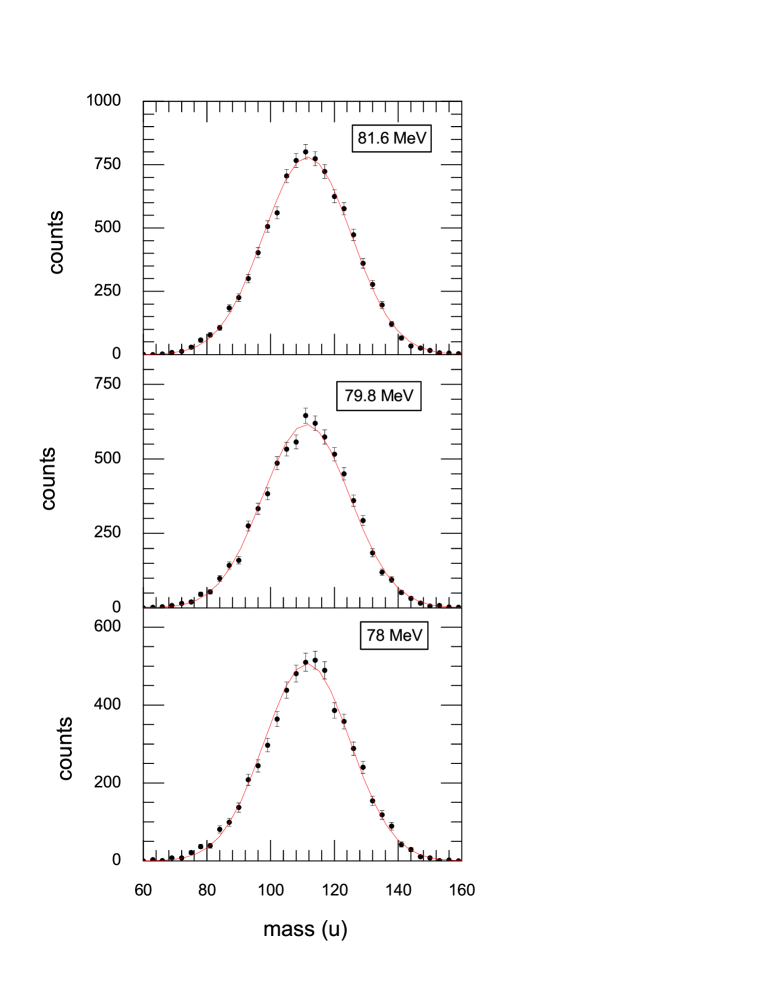
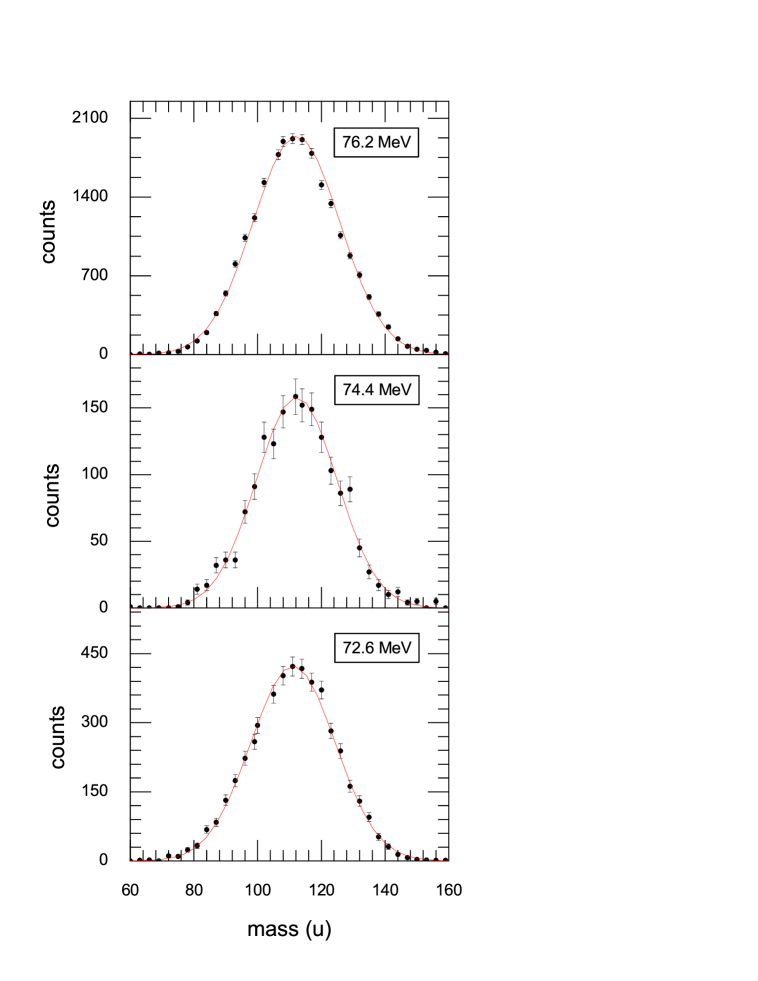
distributions were determined by fitting the spectra with Gaussian distribution. The values of the measured variance of the mass distributions at different bombarding energies of the projectile is tabulated in table 4.1. Fig. 4.4 shows the variance of the fitted Gaussian, , to the experimental masses as a function of the c.m. energy for the system 16O + 209Bi. It is seen that the variance of the mass distributions increases very slowly with increase in .
| (MeV) | (MeV) | (MeV) | () | |
|---|---|---|---|---|
| 90.0 | 81.6 | 1.09 | 34.3 | 189.8 10.9 |
| 88.0 | 79.8 | 1.07 | 32.5 | 187.8 11.9 |
| 86.0 | 78.0 | 1.05 | 30.7 | 181.2 09.0 |
| 84.0 | 76.2 | 1.02 | 28.9 | 185.6 15.1 |
| 82.0 | 74.4 | 0.99 | 27.1 | 160.9 14.9 |
| 80.0 | 72.6 | 0.97 | 25.3 | 175.0 20.0 |
L.M.Pant et al., measured [16] the mass distributions for the system 16O + 209Bi system at four bombarding energies near the Coulomb barrier. The variation of variances of the mass distributions , measured by Pant et al. is shown in Fig. 4.4 along with our measurement. It is seen that their measurements match well with our measurement at the overlapping energies. However it may be noted that Pant et al measured fragment masses by finding the kinetic energies of complementary
fragments. The present results for are, however, somewhat systematically higher than the that reported by Choudhury et al., [18] for the 16O + 209Bi system. From our measurements, we conclude that for this system the width of the fragment mass distributions varies smoothly with increasing excitation energy.
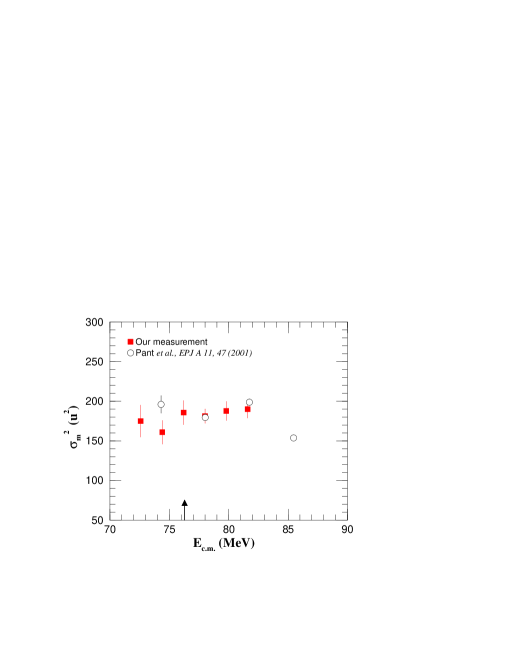
4.2 Results for 19F + 209Bi
Fission fragment mass and angular distributions has been measured for this system over a range of bombarding energies from 86 MeV to 100 MeV in laboratory frame,simultaneously in the same experimental setup.
4.2.1 Mass distributions
Fission fragment mass distributions were measured for this system at six bombarding energies. For the fissioning system 19F + 209Bi, the non-compound nuclear fission channel following the transfer of a few nucleons is expected to be quite small . In the present measurement, it showed no significant contribution up to 5 MeV below the Coulomb barrier. The experimental folding angle distributions at forward positions about 55∘ of the first detector are shown in fig 4.5. It is observed that all the distributions are single peaked and all the events are from the fission following complete fusion.
The measured mass distributions are shown in Fig. 4.6 at 91.2, 87.5 and 85.7 MeV and in Fig. 4.7 at 83.9, 82.0 and 80.2 MeV . The distributions were fitted with a Gaussian function. It is seen that the mass distributions were symmetric in shape with centroid around /2. We have not observed any significant departure from a single Gaussian fit even at lowest energies. The width of the mass distributions were derived from the fitted Gaussian distributions and the values of are tabulated in the table 4.2.
The variation of the variances of the mass distributions is shown in Fig. 4.8. It is observed that the variation in variance of the mass distributions with beam energies to be linear with small slope.
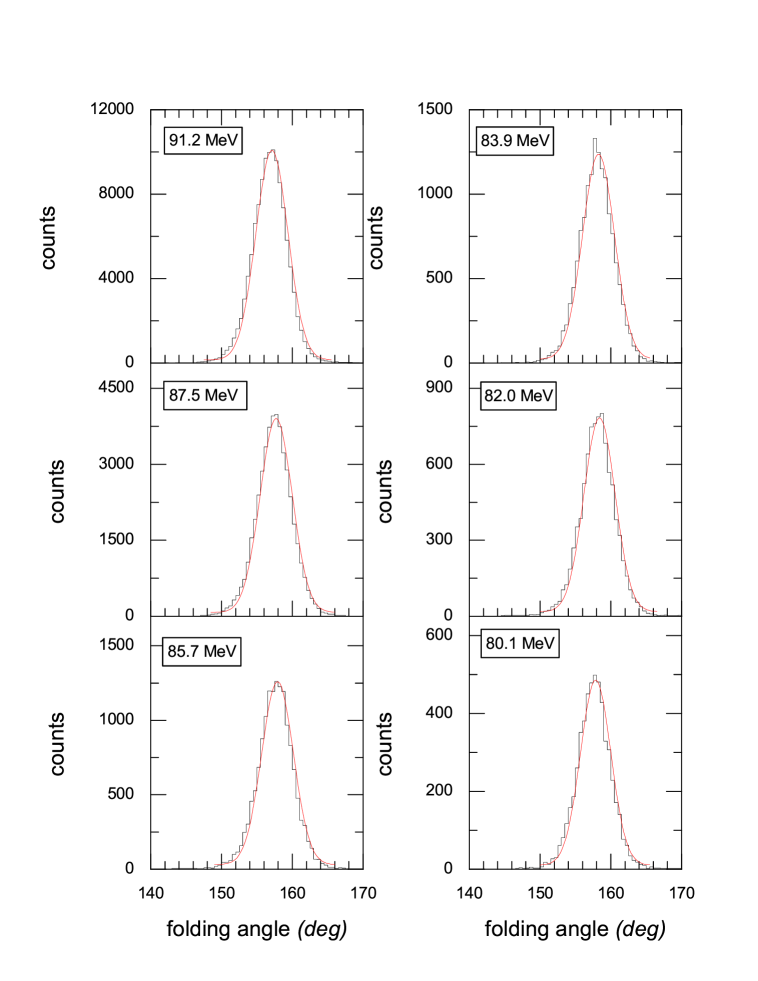
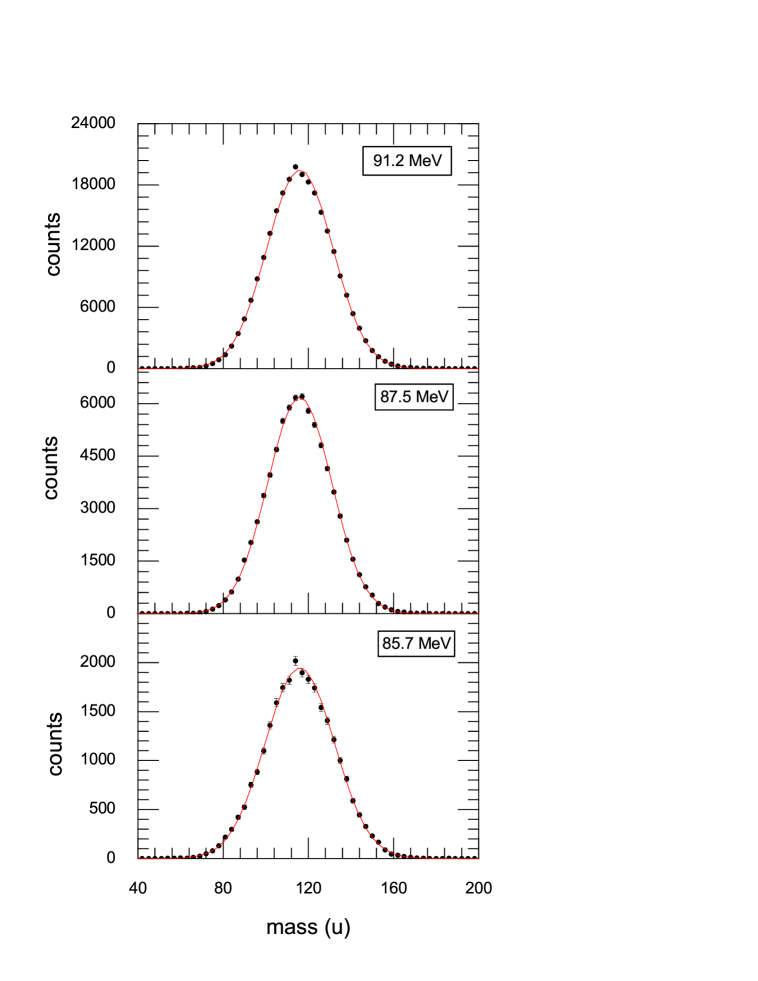
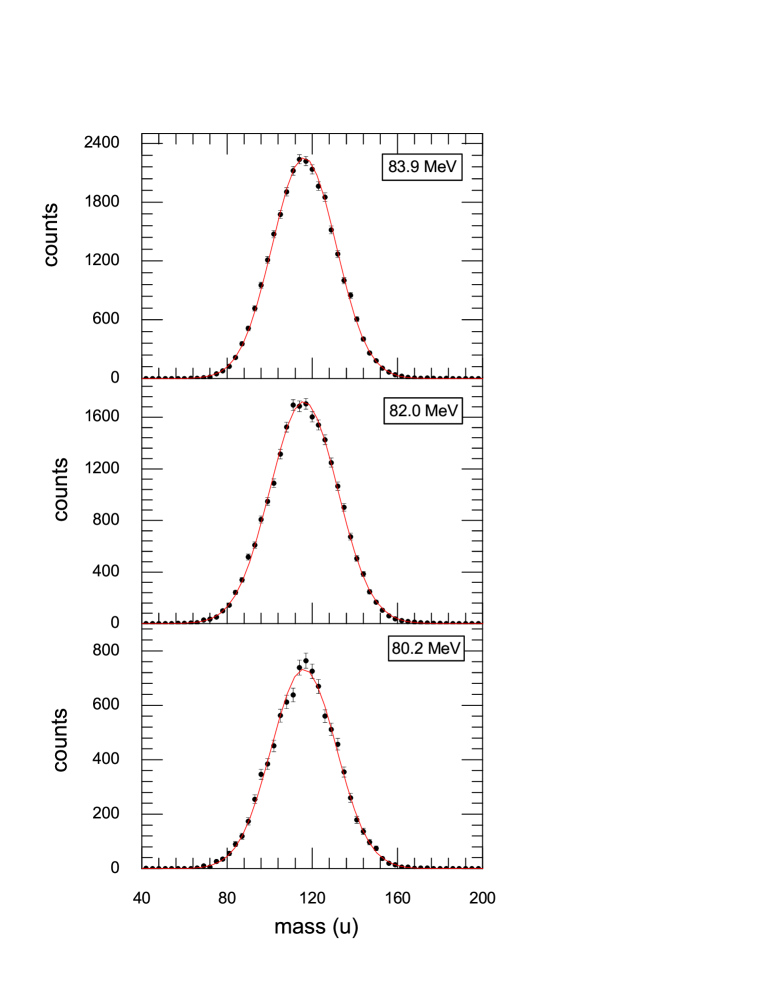
The measured variation in by L.M. Pant et al., is shown by open circle in the Fig 4.8. In their measurement an increase in variance of the mass distributions was reported near the Coulomb barrier. The increase in was shown to correlate with the variation of the fragment kinetic energy with the bombarding energy near the Coulomb barrier. However, no anomaly in the variance of the mass distributions was observed in our measurement.
It is to be noted that the measurement of Pant et al., were performed using technique. Thus fission fragment mass distributions were derived form the measured kinetic energies of the fission fragments.
| (MeV) | (MeV) | (MeV) | () | |
|---|---|---|---|---|
| 99.5 | 91.2 | 1.07 | 42.2 | 244.3 09.2 |
| 95.5 | 87.5 | 1.03 | 38.6 | 229.8 08.9 |
| 93.5 | 85.7 | 1.01 | 36.7 | 269.3 10.7 |
| 91.5 | 83.9 | 0.98 | 34.9 | 231.6 09.1 |
| 89.5 | 82.0 | 0.97 | 33.1 | 259.2 09.3 |
| 87.5 | 80.2 | 0.95 | 31.2 | 238.4 11.4 |
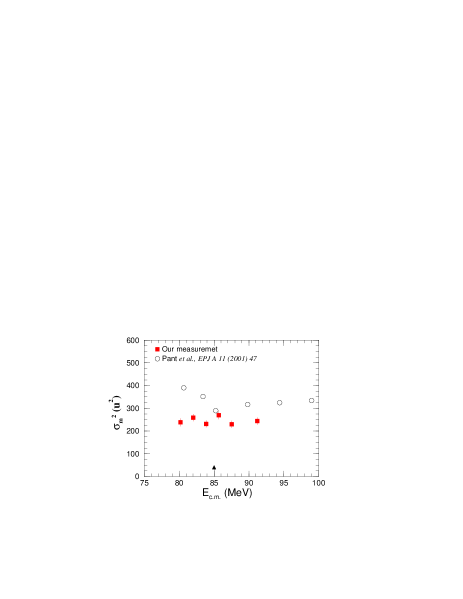
4.2.2 Angular distribution
The fragment angular distributions were measured at seven bombarding energies. The angular distributions for all the events in the c.m. frame are shown in Fig. 4.9 for all the bombarding energies after kinematic transformation from the lab. frame. The calculation of the transformation factor has been discussed in the previous chapter. The fusion fission yields are shown by the open symbols.
To calculate the anisotropies of the angular distributions, they were fitted with Legendre polynomials up to terms (solid red lines). From the fitted values of the yields at 0∘ and 90∘, the anisotropies of the angular distributions were calculated. The anisotropies obtained from distributions, fitted with polynomials up to terms did not change significantly and were within statistical error limits.
The values of the calculated anisotropies () of the measured angular distributions at all bombarding energies are given in table 4.4. The theoretical anisotropies (), calculated following the SSPM are also shown in the table. The values were corrected for pre-saddle neutron multiplicities. The values of pre-saddle neutrons which lead to cooling at the saddle-point, have been taken from the works of Rossner et al., [20] who have determined these from actual measurements for 16O + 208Pb system. The calculated values of the corrected excitation energies, corrected temperatures and corrected variances of the K-distribution, along with some of more physical quantities are given in table 4.3. The method of calculation of the relevant parameters are described in Appendix.
The values of the anisotropies for the system 19F + 209Bi as a function of c.m. energy are shown in Fig. 4.10, illustrated by solid circles. The predicted values of anisotropies according to SSPM, incorporating the correction for pre-scission neutron emission are shown by solid line. The trend of the anisotropies obtained in the present measurement for the system 19F + 209Bi was found to be similar to that observed by Samant et al., [7]. The values of the measured anisotropies by Samant et al. are
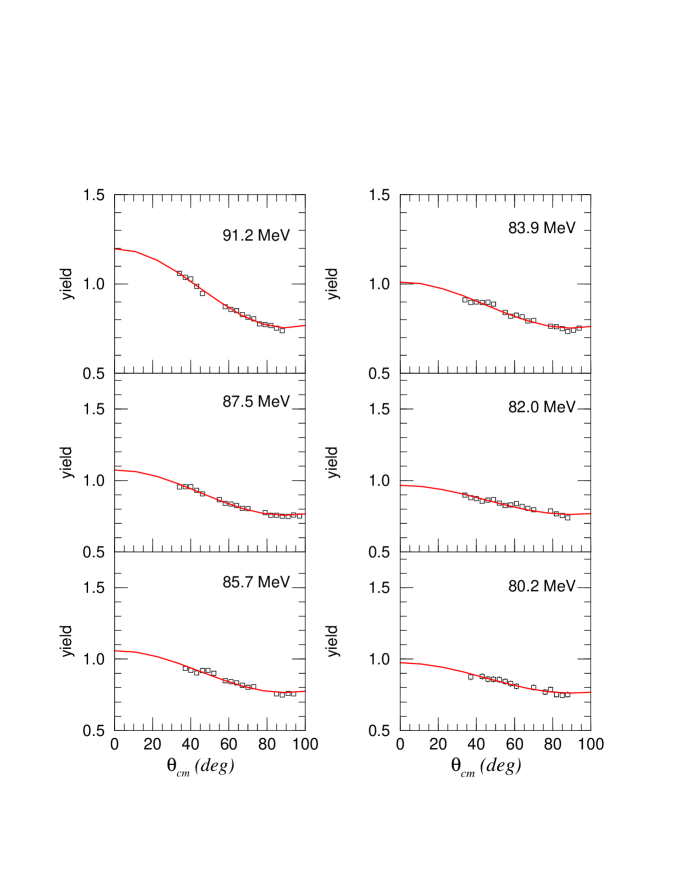
shown by open triangles in Fig 4.10. The dashed line represents the calculation which does not include the neutron emission correction. It is found that the calculation which included the pre-scission neutron emission provides a better description of the anisotropy data.
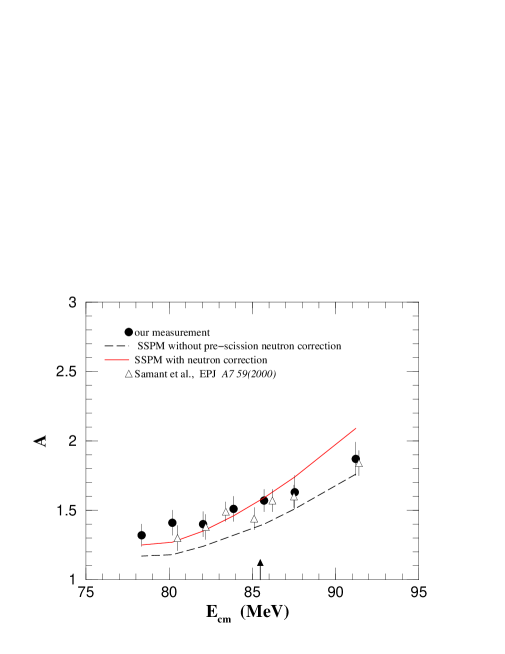
| (MeV) | (MeV) | (MeV) | (MeV) | (MeV) | (MeV) | () | ||
|---|---|---|---|---|---|---|---|---|
| 91.2 | 42.23 | 2.23 | 1.25 | 22.16 | 3.67 | 0.90 | 1.145 | 122.14 |
| 87.5 | 38.56 | 2.05 | 1.19 | 20.36 | 3.93 | 0.85 | 1.134 | 114.25 |
| 85.7 | 36.72 | 1.97 | 1.15 | 19.38 | 4.06 | 0.82 | 1.131 | 109.92 |
| 83.9 | 34.88 | 1.88 | 1.12 | 18.45 | 4.15 | 0.79 | 1.130 | 105.81 |
| 82.0 | 33.05 | 1.77 | 1.08 | 17.72 | 4.21 | 0.77 | 1.127 | 102.86 |
| 80.2 | 31.21 | 1.70 | 1.04 | 16.62 | 4.28 | 0.74 | 1.125 | 98.67 |
| 78.3 | 29.36 | 1.59 | 1.00 | 15.85 | 4.30 | 0.71 | 1.125 | 94.68 |
| (MeV) | (MeV) | (coup) | (corr) | |||
|---|---|---|---|---|---|---|
| 99.5 | 91.2 | 1.07 | 534.19 | 122.14 | 2.09 | 1.87 |
| 95.5 | 87.5 | 1.03 | 339.05 | 114.25 | 1.74 | 1.63 |
| 93.5 | 85.7 | 1.01 | 257.40 | 109.92 | 1.59 | 1.57 |
| 91.5 | 83.9 | 0.98 | 195.93 | 105.81 | 1.46 | 1.51 |
| 89.5 | 82.0 | 0.97 | 143.80 | 102.86 | 1.35 | 1.40 |
| 87.5 | 80.2 | 0.95 | 105.80 | 98.67 | 1.27 | 1.41 |
| 85.5 | 78.3 | 0.93 | 96.69 | 94.68 | 1.25 | 1.32 |
4.3 Result for 19F + 232Th
Fission fragment mass distributions were precisely measured for the fissioning system of 19F + 232Th at thirteen energies from above to below Coulomb barrier in the energy range 105.4 - 84.2 MeV in lab. frame. A large contribution from the target-like fragment fission (TLFF) events for the system, 19F + 232Th, was reported by Leigh et al., [25]. Measurement of N. Majumdar et al., [26] showed contribution of TLFF channel of approximately 20 of the total fission yield at energies around the Coulomb barrier and it amounted to almost 85 of the total yield at deep sub-barrier regime. For this system, the folding angle measurement technique was of utmost interest to separate the FFCF events from all non-compound fission channels. This technique was extensively used [27, 11] in the measurements for this system where the chance of admixture of non-compound nuclear fission with the FFCF events were eliminated .
The folding angle distributions of the fission fragments for forward position around 65∘ of the forward detector are shown in Fig. 4.11. The experimental distributions show the distinction between FFCF and TLFF yields. It is seen that the position of the experimentally observed peaks matches with the simulated peaks of the folding angle distribution of the FFCF events. Below Coulomb barrier, the distributions at lower folding angles represent the folding angle distributions of the TLFF events. The distribution for the TLFF component is wider than that of the FFCF at near and sub-barrier energies due to widely varying recoil angles and velocities.
As discussed in Chapter 3, transfer fission fragments can be separated from the FFCF from the distributions of the parallel component and perpendicular velocity component of the fissioning nucleus. In Fig. 4.12 we have shown the separation of FFCF and TLFF events in both and plane at three representative energies.

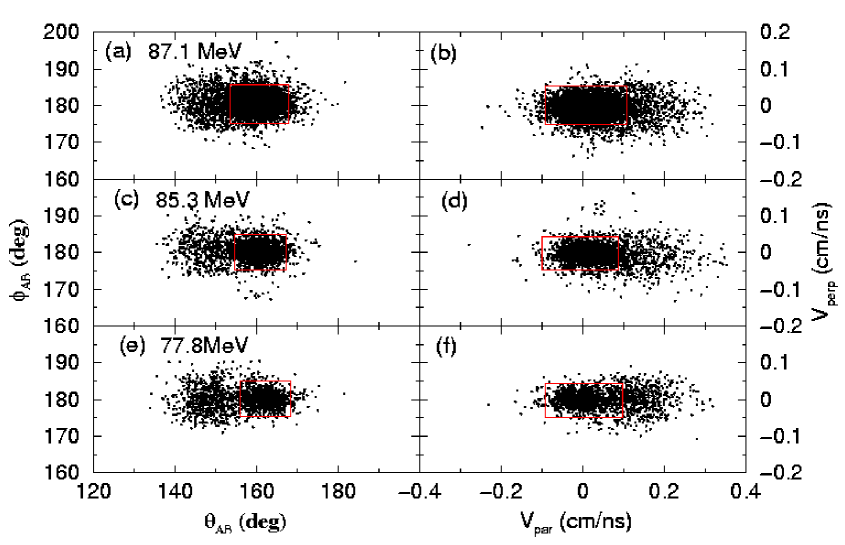
Table 4.5 shows the events used to calculate the variance of the mass distributions using both the gates in angles and velocities of the fissioning system. It is observed that the coincidence gates on are more compact, excluding more TF events than in the correlation of velocities of the fissioning system.
| Events within gate | Events within gate | |
| (MeV) | () | () |
| 87.1 | 75 | 84 |
| 85.3 | 74 | 79 |
| 77.8 | 42 | 49 |
The mass distributions of the FFCF reaction are shown in Fig. 4.13 and Fig. 4.14 for the different incident energies in the c.m. frame. The yields shown by the solid circles, are shown at a mass bin of 3 amu. To obtain the variance of the mass distributions, the distributions were fitted with Gaussian distributions. The solid line show the fits to the data. It is observed the distributions at all energies can be well fitted with a single Gaussian with peak close to the half of the combined target plus projectile mass. We have not observed any significant admixture of an asymmetric mass distribution in the measured mass distributions.
The variation of the variance of the fitted Gaussians to the experimental masses as a function of c.m. energies are shown on Fig. 4.15 and the values are tabulated in table 4.6. Above the fusion barrier, decreases with decrease in energy. However as the energy is decreased below the barrier, a sudden, almost 50 increase in the value of is observed. With further decrease to sub-barrier energies, remains nearly constant with a small decreasing trend. However these values are substantially larger than the value at the barrier.
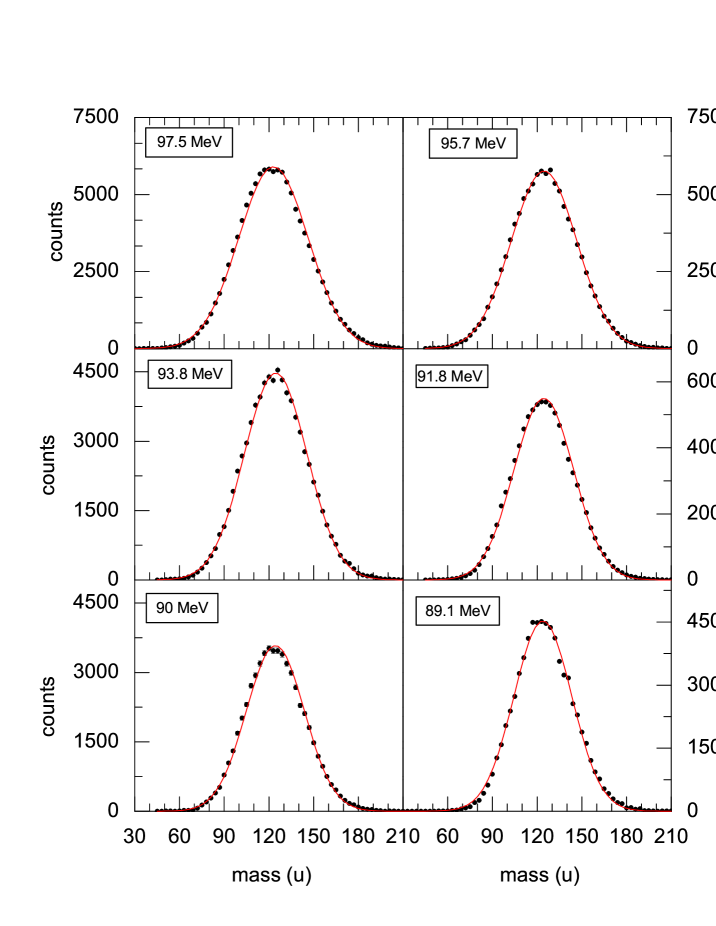
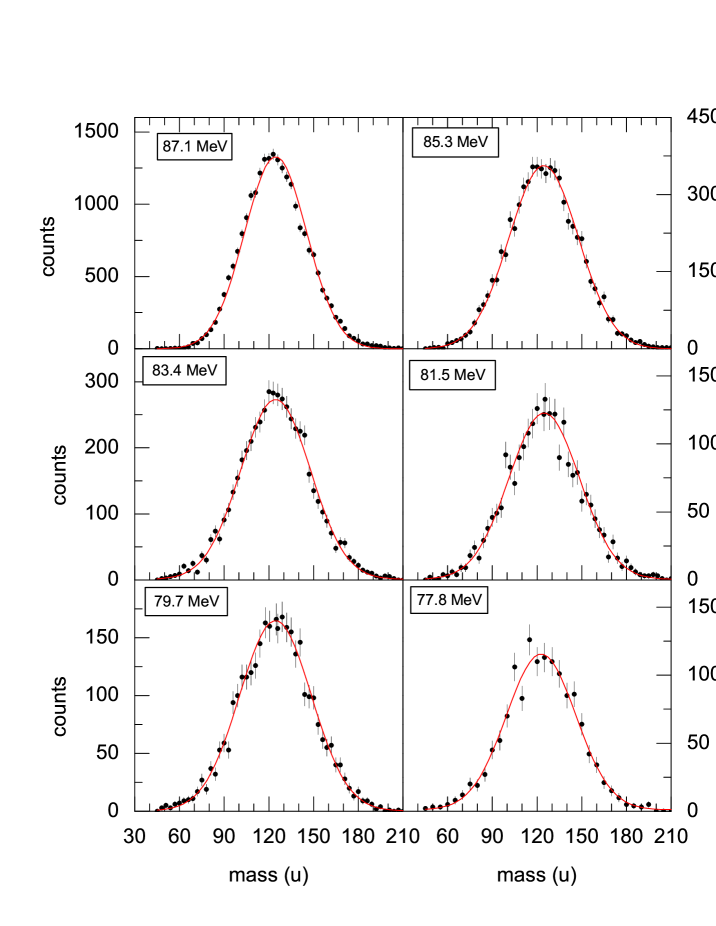

The mass distributions for transfer fission is double humped (shown in Fig. 4.16. So it is important to ensure that the admixture of TF component was not going to affect the values for FFCF reactions. Hence the effect of the admixture of TF was also investigated for the 19F + 232Th reaction.
| (MeV) | (MeV) | (MeV) | ||
|---|---|---|---|---|
| 105.4 | 97.5 | 1.07 | 56.95 | 574.56 13.42 |
| 103.4 | 95.7 | 1.05 | 55.15 | 484.88 12.11 |
| 101.4 | 93.8 | 1.03 | 53.25 | 443.52 11.58 |
| 99.3 | 91.8 | 1.01 | 51.25 | 398.00 10.77 |
| 97.3 | 90.0 | 0.99 | 49.45 | 377.91 10.88 |
| 96.3 | 89.1 | 0.98 | 48.55 | 372.87 10.62 |
| 95.2 | 88.1 | 0.97 | 47.55 | 380.64 10.73 |
| 94.3 | 87.1 | 0.96 | 46.55 | 429.73 12.23 |
| 92.3 | 85.3 | 0.94 | 44.75 | 538.70 16.24 |
| 90.2 | 83.4 | 0.92 | 42.85 | 543.82 17.72 |
| 88.2 | 81.5 | 0.89 | 40.95 | 556.01 20.98 |
| 86.2 | 79.7 | 0.87 | 39.15 | 553.66 18.82 |
| 84.2 | 77.8 | 0.85 | 37.25 | 529.92 23.01 |

It has been discussed in chapter 2 that fission fragments from compound nuclear fission events can be exclusively determined from the distributions of polar () and azimuthal () angles. The observed distributions of the complementary fission events in (,) plane are shown in Fig 4.17 for the 19F + 232Th system at 85.3 MeV . The events enclosed by rectangle ABCD in the figure are the fragments from fusion fission reaction. The projections on and planes are shown in the insets. At different energies, the window on the folding angles of the fission fragments were varied to estimate the effect of any admixture of non compound fission channels. In Fig 4.18 the measured variances of the fission mass distributions are shown as a function of the admixture of transfer followed by fission (TF) events at different c.m. energies. The width of the distribution for any energy shows a slow increase (less than ) with admixture of TF events. Even at lower energies the contribution of transfer fission events does not affect the mass distributions significantly. The slow and linear increase in values with increasing admixture of TF events as shown in Fig 4.18 clearly indicates that the observed anomalous variation in with energy for the deformed target can not be due to admixture of TF events.
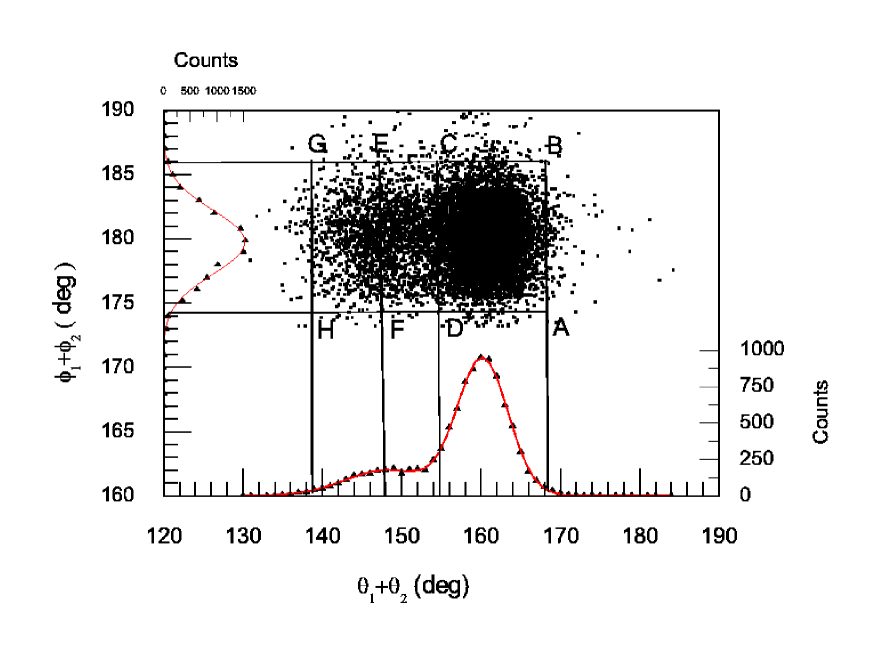
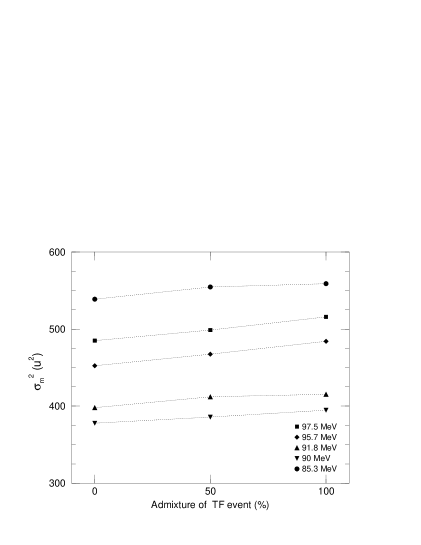
4.4 Result for 16O + 232Th
Fission fragment mass distributions has been measured for the fissioning system of 16O + 232Th at fourteen energies in the energy range 102.8 MeV to 78.6 MeV in the laboratory frame. For this fissioning system, it was observed earlier [28] that the non-compound nuclear fission channel following the transfer of a few nucleons is significantly populated to contribute to the total fission cross section. The measurement of Majumdar et al. [26] showed that the contribution of TF to the yield at deep sub-barrier energies was about 30 . Folding angle technique was used to separate the TF events from the FF events.
The experimental folding angle distributions at about 60∘ to the beam direction are shown in Fig 4.19 and 4.20. The distributions at lower folding angles, noticeable clearly below the Coulomb barrier, represent the folding angle distributions of the TLFF. Measured peak of the folding angle distributions of the FF events matches with the simulated value. Here also, like the fissioning system of 19F + 232Th, it was found that the distribution of TLFF component is wider than that of FFCF at near and sub-barrier energies due to widely varying recoiling angles and velocities. The FFCF events are separated from the distribution of events within specific values, as described in the case of 19F + 232Th reaction.
The mass distributions for the FFCF events are shown in Fig 4.21 and Fig 4.22 for all bombarding energies in the c.m. frame. The FFCF yields are shown by solid circle for 3 amu mass bin. To calculate the variance of the mass distributions, they were fitted with Gaussian distributions. The solid lines show the fit to the data. It can be observed that mass distributions are well fitted with Gaussian distributions even at lowest energies.
The bombarding energy after correction for average energy degradation in target, , the corresponding energy in c.m. system, , the fraction of the energy relative to Coulomb barrier, , the excitation energy of the fissioning system and the variance () of the mass distributions are tabulate in table 4.7. To show the variation of versus beam energy graphically, Fig 4.23 is drawn with experimental values depicted with solid squares. We observed a very similar trend of the variation of with decreasing energy, as was observed for the 19F + 232Th system. In 16O + 232Th, above the fusion barrier, decreases smoothly with the energy, but near the barrier at about 87 MeV, starts to rise and reaches a peak around 81 MeV. At still lower energies, it again starts to fall smoothly with decrease in energy. However the rise in is about 15 compared to as almost 50 rise observed in 19F + 232Th [29].


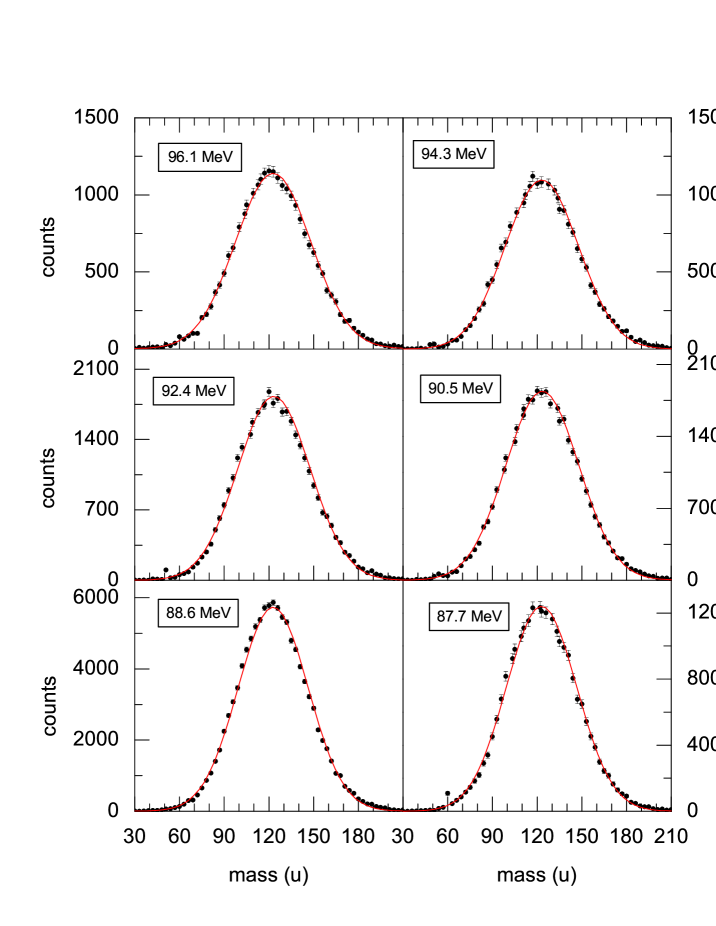
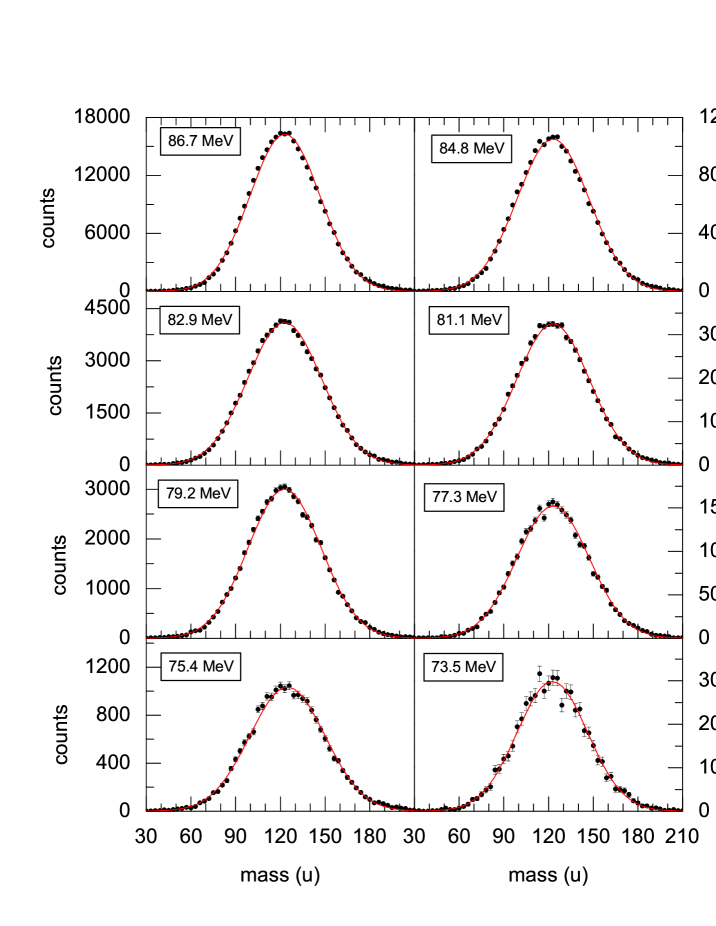
| (MeV) | (MeV) | (MeV) | ||
|---|---|---|---|---|
| 102.8 | 96.1 | 1.17 | 59.60 | 656.38 12.80 |
| 100.8 | 94.3 | 1.15 | 57.73 | 642.11 12.67 |
| 98.8 | 92.4 | 1.13 | 55.85 | 593.40 12.17 |
| 96.7 | 90.5 | 1.10 | 53.97 | 607.12 12.32 |
| 94.7 | 88.6 | 1.08 | 52.08 | 546.62 13.09 |
| 93.7 | 87.7 | 1.07 | 51.14 | 559.79 11.79 |
| 92.7 | 86.7 | 1.06 | 50.18 | 548.50 13.11 |
| 91.7 | 85.8 | 1.047 | 49.25 | 621.50 12.46 |
| 90.7 | 84.8 | 1.035 | 48.29 | 591.46 13.86 |
| 88.7 | 82.9 | 1.012 | 46.41 | 615.53 13.89 |
| 86.7 | 81.1 | 0.99 | 44.53 | 595.36 14.15 |
| 84.6 | 79.2 | 0.97 | 42.63 | 602.21 13.98 |
| 82.6 | 77.3 | 0.943 | 40.75 | 586.60 14.77 |
| 80.6 | 75.4 | 0.920 | 38.87 | 539.63 14.40 |
| 78.6 | 73.5 | 0.897 | 36.97 | 537.31 17.15 |

4.5 Result for 12C + 232Th
The fragment mass distributions of the FFCF events for the system 12C + 232Th were measured at ten bombarding energies. For this system, TLFF channel is weakly populated, compared to that observed in two fissioning system of 19F + 232Th and 16O + 232Th. The folding angle distributions in the first detector at forward positions around 60∘ are shown in Fig 4.24. Measured peak of the folding angle distributions of the FF events matches with the simulated value. On;y at lower energies below coulomb barrier, a contribution ( 5 ) of TLFF could be observed, and separated by gates on and as in the earlier cases.
The fragment mass distributions at all bombarding energies in c.m. frame are shown in Fig 4.25 and Fig 4.26 in 3 amu mass bin. It is observed that the mass distributions can be well fitted with Gaussian distributions even to the lowest energies. The fittings are shown by solid lines in the figures. Variances of the mass distributions were calculated from the fitted Gaussians.
The values of the calculated variance () of the measured mass distributions of the FFCF events at all energies are given in table 4.8 along with the target loss corrected beam energies in different frames and scales and excitation energies. The calculated values of excitation energy are listed in the column four. The values of the variances, , of the FFCF events for the system of 12C + 232Th as function of the c.m. energies are shown in Fig 4.27. Here also, we observed trend of the variation of with decreasing energy similar to that observed for the 19F + 232Th and 16O + 232Th systems. In 12C + 232Th system, above the fusion barrier, decreases smoothly with the energy, but near the barrier, starts to increase . At still lower energies, it again starts to decrease smoothly with decrease in energy. However the rise in is about 10 compared to as almost 50 rise observed in 19F + 232Th [29] and 15 in 16O + 232Th [30].
| (MeV) | (MeV) | (MeV) | ||
|---|---|---|---|---|
| 83.3 | 79.2 | 1.27 | 56.23 | 676.52 14.47 |
| 75.3 | 71.6 | 1.14 | 48.58 | 606.63 14.00 |
| 73.3 | 69.7 | 1.11 | 46.66 | 586.12 14.00 |
| 71.3 | 67.8 | 1.08 | 44.75 | 552.72 12.62 |
| 69.2 | 65.8 | 1.05 | 42.84 | 565.48 13.13 |
| 67.2 | 63.9 | 1.02 | 40.94 | 556.96 13.52 |
| 64.2 | 61.1 | 0.975 | 38.06 | 546.62 13.56 |
| 63.2 | 60.1 | 0.96 | 37.10 | 529.00 12.51 |
| 62.2 | 59.1 | 1.945 | 36.14 | 513.47 14.02 |
| 61.2 | 58.2 | 0.93 | 35.19 | 501.31 16.48 |

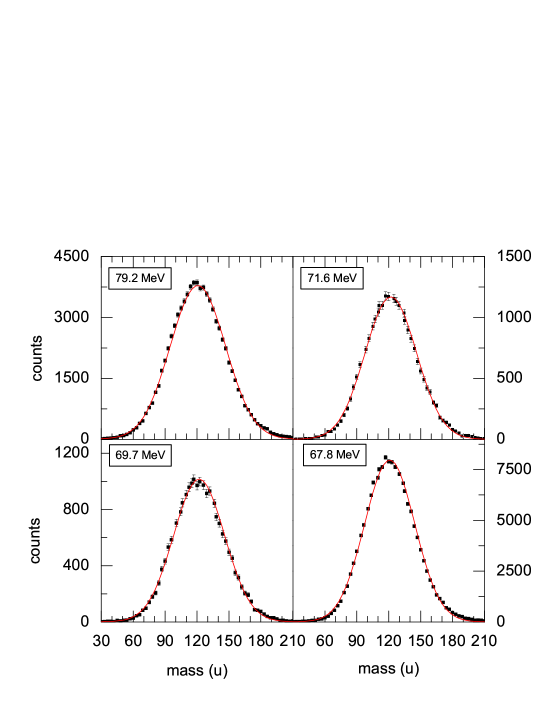
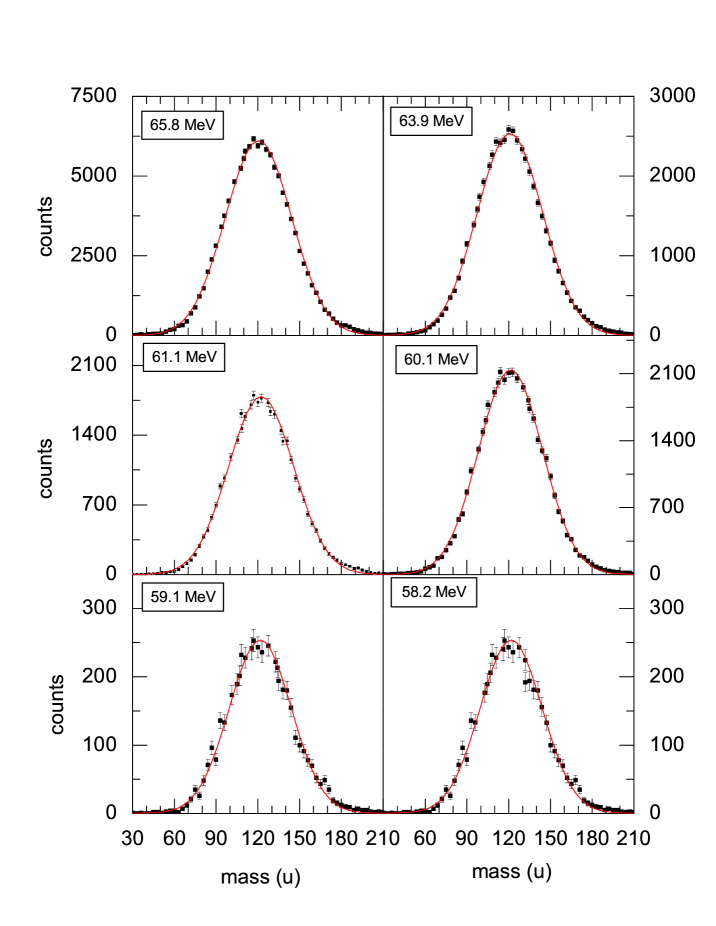

Bibliography
- [1] W. Q. Shen, J. Albinski, A. Gobbi, S. Gralla, K. D. Hildenbrand, N. Herrmann, J. Kuzminski, W. F. J. Mller, H. Stelzer, J. Toke, B.B. Back, S. Bjornholm and S.P. Sorensen,‘ Phys. Rev. C 36 115 (1987).
- [2] M.G. Itkis, S.M. Lukyanov, V.N. Okolovich, Yu.E. Penionzhkevich, A.Ya. Rusanov, V.S. Salamatin, G.N. Smirenkin and G.G. Chubaryan, Yad. Fiz. 52 23 (1990).
- [3] C. Gregoire, C. Ngo and V. Remaud, Phys. Lett. B 99 17 (1981).
- [4] W.J. Swiatecki, Phys. Scr.24, 113 (1981)
- [5] V. S. Ramamurthy and S. S. Kapoor, Phys. Rev. Lett. 54 178 (1985).
- [6] V. S. Ramamurthy, S. S. Kapoor, R. K. Choudhury, A. Saxena, D. M. Nadkarni, A. K. Mohanty, B. K. Nayak, S. V. Sastry, S. Kailas, A. Chatterjee, P. Singh, and A. Navin, Phys. Rev. Lett. 65 25 (1990).
- [7] A.M. Samant, S. Kailas, A. Chatterjee, A. Shrivastava, A. Navin and P. Singh, Eur. Phys. J. A.7 59 (2000).
- [8] I. Halpern and V. M. Strutinsky, in Proc. of 2nd International Conference on Peaceful Uses of Atomic Energy, (United Nations Publication, Geneva, 1958), Vol. 15, p 408.
- [9] B.B. Back, R.R. Betts, P. Fernandez, B.G. Glagole, T. Happ, D. Henderson, H. Ikezoe and P. Bent, in Fission at Sub-barrier energies, presented at 6th Winter Workshop on Nuclear Dynamics,(Jackson Hole, Wyoming, USA, 1990).
- [10] H. Zhang, J. Xu, Z. Liu, M. Ruan, and K. Xu, Phys. Rev. C 42 1086 (1990).
- [11] Huanqiao Zhang, Zuhua Liu, Jincheng Xu, Xing Qian, Yu Qiao,Chengjian Lin and Kan Xu, Phys. Rev. C 49 926 (1994).
- [12] N. Majumdar, P. Bhattacharya, D.C. Biswas, R.K. Choudhury, D.M. Nadkarni and A. Saxena, Phys. Rev. Lett. 77 5027 (1996).
- [13] E. Vulgaris, L. Grodzins, S.G. Steadman and R. Ledoux, Phys. Rev. C 33 2017 (1990).
- [14] S. Kailas , Phys. Rep. 284 381 (1997).
- [15] V.E. Viola, K. Kwiatkowski and M. Walker, Phys. Rev. C 31 1550 (1985).
- [16] L.M. Pant, R.K. Choudhury, A. Saxena and D.C. Biswas, Eur. Phys. J. A. 11 47 (2001).
- [17] L.M. Pant,D.C. Biswas, B.V. Dinesh, R.G. Thomas, A. Saxena, Y.S. Swant and R.K. Choudhury, Nucl. Instr. and Meth. A 495 121 (2002).
- [18] R.K. Choudhury, A. Saxena, A. Chatterjee, D.V. Shetty, S.S. Kapoor, M. Cinausero, L. Corradi, E. Farnea, E. Fioretto, A. Gadea, D. Napoli, G. Prete, A. M. Stefanini, D. Bazzaco, S. Beghini, D. Fabris, G. Montagnoli, G. Nebbia, C. Rossi-Alvarez, F. Scarlassara, C. Ur and G. Viesti, Phys. Rev. C 60 054609 (1999).
- [19] D.J. Hinde, A.C. Berriman, M. Dasgupta, J.R. Leigh, J.C. Mein, C.R. Morton, J.O. Newton, Phys. Rev. C 60 054602 (1999).
- [20] H. Rossner, D.J. Hinde, J.R. Leigh, J.P. Lestone, J.O. Newton, J.X. Wei and S. Elfstrom, Phys. Rev. C 45 719 (1992).
- [21] R. Vandenbosch and J.R. Huizenga, Nuclear Fission, (Academic press, New York, 1973).
- [22] N. Majumdar et al., Private Communication.
- [23] J. Fernandez-Niello, C.H. Dasso and S. Landowne, Com. Phys. Comm. 54 409 (1989).
- [24] D.V. Vanin, G.I. Kosenko and G.D. Adeev, Phys. Rev. C 59 2114 (1999).
- [25] J.R. Leigh, R.M. Diamond, A.Jhonston, J.O. Newton and S.H. Sie, Phys. Rev. Lett 42 153 (1979).
- [26] Nayana Majumdar, PhD thesis, Investigations on Heavy Ion Induced Fission of Heavy Nuclei at Near and Sub-Coulomb Barrier Energies , University of Calcutta, India (1997). (unpublished)
- [27] N. Majumdar, P. Bhattacharya, D.C. Biswas, R.K. Choudhury, D.M. Nadkarni and A. Saxena, Phys. Rev. C. 51 3109 (1995).
- [28] J.P. Lestone, J.R. Leigh, J.O. Newton, and J.X. Wei, Nucl. Phys.A509, 178, 1990.
- [29] T.K. Ghosh, S.Pal, T. Sinha, N.Majumdar, S. Chattopadhyay, P. Bhattacharya, A. Saxena, P.K. Sahu, K.S. Golda and S.K. Datta, Phys. Rev. C. 69, 031603 (R) (2004)
- [30] T.K. Ghosh, S.Pal, T. Sinha, S. Chattopadhyay, P. Bhattacharya, D.C. Biswas and K.S. Golda, Phys. Rev. C. 70, 011604 (R) (2004)
Chapter 5 Discussions Conclusions
In the present work the fragment mass distributions in fusion-fission (FF) reactions induced by light (almost) spherical projectiles on spherical and deformed targets are systematically studied near and below Coulomb barrier energies. The method and experiments for precise measurements with excellent mass resolution were described earlier along with the measured values of the width (variances of mass distributions) of the distributions.
The variations of with energy for and + are reproduced in the upper panel of 5.1. In the lower panel, the reported results on measurements of angular anisotropy (A) of the fission fragments are shown. For + , the angular distribution measured in the same experimental set up by us are also shown. It is interesting to note that the varies smoothly with while the trend in the angular anisotropy also follows closely the predictions of the microscopic theory (SSPM).
In Fig 5.2, the upper panel shows the variations of the with energy for the deformed target 232Th for 12C, 16O and 19F projectiles, while the lower panel shows in variations in reported values of angular anisotropy A. It is again interesting to note that variations in and A with energy is significantly different from the observed trend for the and A for spherical target projectile combinations. Variations in both the parameters show that those are decreasing with energy, but around Coulomb barrier a significant increase is observed with decreasing energy.
The close resemblance of the trends in the two cases, i.e., the departure of the observables for fusion-fission reaction, immediately points to a common origin of the observed anomalies in the angular and mass distributions. A common explanation of both the ”anomalies” would, therefore, give an insight into the fusion-fission dynamics; or in other words, a pointer to the path followed by the system of the two separated nuclei to a mononuclear system and re-separation into fragments with altered nucleon numbers, excitation, temperature, spin etc.
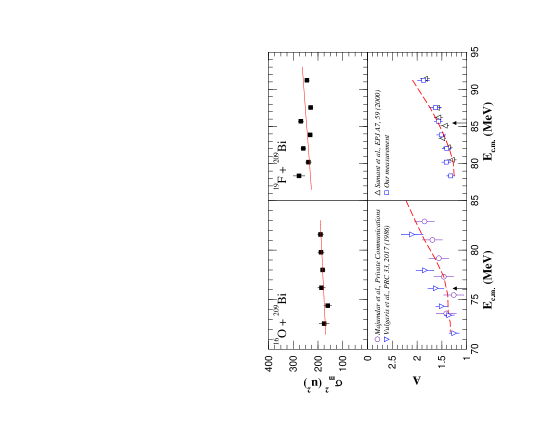
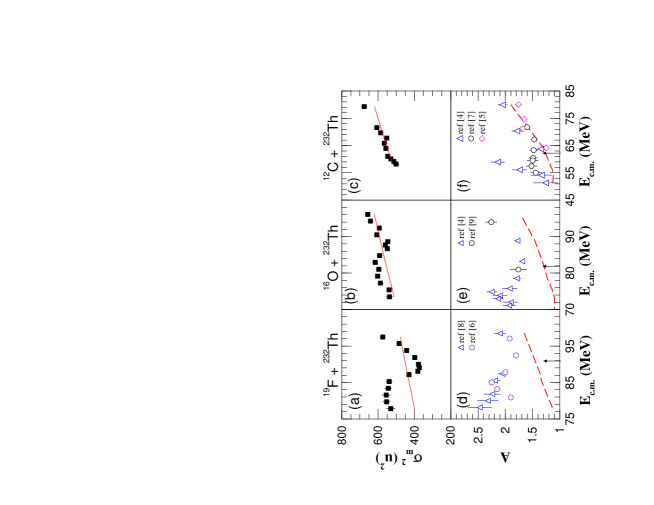
The process of fusion and subsequent evolution of the system, damping of the radial motion and excitation followed by cooling and thermal equilibration of the fused system had been a topic of investigation for last few decades. With tremendous advance in knowledge and computational powers, it has been possible to theoretically follow the transit of the system from the initial to final configurations by the minimum potential path through the landscape of potential energies in a multi-dimensional space governed by the residual strong interactions among the nucleons and the coulomb interactions. The paths can be calculated in microscopic theories of transport through a dissipative system. However, these calculations are complicated and still in the infancy. Hence knowledge about the fusion-fission reactions mostly comes from the conclusions drawn from the experimental observations.
5.1 Mass distributions with spherical target 209Bi
The observation of the smooth variations of the fragment anisotropy and the close agreement with the predictions based on the macroscopic pictures of the equilibration of the projection of the total angular momentum on the symmetry axis of a finite, rotating liquid drop in the SSPM model points to the path followed by such systems in the multidimensional energy landscape. The path leads over a fusion barrier to fuse the two projectiles with damping of the radial motion and increase in the internal excitation of the fused system. The fused system can cool down by emission of nucleons and photons and reach the fusion meadow as a evaporation residue. If the fissility parameter () is large and the Coulomb force tends to overcome the surface energy of the equilibrated compound nucleus, the internal excitation induces multi polar shape oscillations and the system reaches a saddle shape, a point of no return - and the system slides down the fission barrier to fission valley and reaches a scission configuration where two fission fragments fly off in opposite directions.. In macroscopic theories, the spin quantum numbers of the fissioning systems are assumed to be frozen at the saddle point and the agreement of the calculated angular anisotropy with the experimental values in and fusing with spherical bismuth nuclei directs to a possible scenario of the fusion-fission reaction as described above.
In the standard statistical saddle point model (SSPM) [1], the fission fragments are assumed to scission along the symmetry axis at the saddle point where the constants of motion are frozen. For a compound nuclear state of total angular momentum and projections of it, M and K along the z-axis and symmetry axis, respectively, the angular distribution of fission fragments are given by the symmetric top wave function as
| (5.1) |
Here is the c.m. angle with respect to beam of the fragment. For spin less target and projectile, M is zero and the angular distribution of fragments are given by
| (5.2) |
In the standard saddle-point statistical theory, the distribution of K values are estimated by using a constant temperature level density argument at the fission saddle point and this approach leads to the expression
| (5.3) |
where = and 1/ = 1/ - 1/. The distribution of K values is therefore gaussian with variation , which is determined by the effective moment of inertia and nuclear temperature T, both calculated at the saddle point for fission. The nuclear temperature at the saddle point T is obtained from the relation
| (5.4) |
where is the excitation energy of the compound nucleus, is the fission barrier, is the rotational energy and [=8/A (MeV/u), A being the mass number] is the level density parameter. We thus obtain the following expression for the distribution of fission fragments following fusion:
| (5.5) |
where is the transmission co-efficient for the th partial wave for fusion. The statistical saddle point model clearly emphasizes the macroscopic co-ordinates, viz, moment of inertia and temperature and the level density parameter, governing the direction of the emission of the fragments. The SSPM predictions of angular anisotropies are shown in lower panel of Fig. 5.1 by dashed lines. The close agreement of the SSPM predictions with the experimental data shows that macroscopic liquid drop model describes the fusion-fission path adequately.
The above discussed fusion-fission path is also supported by the observed shape and variation of the width of the fragment mass distribution with bombarding energy. The variations with beam energy in the center of mass frame, the width () of the mass distributions of an equilibrated compound nucleus will be governed by the macroscopic forces, i.e., will have a weak and statistical dependence on energy. The observed smooth variation in in the 16O and 19F on 209 Bi is in general agreement with the trend expected for fusion-fission reactions. The solid red line in the Fig 5.1 is the expected dependence of the width of the mass distribution on the incident energy as derived from the statistical model treatment consistent with the fusion-fission mechanism. Here it is assumed that the mass asymmetry potential can be approximated by a parabolic shape,
| (5.6) |
where is the fragment mass, is the mass for symmetric fragmentation and is the stiffness parameter for the mass asymmetry degree of freedom. A statistical model treatment leads to a variance of the fragment mass distribution given by,
| (5.7) |
where is the scission point temperature, is the level density parameter, is the excitation energy at the scission point which is calculated as follows:
| (5.8) |
Here is the excitation energy of the compound system, is the value for symmetric fission, is the total kinetic energy estimated from Viola’s systematics [2]. accounts for the fragment deformation energy and is the rotational energy at the scission. Detail calculation of is given in the Appendix. The theoretical fits to the mass distributions are shown by thick continuous lines in upper panel of Fig 5.2 using equation 5.7 and 5.8. The stiffness parameter is taken as free parameter.
The linear variation of the with the beam energy (which also relates the excitation energy and equilibrium temperature of the system) shows that macroscopic forces in the liquid drop model of nucleus is adequate to describe both the angular and mass distributions of fragments in fusion-fission reaction. The experimental observation fully support a picture of the dynamics of the fusion of the two independent ions with initial kinetic energy to overcome the Coulomb and coriolis forces to ”fuse” over a fusion barrier and cool down by few particle emission and reach equilibrium to the so called compound nucleus; and then undergoing shape oscillations over a saddle shape to roll down the fission ridge to scission at the fission valley. Such a picture is nicely described in Fig 5.9 as discussed later.
5.2 Mass distributions with deformed target 232Th
The above simple picture of the fusion-fission path and evolution of a compound nuclear fission, as described in the earlier section, runs into difficulty in the case of deformed target in the energies close to the Coulomb barrier and had been subject of intense research in recent years in multitude of experimental observables. The anomalous effect near and below the Coulomb barrier energies in the angular anisotropies of the fission fragments were observed in many systems [3]. In the systems studied in the present case, the angular anisotropies showed remarkable anomalous increase [4, 5, 6, 7, 8, 9] as shown in Fig. 5.2 in the lower panels. The SSPM predictions for the angular anisotropy and present calculations of from statistical model are shown by blue dotted lines in Fig 5.2. The experimental data for both the observables shows significant departure from the macroscopic model predictions. It is interesting to note that for the first time, in precise measurements of , the measured values also show anomalous departure from a smooth variation observed for the systems with spherical target-projectile systems. Hence a common explanation of both angular and mass distributions in term of a dynamical model of the macroscopic and microscopic effects are needed for a satisfactory explanation.
The angular anisotropies in the deformed target and projectile systems have been explained in different models. The predictions of the SSPM was found to be quite accurate, specially for spherical target and projectile systems and even for deformed targets. The departure from the SSPM predictions for deformed targets were found to be nominal at energies, or temperatures, above that corresponding to the fusion barrier. Hence the anomalous angular anisotropies observed, particularly at near and below barrier energies were guessed to originate due to microscopic effects, viz, binding energies, effects of entrance channel mass asymmetry or dynamical effects due to dissipation of the nucleons in the forming the mononuclear system in fusion of the two nuclei.
It had been observed that the anomalous angular anisotropies are also accompanied by an order of magnitude increase in the fusion cross sections over that of the one-dimensional barrier penetration models. Hence for a few years it had been subject of intense debate over two factors -whether the average values are underestimated or the width of the equilibrated K distributions, are overestimated from the experimental data, as the approximate relation of the angular anisotropy to the above factors are given by the approximate relation . It had been finally resolved by simultaneous agreement of the fusion excitation functions and the distributions of barriers in a coupled channel analysis that indeed it had been the overestimation of the , which is responsible for the increase in the angular anisotropy in the near and sub-Coulomb barrier energies in the deformed target-projectile systems [4, 10].
5.2.1 Reduction of the width of the K distributions: Pre-equilibrium fission model
There has been different ideas and models of the reduction of the width of the spread in the orientation of the nuclear symmetry axis of the fissioning nucleus at the saddle configuration with respect to the space fixed axes. The earliest ideas are based on the non-equilibration of the K quantum number before the system reaches saddle shape [11]. The pre-equilibrium model of Kapoor and Ramamurthy (KR) assumed that for heavy systems, the equilibration times are large compared to the time taken to reach the saddle shapes and the resultant width of the K distribution, is on average smaller than that predicted for a finite rotating liquid drop model prediction. They proposed that all fission events taking place in a time scale of 8 10-21 sec or less have a K distribution represented by a narrow Gaussian around K=0, with a constant variance , where 0.06. This smears the angular distributions and the average angular anisotropy increases. However, according to the model prescription, it was expected that the effect of K-non-equilibration will increase with energy, and in fact, it had not been expected that at energies close to and below barrier, the pre-equilibration of K quantum number would be a major factor in determining the fragment angular anisotropy. In addition, it was not clear why the effect predominates in the deformed target-projectile systems.
Vorkapic and Ivanisevic [12] modified the pre-equilibrium model of KR by calculating the fission probability for a series of time interval from the liquid drop model of Bohr and Wheeler [13], for specified orientation of the symmetry axis with respect to the projectile trajectory. The initial K distribution was assumed to be around most probable projection of the total spin on the symmetry axis. Considering that at sub-barrier energies, the barrier distribution functions shows that the fusion is almost confined to the region of the tip or polar region of the prolate targets and the equatorial regions do not contribute to the fusion, the orientation averaged fission times showed pre-equilibrium fission time scales at near and below energies. The calculated angular distributions for 16O+ 232Th systems could be quite well reproduced for a speed of equilibration C 0.75 . The equilibration time is related to the width of the K distribution as , where is the mean of some time interval. It is worthy to note that as energy increased above the Coulomb barrier, the probability of fusion did not depend on the relative orientation, i.e., the dependence on polar orientation of the deformed target was washed out, and the calculated width of the K distribution converged to the SSPM value.
Both the pre-equilibrium model of KR and its modification assumes that a compound nucleus is formed with full damping of radial motion and mass relaxation before it reaches the saddle configuration by shape oscillations in a time faster than the equilibration time for statistical equilibration of the projection of the spin on to the symmetry axis. Thus the angular distributions are not affected by the entrance channel variables, if any, in the primary fusion of the binary system. However, the extent, or the quantitative estimation of the angular anisotropy shows a strong correlation with the entrance channel masses of the target and projectile. The mass asymmetry of target-projectile combination, = , largely determines the initial flow of nucleons in binary fusion. The macroscopic forces due to Coulomb and surface energy combines to put the flow of nucleons in opposite directions depending on the being smaller or larger than the critical Businaro mass asymmetry ( 0.90). For systems of 19F + 232Th or 16O+ 232Th , , the flow of nucleons are from heavier to lighter fragments, and reverse is the direction of flow of matter in 12C+ 232Th systems with . It is interesting to note that on 232Th targets, the anomalous rise in angular anisotropy gets progressively reduced as entrance channel is increased.
The experimental evidences that the total fusion cross sections are enhanced for the larger initial separation of the projectile fusing with polar region of the deformed target and the observation of the influence of the entrance channel mass asymmetry on the degree of angular anomaly of the fission fragments points to possible microscopic effects in defining the fusion path itself of the binary system to a composite mononuclear system. If the path in a multi-dimension potential energy landscape deviates from that over a normal fusion barrier governed by the macroscopic properties of a hot, finite rotating liquid drop, it can be reasonably assumed that a finite probability exists for the system to go over a conditional fission barrier before ever reaching a mononuclear configuration. Such a fission event, in all experimental situations would be counted as a fusion-fission event following full transfer of initial momentum, although statistical theories will not be applicable to predict the experimental observables, viz, angular or mass distributions of such non-equilibrated fission modes.
It is quite well known that such non-compound fission modes exist in heavy ion induced fission reactions. If the excitations and transfer of the orbital momentum is large enough to reduce the dependent fission barrier height to zero, the nascent mononuclear system spontaneously under goes fission with memory of entrance channel mass and orientation. Such an event is known as fast fission and the angular distribution shows an almost 1/sin behaviour with large anisotropy. The mass distribution also shows large asymmetry and may be double peaked [14]. In certain systems with near-symmetric target-projectile combinations and at high excitations, the normal fusion-fission path may not also follow the minimum energy configurations and a finite non-zero mass asymmetric fission barrier may be the preferential route for the binary system to follow. Such reactions, termed as quasi-fission [15] , also yields high angular anisotropy and a symmetric mass distribution, In analogy to such reactions, a quasi fission reaction mechanism can be postulated for the reactions with deformed targets at low energies where the reactions take place preferentially through the polar regions of the target.
Hinde et al., [10] conjectured a mechanism of orientation dependent quasi fission reaction to explain the observed fragment angular anisotropies in 16O + 238U systems. N.Majumdar et al., [4] extended the model to include systems with entrance channel mass asymmetry on either side of the Businaro-Gallone ridge. The salient features of the orientation dependent quasi fission reaction are discussed below.
5.2.2 Nuclear orientation dependent quasi fission model
Hinde et al., [10] measured the fragment angular distribution of the system 16O + 238U and observed a rise in the anisotropies of fission fragments in FFCF reaction at sub-barrier energies. They proposed a orientation dependent quasi-fission model to explain the rising trend in angular anisotropy. It was conjectured that the admixture of a QF mechanism, characterized by high anisotropy, with the statistical compound nuclear events consistent with SSPM prediction of fragment angular anisotropy, boosted the resultant anisotropies. However, the occurrence of the QF mechanism is governed by the relative orientation of the projectile and the target.
Hinde et al., [10] measured the fusion barrier distribution for the system 16O + 238U and the rise in anisotropies with decreasing energy. They pointed out that the higher fusion barrier at energies above Coulomb barrier refers to the contact of the projectile irrespective of the equatorial or polar region of the prolate target, but the contact with equatorial region leads to a more compact di-nuclear system. Since in quantum mechanical systems, similarity in entrance and exit channel shapes are favoured, it is expected that the compound nuclear formation is more likely for contact with equatorial region than that for contact with prolate region. On the contrary, the lower fusion barriers at below Coulomb barrier energies refers to contact with the polar region, resulting an elongated configuration in the entrance channel; consequently a much elongated saddle shape leading to quasi-fission is favoured than formation of a compact, almost spherical compound nucleus. The two different cases are shown in Fig 5.3 where in Case I, with larger fusion barrier, formation of compound nucleus is most probable. In Case II, smaller fusion barrier for elongated configuration is likely to generate quasi-fission .
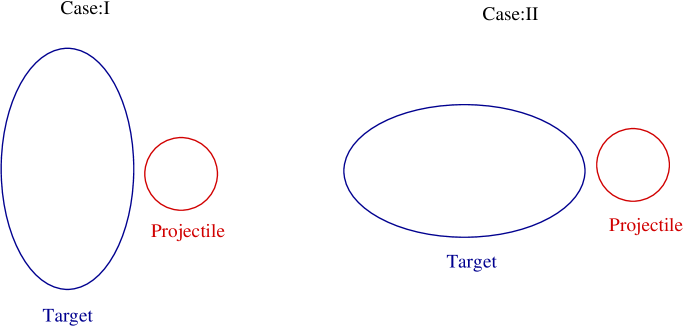
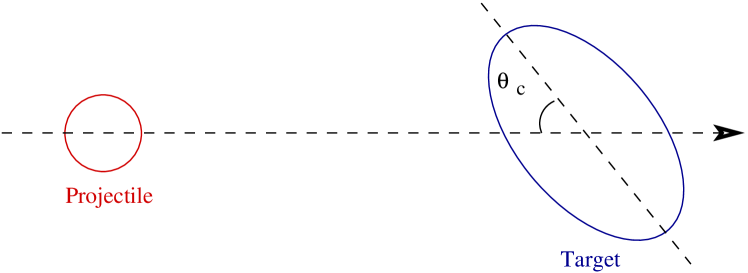
In the hypothesis of QF at sub-barrier energies it is assumed that at near and below barrier energies, the reaction mechanism is dominated by QF mode for relative orientation angle of the projectile trajectories up to a maximum, or critical angle of , as shown in Fig 5.4. Above the critical angle, reaction mechanism is assumed to be dominated by compound nuclear fission. Hence an admixture of the two modes changes the anisotropies to higher values compared to SSPM predictions. For the QF mode, the contribution to angular anisotropy was assumed to have a high, constant value. The angular anisotropies for compound nuclear fission was assumed to follow SSPM predictions. A cross section weighted admixture of angular anisotropies fits with experimental trend of the variation of A with energy for the systems 12C, 16O and +232Th [4]. Details of the calculation are discussed in reference [16].
If we compare the two hypotheses of the origin of the non-compound effects in fusion of two heavy nuclei leading to anomalous angular anisotropies and extend the expected effects in other reaction channels, viz, cross sections for production of evaporation residues (ER) or the mass distributions, further inputs for a clearer understanding of the fusion mechanism may be obtained. If the two ions coalesce and produce a compound nucleus equilibrated in all degrees of motion, the compound nucleus cools down with emission of particles and photons to a evaporation residue. Hence production of ER is pre-conditional on the formation of a compound nucleus. Thus observation of ER’s in a nuclear reaction can be used as a cursor of the reaction path following a fusion over the fusion barrier and cooling down to a fusion meadow.
The pre-equilibrium model of fusion-fission reaction (PEF) points to a delay in the equilibration of the spin projection on the symmetry axis. Hence if we integrate over all orientations and allow for the considerable time for cooling of the ER’s, it is easy to follow that K-equilibration time will not effect the probability of formation of ER’s just in the same way that the total fission cross sections are not effected by the pre-equilibrium process. However, in the quasi fission (QF), the intermediate compound nuclear state is missing and the system directly proceeds from a initial bi-nuclear configuration to final bi-nuclear configuration with altered mass, charge and excitation energy ratio. Hence the systems do not go through a stage whereby the ER can be produced. Hence the cross section for production of evaporation residue is hindered.
Hinde et al., reported [17] severe inhibition of fusion in heavy ion induced reactions with different entrance channel masses to produce the final compound nucleus 220Th. The entrance channel mass asymmetry differed from 0.85 (16O + 204Pb), 0.64 (40Ar + 180Hf), 0.56 (48Ca + 172Yb), 0.25 (82Se + 138Ba) and 0.12 (124Sn + 96Zr) as shown in Fig 5.5. The cross sections for evaporation residue by (HI,xn) reactions were progressively inhibited as the entrance channel mass asymmetry increases. However, 40Ar with large binding energy inhibited the fusion cross sections. This observation was claimed to point toward a quasi fission phenomena.
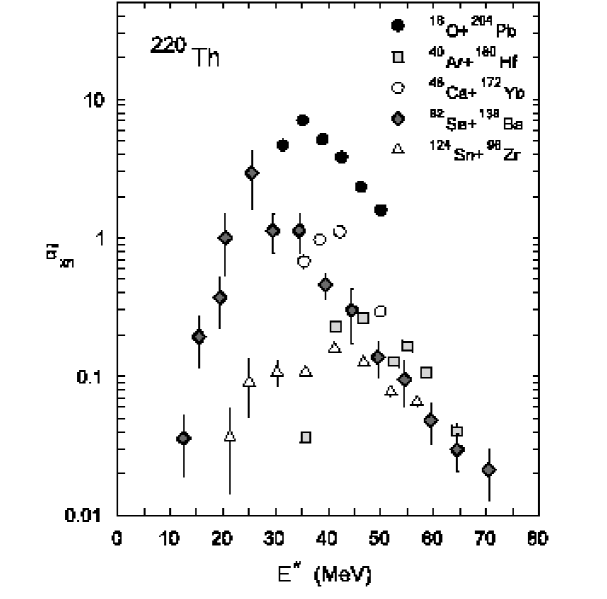
However, Nishio et. al., measured [18] the fusion of 16O with 238U and reported that no inhibition in the prediction of evaporation residue even in below Coulomb barrier energies where the measured fusion barrier distribution function clearly showed reaction taking place through the polar region of Thorium nucleus preferring quasi fission reactions. These conflicting picture prompted us to use fragment mass distribution as a probe for the reaction mechanism.
If we consider the effect of the PEF and QF on the mass distributions, it is probable the effects will be different in two cases. Mass relaxation is always considered to be faster than the equilibration of spin projections. The mass distribution is also dominated by macroscopic forces. The statistical parameters governing the mass distributions are the formation of the two nascent cores at the saddle and the subsequent parameters of the neck region and its snapping. In other words, the excitations or the temperature along with liquid drop properties are the determining factor. The liquid drop fission barrier is mass symmetric and at the large excitation energies, the shell effects are washed out. The expected mass distribution is around zero mass asymmetry and experimentally it has been found that for compound nuclear reactions, the mass distributions is peaked around the mean of target and projectile mass (or very close to it, allowing for emission of particles before scission). This can also be observed in case of the present study of the mass distributions on bismuth target with oxygen and fluorine projectiles. The width of the mass distribution is a signature of the statistical or macroscopic processes. Hence we do not expect any large deviations in the average or the width of the mass distributions for the pre-equilibrium model.
In the case of QF, the picture is entirely different. The system passes over a ridge with even a non-zero mass asymmetry. Hence the ratio of the masses of the nascent cores may vary from symmetric cores of the compound nuclear fission. The mass split may become asymmetric. The width of the distribution can be different for two reasons - the asymmetry may not be large to separate the light and heavy fragments decisively, and the statistical parameters may be different from that of the compound nuclear fission.
Hinde et al., measured the distribution of fragment masses in 16O + 238U in near and below energies. The authors concentrated on fitting the observed masses with a symmetric (for compound nuclear fission) and a asymmetric (for quasi-fission) distributions and showed that the asymmetric component was getting prominent as the energy decreases below the Coulomb barrier [19]. However, it may be noted that the average mass asymmetry of the QF was not large enough for a clear separation of the symmetric and asymmetric components and the mixing ratio of the symmetric and asymmetric components obtained in the analysis of the experimental data may be doubtful. It appears that a more precise measurements as done in the present investigations may clearly separate the QF and CNF modes and a mixing of the two modes can be attempted to explain the experimental widths of the mass distributions.
Observation of a sudden rise in values for the systems 19F, 16O , 12C + 232Th as the excitation energy is lowered may signify a mixture of two fission modes, one following the normal statistical prediction of fusion-fission path along zero lift-right mass asymmetry () and another following a different path in the energy landscape with zero or small mass asymmetry. The mixture of the two modes could give rise to wider mass distributions. Similar to the postulation of the orientation dependent quasi fission discussed in the above section, we postulate that for fusion-fission paths corresponding to the projectile orientations up to a critical angle of impact on the polar region of the prolate thorium, the width and energy slope of the symmetric mass distributions are different as shown by dot-dashed curves in Fig. 5.6, Fig. 5.7 and Fig. 5.8, compared to those for the statistical fusion fission path (shown by dotted curves). The mass widths weighted by the fission cross sections which are assumed to be very close to fusion cross sections as the composite systems are of high fissility, are mixed for the two modes using following relation:
| (5.9) |
where, and represent the cross sections for fusion-fission and quasi-fission respectively. The values of and are taken from the fitted lines (dotted and dot-dashed respectively) as shown in Fig. 5.6, Fig. 5.7 and Fig. 5.8 for the systems 19F, 16O and 12C + 232Th respectively.
The fission cross sections were taken from the measurement of Majumdar et al., [4]. The calculated mass widths for the system 19F + 232Th is shown in Fig. 5.6. The solid red line is the calculation for the critical angle and the blue line represent the calculation with critical angle . We note that the combination of the two fission modes with differences in the trend of variation of with energy reproduces the experimentally observed values, even if a very sharp region on the nuclear surface is taken as a demarkation zone for the two fission modes. It can also be noted that in explaining the similar trend of anisotropy data Majumdar et al., also used values of same critical angle to explain the observed angular anisotropy. Additionally, a cut on critical -values of 11-13 were assumed to separate the two modes of fission. However we needed no cuts on critical -values, signifying that the spinning of the nucleus was slow enough to significantly affect the much faster mass transports.
The calculated mass widths for the system 16O + 232Th is shown in Fig. 5.7. The solid red line is the calculation for the critical angle and the blue line represent the calculation with critical angle . It is interesting to note that the relative anomalous rise in in 16O + 232Th is lesser than that in 19F + 232Th, although, the same critical region on the thorium nuclear surface defines the demarkation of the two fission modes. We conclude that the quantitative difference in the fissioning systems is possibly due to the difference in the feeding point of the system along the mass-asymmetry and the elongation axis of the multi-dimensional
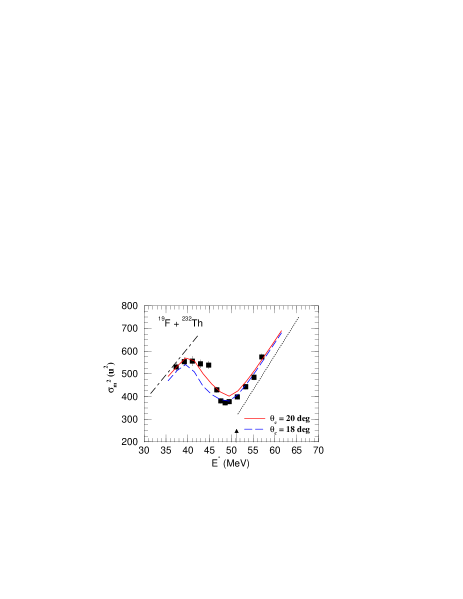
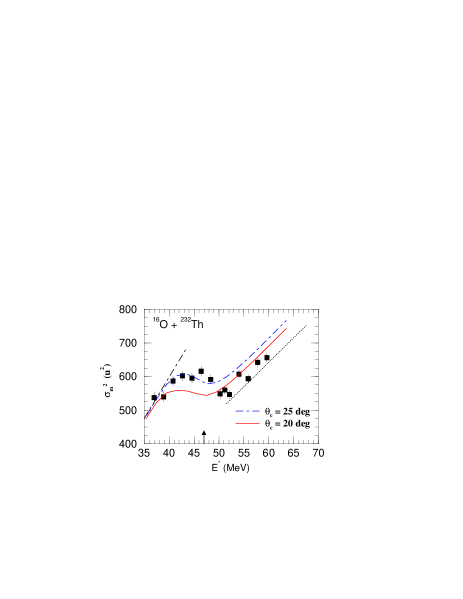
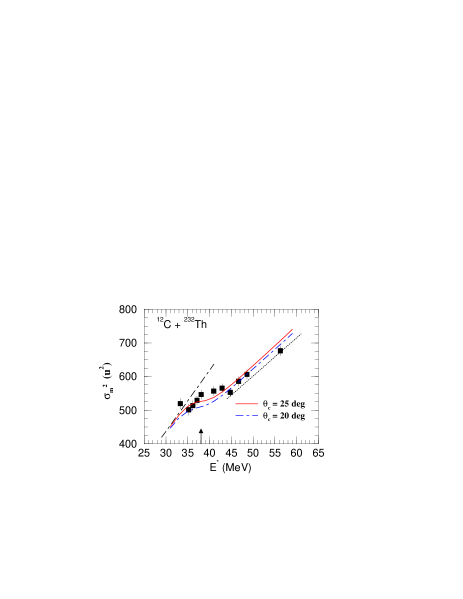
potential energy landscape.It is to be noted that the similar value of () was used [4] to explain the anomalous anisotropies for this system also where QF events contributes.
The above conjecture is supported by till lesser anomaly in case of 12C + 232Th system where the calculated mass widths is shown in Fig. 5.8. The solid blue line is the calculation for the critical angle and the red line represent the calculation with critical angle . As can be seen from the reasonable agreement of the mixed values with the observed fission fragment mass widths, we can phenomenologically explain the observed increase in widths of the mass distributions when energy is decreased. It is interesting to note that the fusion-fission process is clearly dominated by the normal process at above Coulomb barriers and the ”anomalous” fission process is dominant at lower energies. However, experimental evidence suggests that the variations of mass distributions with excitation energies are similar for both the processes, probably dominated by macroscopic forces, but differing quantitatively due to microscopic effects.
Extensive calculations of the multidimensional potential energy surface have successfully explained spontaneous and low energy fission phenomena [20, 21]. In Fig. 5.9, reproduced from reference [22], the normal fusion-fission path and the production of evaporation residues are pictorially depicted. The system of two ions in the entrance have to overcome the fusion barrier and reach the top of the fusion hill to slide down to the fusion meadow, and cool down to a ER. The path is shown by shaded (magenta colour) area in picture in left. However, if the combined system has a large fissility, i.e., large Coulomb to surface energy ratio, the saddle point, indicated by a ”” may be a more possible path and is reached by the system rather than the fusion meadow, to roll down hill to the fission valley.
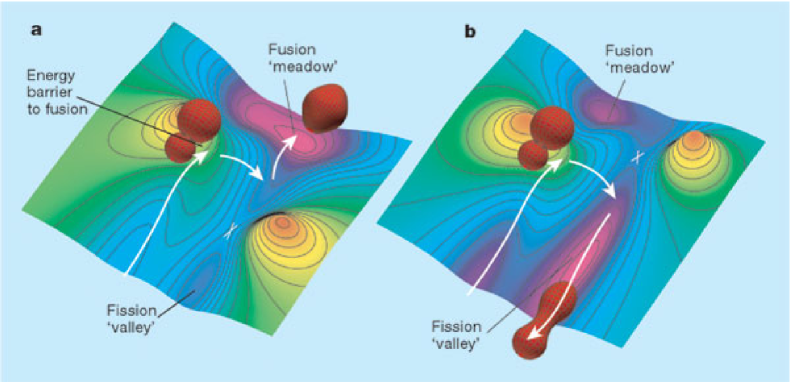
With advent of numerical processing powers of parallel computations, realistic calculations of the energy surfaces became possible. Calculated paths through the minimum energy valleys and over ridges in the potential surface showed that apart from the deformations and necking of the two nascent fragments the left-right mass asymmetry also plays a crucial role. The accuracy in the numerical calculations depends on the number of grid points on the nuclear surface of the two nascent fusing ions. Moller et al., [20] calculated the shapes of two fusing heavy ions in their ground state and calculated the heights of fusion and fission barriers. The authors could successfully explain the features of symmetric and asymmetric fragment mass distributions in the spontaneous or low energy fission of 228Ra, as shown in Fig 5.10. All the heavier than actinide nuclei show mass symmetric () and mass asymmetric () saddle shapes with a ridge separating the two down the scission path. It can be observed the system preferentially follows the asymmetric mass saddle point (shown by blue line) and the symmetric mass saddle (red dotted line) lies higher in energy. The path down the saddle points for the two cases are separated by ridge, the highest of which is shown by triangle. It is the relative heights of the symmetric and asymmetric saddle points and ridge which separates the two paths to scission, critically determines the fragment mass distribution.
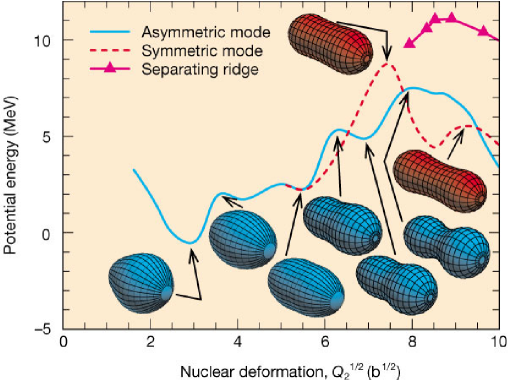
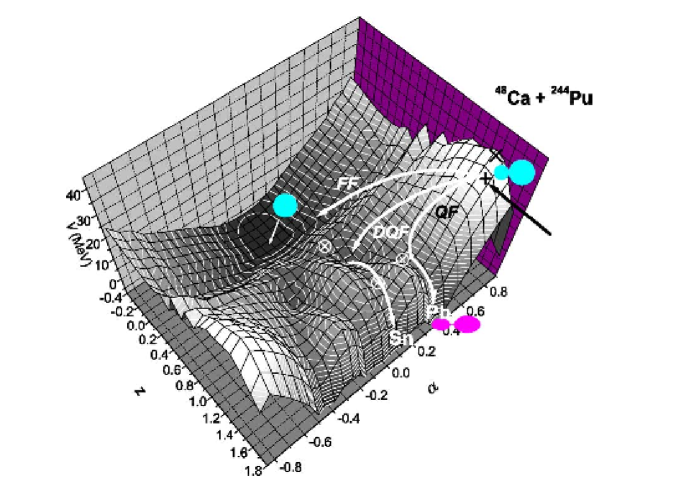
Recent extensions [23, 24] of the five dimensional energy landscapes for fusion of 48Ca with 244Pu have been carried out. The results are shown in the Fig 5.11. In addition to the calculated minimum energy path to reach the fusion meadow and the subsequent descent to the fission valley over a mass symmetric unconditional saddle corresponding to the fusion-fission (FF) path, at higher excitations, most of the paths may deviate through a mass symmetric saddle shape before fusion to re-separate in a quasi-fission (QF) reaction mode.
In a very similar situation, in case of fusion of spherical projectiles with deformed 232Th nuclei, above the Coulomb barrier, the system follows a fusion-fission path over the mass symmetric unconditional saddle. But as the energy is decreased, these paths are progressively blocked and then the microscopic effects come into play. For the polar region of the deformed target, the system starts from an initial condition with varying deformation, separation and damping of radial motion. This results in the system finding a minimum energy path skirting the fusion meadow and over an almost mass symmetric saddle.
In analogy to skiers coming down a mountain slope from different heights (initial energy), go over a peak( fusion barrier) to a meadow (fusion) and continuing to slide over a small hillock (unconditional fission barrier) to reach the valley below (scission) in the established route (FF), those who start just below or at the peak, the normal route is blocked. However, if mountainsides are different (microscopic effect due to deformation) and a ridge exists near the peak, some of the skiers can reach the ridge and follow it over a hilltop (conditional mass symmetric saddle) and reach almost the same spot at the valley in different route (QF). However, for a spherical target, the mountain sides are all similar and no ridges exist. The current experimental results strongly indicates the likely scenario described above and calls for detailed calculations of the energy diagrams for the motion of the nucleons through the dissipative system with different initial conditions.
5.3 Conclusions
The present experimental investigations on the heavy ion induced fission reactions were done with a double arm time-of-flight spectrometer with difference of T.O.F.’s for precise measurements of widths of mass distributions with a mass resolution of 3-4 a.m.u. The experiments clearly established that width of the mass distribution is a sensible tool to observe departure from the normal fusion-fission path in the fusion of heavy nuclei. It has been observed that in case of relative orientation-symmetric target-projectile combinations, such as spherical target (209Bi) and projectiles (19F and 16O), the system at all beam energies follows a fusion path over a mass symmetric fission barrier to coalesce to an equilibrated compound nucleus (CN), which subsequently undergoes shape transitions over a mass symmetric saddle shape to scission into binary fission fragments. The angular and mass distributions in such compound nuclear fission can be predicted quite accurately in terms of the macroscopic properties of a rotating finite drop of liquid equilibrated in spin (), projection of spin () and excitation energies.
However, this picture does not hold in case of systems with orientation-asymmetric target-projectile systems, such as in the case of deformed target (232Th) and spherical projectiles (12C, 16O and 19F) systems, particularly at near and below Coulomb energies, where the reaction cross-sections are crucially dependent on the relative orientations of the projectile with deformed target. The observed angular anisotropies and the present measurement of width of mass distributions differ significantly from the predictions based on the macroscopic theories. This shows the possibility of following of the system in fusion-fission paths in alternate routes to that of the normal fusion-fission paths.
The exact mechanisms for the departure from normal fusion-fission paths are not known accurately. However, macroscopic effects such as the direction of mass flow or the mass relaxation time being too prolonged may not be the cause. It has been established earlier from the experimental barrier distributions, the reaction cross sections in 19F, 16O, 12C + 232Th in near and below Coulomb barrier energies are mostly for impact of the projectiles on the polar regions of the thorium nuclei. Following the quantum mechanical effects favouring similar shapes in entrance and exit channels [22], we modify the simple postulation of the microscopic effects of the relative orientation of the projectile to the nuclear symmetry axes of the deformed target [10]. We assume that for the non-compact entrance channel shape, the impact of the projectile in the polar region of 232Th target drives the system to an almost mass symmetric saddle shape, rather than a compact equilibrated fused system. The observed fragment mass widths can be quantitatively explained under such assumptions. The above postulation is supported by the observation that for the spherical target 209Bi, where entrance channel compactness of shape is same for all relative target-projectile orientations, only normal fusion-fission paths, as characterized by the smooth variation of fragment mass widths with excitation energy, are observed. It is also worthwhile to note that effect of the anomalous mass widths increases with left-right mass symmetry in the entrance channel in case of 19F, 16O, 12C + 232Th system in consonance with our description. The present string of measurements indicate that higher entrance channel mass asymmetry and energies close to the Coulomb barrier are preferable to increase the probability of reaching the fusion meadow in synthesis of super-heavy elements in heavy ion reactions.
Bibliography
- [1] I. Halpern and V. M. Strutinsky, in Proc. of 2nd International Conference on Peaceful Uses of Atomic Energy, (United Nations Publication, Geneva, 1958), Vol. 15, p 408.
- [2] V.E. Viola, K. Kwiatkowski and M. Walker, Phys. Rev. C 31 1550 (1985).
- [3] S. Kailas , Phys. Rep. 284 381 (1997).
- [4] N. Majumdar, P. Bhattacharya, D.C. Biswas, R.K. Choudhury, D.M. Nadkarni and A. Saxena, Phys. Rev. Lett. 77 5027 (1996).
- [5] V. S. Ramamurthy, S. S. Kapoor, R. K. Choudhury, A. Saxena, D. M. Nadkarni, A. K. Mohanty, B. K. Nayak, S. V. Sastry, S. Kailas, A. Chatterjee, P. Singh, and A. Navin, Phys. Rev. Lett. 65 25 (1990).
- [6] Huanqiao Zhang, Zuhua Liu, Jincheng Xu, Xing Qian, Yu Qiao, Chengjian Lin and Kan Xu, Phys. Rev. C 49 926 (1994).
- [7] J. P. Lestone, A. A. Sonzogni, M. P. Kelly, and D. Prindle, Phys. Rev. C. 55 R16 (1995).
- [8] N. Majumdar, P. Bhattacharya, D.C. Biswas, R.K. Choudhury, D.M. Nadkarni and A. Saxena, Phys. Rev. C. 51 3109 (1995).
- [9] B.B. Back, R.R. Betts, P. Fernandez, B.G. Glagole, T. Happ, D. Henderson, H. Ikezoe and P. Bent, in Fission at Sub-barrier energies, presented at 6th Winter Workshop on Nuclear Dynamics, (Jackson Hole, Wyoming, USA, 1990).
- [10] D. J. Hinde, M. Dasgupta, J. R. Leigh, J. P. Lestone, J. C. Mein, C. R. Morton, J. O. Newton, and H. Timmers, Phys. Rev. Lett. 74 1295 (1995).
- [11] V. S. Ramamurthy and S. S. Kapoor, Phys. Rev. Lett. 54 178 (1985).
- [12] D. Vorkapic and B. Ivanisevic, Phys. Rev. C 52 1980 (1995).
- [13] N. Bohr and J.A. Wheeler, Phys. Rev. 56 426 1939
- [14] R. Vandenbosch and J.R. Huizenga, Nuclear Fission, (Academic press, New York, 1973).
- [15] W. Q. Shen, J. Albinski, A. Gobbi, S. Gralla, K. D. Hildenbrand, N. Herrmann, J. Kuzminski, W. F. J. Mller, H. Stelzer,J. Toke, B.B. Back, S. Bjornholm and S.P. Sorensen, Phys. Rev. C 36 115 (1987).
- [16] Nayana Majumdar, PhD thesis, Investigations on Heavy Ion Induced Fission of Heavy Nuclei at Near and Sub-Coulomb Barrier Energies , University of Calcutta, India (1997)
- [17] D.J. Hinde, M. Dasgupta and A. Mukherjee, Phys. Rev. Lett. 89 282701 (2002).
- [18] K. Nishio, H. Ikezoe, Y. Nagame, M. Asai, K. Tsukada, S. Mitsuoka, K. Tsuruta, K. Satou, C.J. Lin and T. Ohsawa, Phys. Rev. Lett. 93 162701 (2004).
- [19] D. J. Hinde, M. Dasgupta, J. R. Leigh, J. C. Mein, C. R. Morton, J. O. Newton, and H. Timmers, Phys. Rev. C. 53 1290 (1996).
- [20] P. Moller, D.G. Madland, A.J. Sierk and A. Iwamoto, Nature 409 785 (2001).
- [21] Peter Moller, Arnold J. Sierk and Akira Iwamoto, Phys. Rev. Lett. 92 072501 (2004).
- [22] P. Moller and A.J. Sierk, Nature 422 485 (2003).
- [23] A. Iwamoto, T. Ichikawa, P. Moller and A.J. Seirk, Nucl. Phys. A 738 499 (2004)
- [24] Yoshihiro Aritomo and Masahisa Ohta, Nucl. Phys. A 744 3 (2004)
Chapter 6 Appendix
6.1 Statistical model of angular distribution
The Statistical Saddle Point Model (SSPM) was developed by Halpern and Strutinsky [1] to predict the angular distribution of the fission fragments yielded from the fission of a compound nucleus formed by the complete fusion of target and the projectile. The theoretical framework of the fragment angular distribution involves complete statistical equilibration of the tilting mode of the separating fragments in the intermediate composite system.
According to SSPM, the angular distribution can be described in terms of quantum numbers , the magnitude of the total angular momentum, of the fissioning nucleus; , the projection of along the space axis which can be identified with the direction of projectile, and , the projection along the symmetry axis of the system.
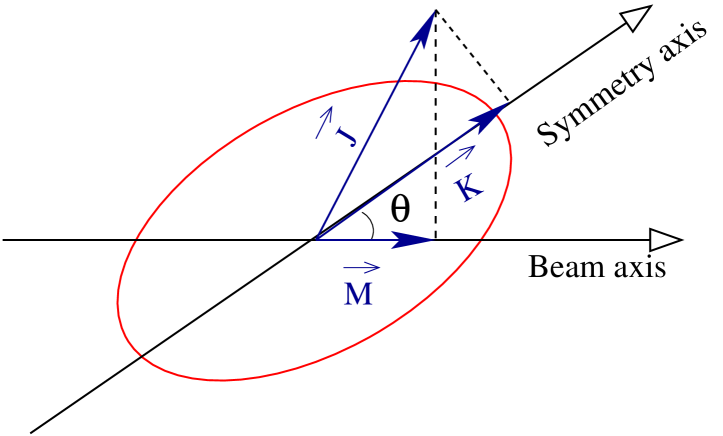
The quantum numbers describes the tilting mode of the fragments with respect to the space axis, designed by the angle . The quantum numbers and are conserved throughout various extended shapes during the passage of the fissioning nucleus from an initial state of formation of compound nucleus to final state of saddle point configuration, but there is no such quantum number . According to the assumption made, the final distribution is determined by distributions of the values which characterizes the initial states of the system at the saddle point and it is good quantum number beyond this point of fission process.
In the statistical limit, when the level density of the internal states of transition state is high, distribution may be obtained by the Boltzmann factor where is the rotational energy expended during the passage of the fissioning nucleus from the initial excited composite state to highly deformed transition state. The rotational energy can be written as,
| (6.1) |
where,
Here is the moment of inertia parallel to the symmetry axis and is the moment of inertia perpendicular to the symmetry axis.
The density of levels in the transition state is dependent on the thermodynamic energy available to the nucleus,
| (6.2) |
where E is the total energy and T is the temperature at the saddle point. For fixed E and T and J,
This is equivalent to a truncated Gaussian K distributions,
which is characterized by a variance
The probability of emitting fission fragments from a transition state with quantum numbers J,M and K at angle is given by
| (6.3) |
where represents the probability of emitting fission fragments at angle into the conical volume defined by the angular increment . The normalization is such that the probability integrates to unity for limits 0 to . The area of the angular ring on a sphere of radius R through which the fission fragments are passing is given by the width of the strip times the circumference of the ring . The annular ring area must be divided by the total area of the sphere in order to give the probability as given by .
The foregoing probability depends on function and is universal in the sense that it is independent of the polar angle, the angle of rotation about the symmetry axis and the moment of inertia. Hence, the probability distribution depends only on the angle between the space fixed and body fixed axis.
The functions are defined by the following relation:
| (6.4) |
where the sum is over x=0,1,2,….. and contains all terms in which no negative values appears in the denominator of the sum for any one of the quantities in parentheses. The angular distribution is obtained by dividing the probability for emitting fission fragments at angle by ,
| (6.5) |
The angular distribution of the fission fragments, produced due to the
fission of a completely fused nucleus mainly depends upon three factors:
(i) Transmission coefficient, for passage through the transition state
(ii) Level density
(iii) Probability distribution .
In the limit when the target and projectile spins are zero and no particle emission from the initial compound nucleus occurs before fission, i.e., M=0, the angular distributions for many J values and a Gaussian K distribution is given by,
| (6.6) |
The symmetric top wave function can be approximated as,
| (6.7) |
and by integrating over all J and K states
| (6.8) |
Thus, according to the SSPM model [2], the simplified expression for fission anisotropy is given as
| (6.9) |
Here is the variance of the K distribution and is the second moment of the compound nuclear spin distribution. is given as
| (6.10) |
where is the effective moment of inertia and T is the temperature at the saddle. The temperature T is given as
| (6.11) |
where is the level density parameter taken to be equal to /10 and is the effective excitation energy at the saddle.
6.1.1 Excitation function for 19F + 209Bi
The cross sections for the fissioning system of 19F + 209Bi were measured at five energies. The cross sections were obtained from the angular distribution data and were normalised to the elastic cross sections produced in the monitor detector. Further, the excitation function was normalised with respect to the data measured by Majumdar et al., [3] at higher energies. The experimental normalised fission cross-sections for various bombarding energies are listed in Table 6.1.
| (MeV) | (MeV) | (mb) |
|---|---|---|
| 99.5 | 91.2 | 318.0 |
| 95.5 | 87.5 | 151.4 |
| 89.5 | 82.0 | 12.5 |
| 87.5 | 80.2 | 3.0 |
| 85.5 | 78.3 | 1.1 |
The cross sections in unit of millibarn are illustrated in Fig. 6.2 as function of bombarding energies in the c.m. frame, by solid circles. The cross sections reported by Samant et al., [4] and Majumdar et al.,[3] are shown by open square and open triangles respectively. It is noted that earlier measurements agreed with present measurement.
The excitation function was fitted with the couple channel model. Using a modified computer code CCDEF [5] the mean square spin values were obtained. We have used four states of the projectile 19F: (i) 0.198 with 0.55, (ii) 1.346 with 0.33, (iii) 1.554 with 0.58 and (iv) 2.780 with 0.22. Taking the levels of the target 209Bi to be the same as 208Pb we have considered one vibrational states with 2.62 with 0.12 for the best fit of the data. The coupled channel calculation is shown by the solid line in Fig. 6.2. The mean square spin values at each energy was deduced from the above calculation.
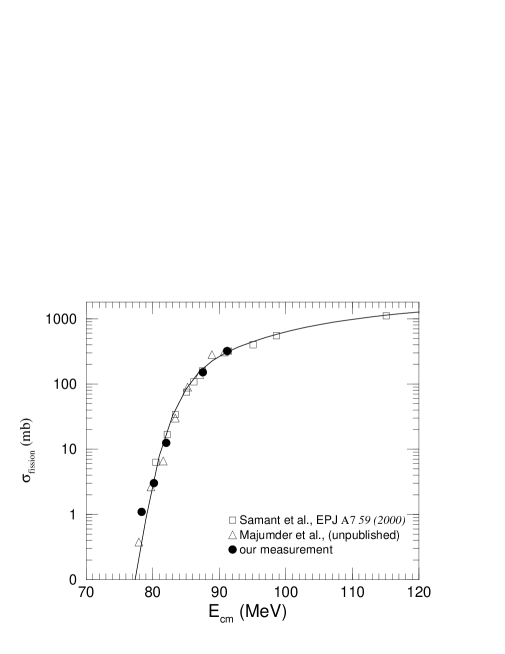
6.2 Statistical and dynamical aspects of mass distribution
From the microscopic point of view the phenomenon of fission is extremely complicated. As the fissioning nucleus is torn apart in a very short time, the motion of each individual nucleon is radically altered. The entire interval from the instant that some energy is imparted to the nucleus (e.g., by a neutron capture) to the time at which it is torn apart (scission) may be divided into two parts.
During the first interval of time, the imparted energy is redistributed among the nucleons over a comparatively large () period involving many nucleonic collisions. During this time, the energy that goes into the collective degrees of freedom causes increased deformation of the nucleus and this change in deformation takes place very slowly compared to the time of individual nucleonic motion. If none of the individual nucleons attains enough energy to escape the nucleus (e.g., by neutron emission), the imparted energy may be nearly all spent in causing a large critical deformation, beyond which the system is unstable. This metastable state is reached at the saddle point at the end of the first interval of time. Once the nucleus is over the saddle point, shape instability takes place and the nucleus can distort very easily to reach the point of scission.
The second time interval, from the saddle point to scission, is very short () and the separation of collective and intrinsic coordinates may not be meaningful at this stage, although there is evidence for the persistence of shell effects even here. Here we shall concentrate on the collective motion of the nucleus up to the saddle point, where we can still meaningfully describe the motion in terms of collective variables. There are two aspects of the problem:(i) the statics i.e., the potential energy surface of the nucleus with increasing deformation and (ii) the dynamics - it’s equation of motion. In the absence of any complete theory, it is instructive to construct intuitive models of fission to see whether the salient experimentally observed characteristics can be extracted and the liquid drop model is an attempt in this direction.
From the static approach in the frame work of the liquid drop model described above it is not possible to say how the energy is realised in the fission process is divided between the different degrees of freedom in the fissioning nucleus or what is the distribution of the corresponding variables. These are the problems whose solution ultimately leads to description of the distributions of the observed fragment characteristics: the masses, charges, kinetic energy and excitation energy. An important role here is placed by the stage of descent of the fissioning nucleus from the top of the barrier, which serves as the reference point for the process of release of the energy concentrated on the fissioning degree of freedom. This problem is solved in the frame work of statistical and dynamical models of the fission process.
The assumption of the statistical model are the simplest. This model is based on the assumption that in a considered distinguished state of the nucleus (for example, at the scission point or saddle point) the condition of statistical equilibrium with respect to all degrees of freedom is ensured. This is an assumption of the transition state model, justified by the argument that in the neighborhood of the saddle point the fission is the slowest. It is obvious that if the condition of statistical equilibration is to be realised at the scission point one must require that the exchange between the various degrees of freedom take place sufficiently rapidly compared with the descent time . In Fong’s model the exchange time is taken to be the characteristic nucleon time sec and this ensures the inequality:
The transition state model leads to the Bohr-Wheeler formula for the barrier penetrability:
| (6.12) |
where is the density of the transition states. In the Fermi gas model:
| (6.13) | |||
| (6.14) |
where is the level density parameter.
For the conditional barriers for fixed mass symmetric deformations and also an expansion of in the neighborhood of :
| (6.15) | |||
| (6.16) |
since at vanishes. As a mass-symmetric deformation, Strutinsky [6] took a quantity related to the ration of the volumes of the right () and left () parts, namely,
| (6.17) |
The dimensionless drop rigidity parameter for such variation of the shape
| (6.18) |
Thus,
| (6.19) |
So we can obtain the distribution of , the first approximation to which corresponds to the Gaussian distribution
| (6.20) |
We assume that the volumes of the parts of the saddle figure are proportional to the masses M and (A-M) of the future fragments, i.e.,
Therefore,
Using above equations we get,
| (6.21) |
where,
| (6.22) |
and is given by,
| (6.23) |
6.3 Solid angle correction to yields of a position sensitive detector
Let us assume that a small central segment of a MWPC, dx is located at a perpendicular distance, R, from the centre of a fission source. The solid angle subtended at the source by the segment is,
| (6.24) |
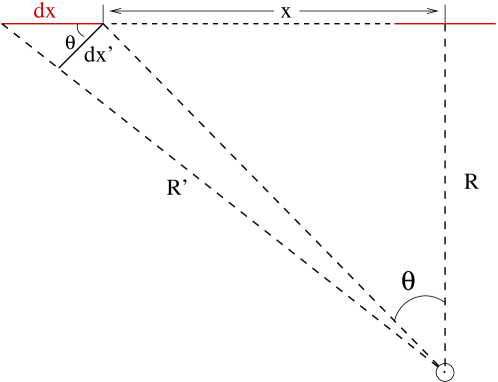
Any segment at the side of the PSD is similarly located at a distance of from the source. But the yield produced at this segment should be a function of angle it makes with the central segment. It is shown in Fig. 6.3, the angle is . The solid angle subtended by this segment at the source is,
| (6.25) |
The distance can be written as,
| (6.26) |
The length of the second segment is,
| (6.27) |
Combining the above equations one gets,
| (6.28) |
Then the correction factor for the yield at a side segment is which should be multiplied with the observed yields to obtain corrected yield due to solid angle effect.
6.4 Gas handling system
The operating pressure in the scattering chamber was required to be of the order of 2 torr. The MWPCs within the chamber were connected to a separate gas handling system, shown schematically in Fig 6.4, through two gas feed throughs attached to one of the side ports of the scattering chamber. One connecting valve was provided between the scattering chamber and the entrance-feed throughs of the detector. For pumping down the chamber, the bypass valve at the port of the chamber was required to be kept open to draw the air from the detectors and the gas handling system also, keeping all the valves open in the gas flow controlling system, except inlet control valve. After the rough vacuum of the order of torr was achieved, the connecting valve was closed to disconnect the chamber from the detectors and the chamber was further pumped down to 2 torr. The shunt and bypass valves in the flow handling system were then closed. For the operation of the MWPCs with a steady flow of gas, the gas flow through the detectors were controlled at pressure in the range of 1.5-3.0 torr by an electronic pressure controller (Make: MKS,USA). The flow rate of the gas through the detector was controlled by a metering valve.

Bibliography
- [1] I. Halpern and V. M. Strutinsky, in Proc. of 2nd International Conference on Peaceful Uses of Atomic Energy, (United Nations Publication, Geneva, 1958), Vol. 15, p 408.
- [2] R. Vandenbosch and J.R. Huizenga, Nuclear Fission, (Academic press, New York, 1973).
- [3] N. Majumdar et al., Private Communication.
- [4] A.M. Samant, S. Kailas, A. Chatterjee, A. Shrivastava, A. Navin and P. Singh, Eur. Phys. J. A.7 59 (2000).
- [5] J. Fernandez-Niello, C.H. Dasso and S. Landowne, Com. Phys. Comm. 54 409 (1989).
- [6] V.M. Strutinsky , Nucl. Phys. A 95 420 (1967)