A method to disentangle single- and multi-meson production in missing mass spectra from quasi-free reactions
Abstract
The separation of contributions from multi- and single-meson production in the missing mass spectrum of the quasi-free reaction constitutes a challenging task when the reaction is studied close to threshold. This is especially true if the resolution of the mass determination is comparable with the excess energy and if the investigated signal appears close to the kinematical limit. In this article we outline a method which permits the extraction of the signal originating from the creation of a single meson without the necessity of conducting model-dependent simulations. For the reactions, the method allows one to combine events corresponding to multi-meson production at various excess energies with respect to the process, and hence leads to an increase of the statistics needed for the determination of the shape of the multi-meson background.
As an example of the application of the method, we demonstrate that the evaluation of the data from the process according to the described technique enables one to extract a signal of the reaction whose shape is consistent with expectations, supporting the correctness and usefulness of the method introduced.
pacs:
13.60.Le, 13.85.Lq, 29.20.Dh1 Introduction
In recent years, after many very successful studies of the close-to-threshold production of mesons in proton-proton collisions [1, 2, 3, 4, 5], several experimental groups have extended the range of their investigations to proton-neutron scattering [6, 7, 8, 9, 10, 11, 12, 13, 14, 15, 16]. The results obtained can then be compared with theoretical models of the production of mesons in different isospin channels and this reduces significantly the ambiguities of such models. However, the experiments and the evaluation of the data from the proton-neutron interaction are much more difficult than measurements of proton-proton reactions. This is mainly due to having to use nuclear targets as a source of neutrons. In order to define the full kinematics of the events one needs to measure at least one more particle than for the analogous meson production in proton-proton scattering. This is because the determination of the four-momentum vector of the colliding quasi-free neutron requires the measurement of the non-interacting residue of the target nucleus (spectator) or the decay products of the created meson. In comparison to the meson reactions, the efficiency for registering the quasi free meson process is reduced by a large factor and, additionally, the resolution in the four-momentum of the investigated meson also worsens significantly. Therefore, in the evaluation of the data one faces problems of low statistics, which are especially important when the analysis demands subtraction of histograms and when the expected signal is close to the kinematical limit. Such is the situation when the quasi-free meson reaction is investigated by registering all the outgoing nucleons from the reaction, using the missing mass technique to identify the desired meson events. The subscript denotes the spectator proton which, it is assumed, does not take part in the reaction and stands for the single meson or multi-meson system.
An identification of the meson reaction on an event-by-event basis is impossible if only the nucleons are measured. One can, however, extract the number of registered meson events from the missing mass distribution provided that the contribution of the continuous spectrum originating from multi-pion production can be subtracted from the signal.
In this article, we describe a method for the subtraction of a physical multi-pion background from the missing mass spectrum for quasi-free reactions, where the decay products of the produced meson are not detected. Such a technique is clearly required in, e.g., the derivation of the correct number of and events from the missing mass spectra obtained by the COSY-11 collaboration [14, 15, 17].
In the next section we introduce the method in the idealized case where the number of events is infinite. This simplification will allow us to focus first on the problem of the proximity of the signal to the kinematical limit. After explaining the main ideas of the background subtraction, we will generalize the discussion to the situation encountered in real experimental conditions. Thus, in section 3 we will demonstrate how in the case of the low statistics one can use all events taken at negative excess energies and combine them to construct the shape of the background. Section 4 will be devoted to the justification of the assumptions made and finally in section 5 we will show an example of the application of the technique to data taken at the COSY-11 facility.
Though the method was developed for the analysis of the COSY-11 results, the conclusions are valid also for the production of the and other narrow mesons. Moreover, since the technique is independent of the detection system, it may be also applied when evaluating data obtained at other facilities.
2 Derivation of the background assuming infinite statistics
The COSY-11 facility used to investigate the quasi-free reactions is equipped with detectors for the registration of fast charged particles [18, 19], neutrons [20, 21], and slow spectator protons [9]. Experiments are conducted using the COSY proton beam [22, 23] incident on the internal deuteron cluster target [24, 25].
The total C.M. energy available for the proton-neutron scattering is fixed by the four-vectors of the incident and spectator protons. Due to the internal motion of the nucleons in the deuteron, this varies from event to event and in the region a range of about 60 MeV is scanned for a fixed beam momentum [14, 26, 27]. The four-momentum vectors of the beam and spectator protons are known for each registered event. Therefore, the collected data can be grouped according to the excess energy with respect to the process. The production of the meson can only occur if the excess energy ,
| (1) |
is positive. For negative only pions can be created.
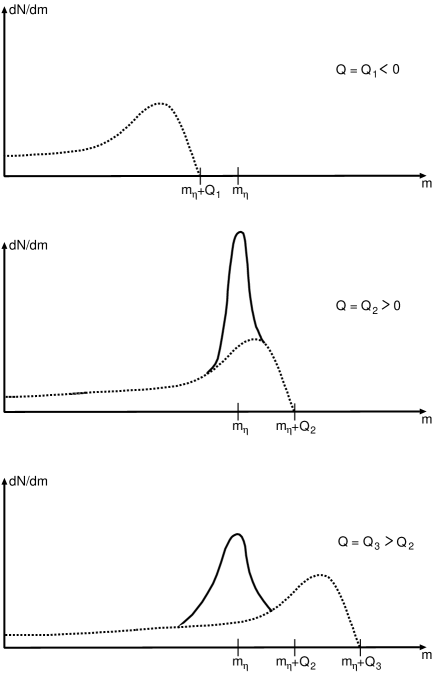
Fig. 1 shows in a schematic manner the mass distributions expected at three different values of for the unobserved system produced via the reaction. The upper panel presents an outlined missing mass spectrum when . The shape of this continuous distribution arises from a convolution of the real invariant mass distribution of the multi-pion system, the efficiency of the detection setup for the simultaneous registration of nucleons from the pions reaction, and also from the experimental resolution of the missing mass determination. For a signal from the meson is expected on top of the multi-pion mass distribution at a position corresponding to its mass, as shown in the middle panel of Fig. 1. For data at higher the peak from the meson will remain at the same position on the mass axis, though the distribution of multi-pion invariant mass will spread towards larger masses (lowest panel of Fig. 1), extending up to the kinematical limit. However, in practice, as will be argued later, the change of the multi-pion background can be approximated as a shift of the entire spectrum in the direction of higher masses.
In the case of the reaction measured at the COSY-11 facility, the experimental mass resolution amounted to about 5 MeV(FWHM) [29]. Therefore, for measurements at only few MeV above the threshold the shape of the pion background must be well known in order to extract the signal. The lack of a clear indication of the upper end of the signal resulting from the meson production (middle panel of Fig. 1) constitutes the main problem in disentangling the contributions from the meson and pions.
For simplicity of argumentation, let us first assume in subtracting the multi-pion background that the number of registered events is very large, such that one can neglect any statistical fluctuations, and that the shape of the reconstructed invariant mass of the multi-pion background is independent of the excess energy . The form of the background could then be determined from a missing mass spectrum from an infinitesimal range at any negative values . Having postulated that the shape of the background does not depend on , it is convenient to express it in terms of a normalised function of the difference between the kinematical limit () and the given mass .
Being not limited by statistics, one could divide the positive range into very narrow subranges within which the resultant missing mass spectrum would be the simple sum of a signal from the meson and the form multiplied by an appropriate factor. The discussed situation is depicted schematically in Fig. 2, where the lower panel shows the method of how to construct the background.
If the two assumptions mentioned above were valid then, in order to derive a signal of the meson from a missing mass spectrum for positive Q, it would be sufficient to subtract from this spectrum a missing mass distribution determined for negative after the shift of the latter to the kinematical limit (dotted line) and normalisation at the very low mass values where no events from the meson production are expected (dash-dotted line). In such a case the contribution of the reaction could be extracted without the necessity of any additional assumption regarding the unknown distribution of the background expressed as a function of the excess energy . In this case the analysis would not demand an exact knowledge of the dynamics of the background reactions.
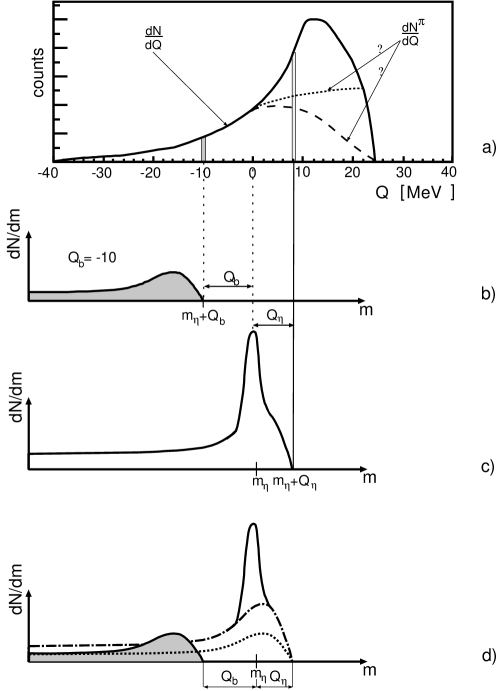
b), c) Form of the missing mass spectra as derived for the negative () and positive () values of . To each value of a continuous spectrum of masses can be assigned, originating e.g. from the reaction. However, there is always a unique relation between the value of and the maximum mass which can be created (). Therefore, for better visualisation, the axis of for the distribution and the mass axis of the missing mass spectra were arranged such that a maximum mass achievable for a given value of lies exactly below the corresponding value in the plot.
d) The shape of the background in the mass spectrum for can be constructed from the shape of the multi-pion mass distribution (shaded histogram) after its shift to the kinematical limit (dotted line) and subsequent normalisation at low masses (dash-dotted line).
3 Background estimation under the real experimental conditions
Due to the finite statistics, one needs to study the missing mass spectrum in finite intervals of . This does not influence the shape of the missing mass distribution arising from the reaction, though it alters the form of the multi-pion background. The latter , when derived from the finite range, becomes the convolution of the function and the number of background events expressed as a function of the excess energy . For the range spanned between and the missing mass distribution of the background can be expressed as:
| (2) |
In the spectrum we cannot extract the function in a model-independent way for positive values of (compare dashed and dotted lines in Fig. 2a). We must therefore take as narrow ranges of as reasonable, taking into account the experimental resolution in , and to assume that within such a range the function is constant. It is natural to take the width of the subranges equal to the FWHM of the resolution of the determination. Such a width choice partially validates the constant assumption, due to the unavoidable experimental smearing within the bin.
By reviewing the experimental distribution shown in the upper panel of Fig. 3, one recognizes that the obtained statistics are indeed insufficient to derive the spectrum from the bin of with a width equal to the experimental resolution (i.e. FWHM = 5 MeV). The statistics could, however, be improved significantly if all events registered with negative could be taken into account. This can be realized by adding to the missing mass calculated for a given event an amount (), which will shift the background events measured at such as if they were determined at the excess energy of . The resultant modified missing mass distribution obtained from the entire data sample of negative values can be identified with the function needed for the derivation of the background distribution within a finite excess energy bin centered around the value. In such a way, when investigating the missing mass spectrum for the bin, one would obtain directly the background spectrum which, after the normalisation, could be subtracted from the distribution containing the signal from the meson. When the number of events is small, this approach enables one to reduce significantly the statistical fluctuations in the background spectrum. However, as was already stressed, the entire procedure could only be justified if the shape of the background did not alter within the discussed range of the excess energy . Arguments in favour of this assumption will be presented in the subsequent section.
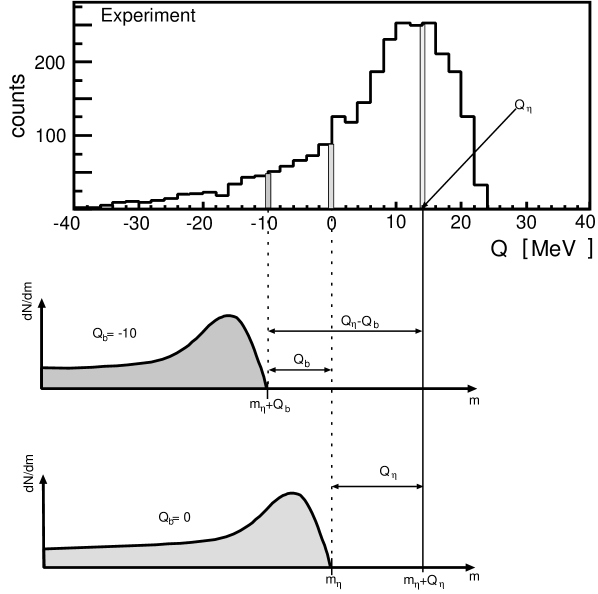
Lower panels: Scheme of the missing mass distribution for two arbitrarily chosen values of .
4 Why does the experimental multi-pion background not change significantly with variation of the excess energy?
We now present arguments supporting the supposition that the measured shape of the background does not alter significantly with changes in excess energy, at least over the energy range studied. It is important to stress that this assumption worked correctly when evaluating the data of the reactions [32] and [28] and that the derived cross sections are consistent with those obtained at the SATURNE facility [33].
As already mentioned, the shape of the background spectrum reflects i) the real distribution of the invariant mass of the multi-pion systems, ii) the acceptance of the detection setup, and iii) the experimental resolution. The acceptance of the detection system, its efficiency and resolution do not change significantly over the considered variation of excess energy. On the level of a few per cent, this is true even in the case of the detection setups characterized by a very limited geometrical acceptance, such as e.g. the COSY-11 facility [34]. The shape of the genuine background distribution is the only significant factor that is relevant to our discussion. In practice, from the high statistics measurements of the reaction, we know that the shape of the background could be sufficiently well described assuming that it was due to two-pion creation only [35, 36, 37]. Adding into the simulations three- and four-pion events was superfluous, and did not improve the agreement with the experimental distributions significantly.


(Middle panel) Comparison between the distributions calculated regarding resonance production and FSI for = 20 MeV (solid line) and = 0 MeV (dotted line). The latter is shifted by 20 MeV.
(Lower panel) Difference between the spectra of the middle panel normalised to the solid line:
.
Fig. 4 demonstrates the missing mass distribution of system produced via the reaction calculated taking into account experimental resolution of the detection system and various creation scenarios.


When increases the distribution of the multi-pion invariant mass broadens towards larger masses. In practice, if the change in the value of is small compared to the excess energy with respect to threshold of the reaction, the shape of the mass distribution at its edge remains approximately unaltered. Of interest for us is the range of about 40 MeV/c2 from the higher mass limit. The events represented by the solid and dotted lines in the middle panel of Fig. 4 were simulated at excess energies of Q = 20 and Q = 0 MeV with respect to the system. From the comparison of the form of both spectra one realises that at the edges there is no noticeable difference between the shape of the curves. Thus, this shape, convoluted with an acceptance function independent of the value, will lead to the form of the background which will be a function only of the distance from the kinematical limit, over at least a range of about 40 MeV.
The quantitative appraisals of the systematical error caused by the subtraction of the shifted and normalized spectra is depicted in the lower panel of figure 4. This picture demonstrates a fractional systematical error due to the discussed method. It was calculated as a difference between the mass distributions at Q = 20 MeV and Q = 0 MeV normalized to the (Q = 20 MeV). From the figure one can infer that the systematical error in the missing mass range pertinent to our discussion (close to the kinematical limit) is in the order of a few per cent of the background value. In the middle and lower panels of Fig. 4 we show the comparison for the production model depicted by the dashed-dotted line in the upper panel, however, we have checked that for other discussed possibilities the determined systematical error is similar.
It is worth noting that in the case of the meson, due to its twice larger mass, the relative changes between dotted and solid lines are even smaller (see upper panel of Fig. 5), and hence the advocated assumption is even better justified. The lower panel of Fig. 5 indicates that the fractional error due to the changes in the shape is in the order of one per cent only within the range of 200 MeV in the vicinity of the kinematical limit.
5 Example of application
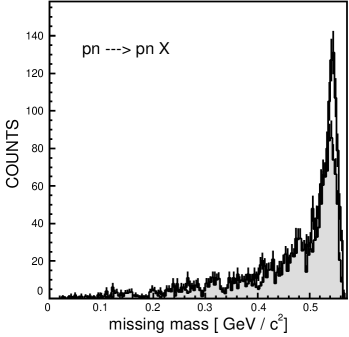
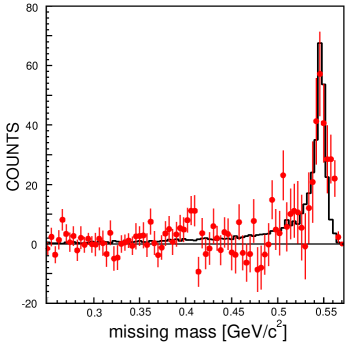
Recently the and mesons production in the proton-neutron collisions has been studied close to the kinematical threshold at the COSY-11 facility [14, 15, 17]. Although the evaluation of these data is still in progress, the first trials to distinguish between the multi-pion background and the meson production in the missing mass spectra lead to a clear signal for the reaction. Fig. 6a shows the sum of the missing mass spectra for all bins (solid line) and the sum of the corresponding background spectra (shaded histogram).
a)
b)
The data were evaluated as follows. First the sample of events with excess energy greater than zero was divided into a few intervals of and a missing mass spectrum was calculated for each sub-sample separately. Next, for each of these spectra, determined in interval around a given value, a background was constructed from all events with less than zero. The missing mass of each background event, measured at given excess energy , was increased by an amount , as depicted in Fig. 3 and described in section 3. For each interval separately, the background spectrum was normalised to the distribution at a given for mass values less than 0.25 GeV/c2. In this region the events correspond to a single pion production, and since the energy is high above the threshold the cross section for production stays nearly constant when the excess energy changes only by few tens of MeV.
In order to make a check of the background extraction we have constructed it dividing the range of Q values into two parts equal in number of counts. The comparison of the spectra resulted from the two parts is shown in Fig. 7. Indeed, the determined spectra from different ranges of Q are consistent within the statistical errors.

Fig. 6b depicts the spectrum of the missing mass for after the background subtraction. The superimposed line indicates the expectations from the Monte-Carlo simulations, taking into account the momentum spread of the beam [39], Fermi momentum of the nucleons inside the deuteron [30, 31, 29], beam and target dimensions [39], multiple scattering in the detector components and air, and position-, time- and energy- resolution of all detector components [18, 19, 20, 35, 40]. Clearly, within the statistical uncertainties, the results of simulations conform very well to the shape of the observed distribution.
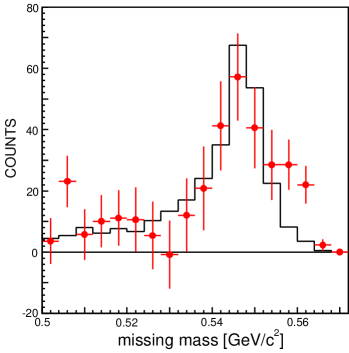
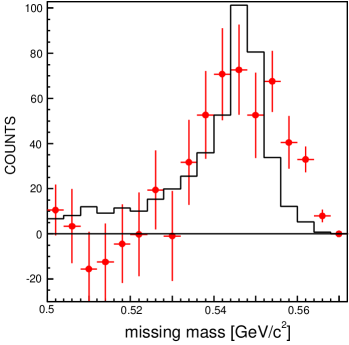
For a better visualisation, the sums for all intervals are shown in Figs. 6a and 6b because the individual spectra are statistically much less significant, due to the small number of events in this first measurement, which was meant only as a feasibility test of the COSY-11 facility for the study of the meson production via quasi-free proton-neutron scattering. A more detailed view of the region around the peak is shown in Fig. 8a. For comparison we present also in Fig. 8b the result obtained before the current method was elaborated [14]. This first analysis was done by deriving a missing mass background spectrum from all events with without adding (event-by-event) the difference of excess energies between a corresponding background event and that from the bin for which the signal of meson was being studied.
a)
b)
Although at first sight both spectra look similar, on closer inspection one recognizes that the left hand histogram agrees statistically much better with the experimentally extracted data than that on the right. The difference is understandable since the shift of the background to the kinematical limit diminishes the number of background events on the left of the eta-peak and increases that on the right (see Fig. 9), leading to the better agreement with the shape predicted by the Monte-Carlo studies. Moreover, the total number of events assigned to the reaction, when extracted according to the new procedure, is by about 30% lower than previously estimated [17] and now conforms better to the results obtained by the WASA/PROMICE collaboration [6], where photons from the decay of the were detected.

Finally in Fig. 10 we present a function determined for the positive values of Q. One can see that the distribution for positive values of Q is rather not constant within the bin contrary to the assumption made when constructing the background. Therefore, we have made an iterative procedure and construct a background taking in formula 2 the obtained distributuion of . The result was statistically the same even after the first iteration. This can be understood since the width of the bin is rather small compared to the mass resolution. One bin at the mass spectrum (eg. in figure 8 ) corresponds to 4 MeV. Therefore, even though the significantly differs from being constant it hardly influences the spectrum within the present statistics. A larger sample of data will enable to determine iteratively more precisely and hence will permit to obtain results not biased by the assumption that is constant within a studied bin.

6 Summary
A technique for disentangling contributions of multi-pion and single meson production in the missing mass spectrum of quasi-free reactions has been presented. The method enables one to extract a signal for the meson reactions measured close to the threshold, when the mass resolution is comparable with the centre-of-mass excess energy. In this energy range the peak in the missing mass spectrum from the single meson creation is close to the kinematical limit and the separation of the signal due to the single meson from that of the continuous distribution associated with multi-pion production becomes nontrivial. It was also shown how to combine events of different excess energies in order to gain statistical significance in the determination of the shape of the multi-pion mass distribution.
In the case of the reaction measured by the COSY-11 collaboration [14], we demonstrated that the method leads to the derivation of the signal from the quasi-free process that is consistent with expectations. This successful application, and the fact that the technique is independent of the detection system, suggests that it can be applied more generally for distinguishing between single and multi-meson production in missing mass spectra obtained in reactions.
The presented method will be used for the extraction of the signal from data on meson production via the reaction [41], whose rate is expected to be about forty times lower than that for the meson. These cross sections are utterly unknown and their determination may be of crucial importance for the study of the gluonic degrees of freedom in the and meson production processes [42].
Acknowledgments
We appreciate very much a helpful communication with Colin Wilkin and we are grateful for his valuable correction of the manuscript. We acknowledge the support of the European Community-Research Infrastructure Activity under the FP6 ”Structuring the European Research Area” programme (HadronPhysics, contract number RII3-CT-2004-506078), of the FFE grants (41266606 and 41266654) from the Research Centre Jülich, of the DAAD Exchange Programme (PPP-Polen), of the Polish State Committee for Scientific Research (grant No. PB1060/P03/2004/26), and of the RII3/CT/2004/506078 - Hadron Physics-Activity -N4:EtaMesonNet.
References
- [1] Fäldt G, Johansson T, Wilkin C 2002 Phys. Scripta T99 146
- [2] Hanhart C 2004 Phys. Rept. 397 155
- [3] Moskal P, Wolke M, Khoukaz A, Oelert W 2002 Prog. Part. Nucl. Phys. 49 1
- [4] Machner H, Haidenbauer J 1999 J. Phys. G 25 R231
- [5] Fäldt G, Wilkin C 2001 Phys. Scripta 64 427
- [6] Calén H et al 1998 Phys. Rev. C 58 2667
- [7] Calén H et al 1997 Phys. Rev. Lett. 79 2642
- [8] Calén H et al 1998 Phys. Rev. Lett. 80 2069
- [9] Bilger R et al 2001 Nucl. Inst. & Meth. A 457 64
- [10] Złomańczuk J et al 2001 AIP Conf. Proc. 603 211
-
[11]
Kuhlmann E et al 2005 Ann. Rep. 2004, IKP, FZ-Jülich
http://www.fz-juelich.de/ikp/COSY-TOF/publikationen/index_e.html. - [12] Barsov S et al 2004 Eur. Phys. J. A 21 521
- [13] Lehmann I et al 2004 Nucl. Instr. Meth. A 530 275
-
[14]
Moskal P et al 2004
AIP Conf. Proc. 717 907
e-Print Archive: nucl-ex/0311003 - [15] Przerwa J et al 2005 e-Print Archive: hep-ex/0507076, AIP Conf. Proc. 2005 796 164
- [16] Adam H.-H et al 2004 e-Print Archive: nucl-ex/0411038, Proposal for the Wide Angle Shower Apparatus (WASA) at COSY-Jülich
- [17] Janusz M et al 2004 Schriften des FZ-Jülich: Matter Materials 21 238
- [18] Brauksiepe S et al 1996 Nucl. Instr. and Meth. A 376 397
-
[19]
Smyrski J et al 2005
Nucl. Instr. Meth. A 541 574
e-Print Archive: nucl-ex/0501023 - [20] Przerwa J 2004 e-Print Archive: hep-ex/0408016, diploma thesis, Jagellonian U.
- [21] Przerwa J et al 2005 Int. J. Mod. Phys. A 20 625
- [22] Maier R Nucl. Instr. & Meth. 1997 A 390 1
- [23] Prasuhn D et al 2000 Nucl. Instr. & Meth. A 441 167
- [24] Dombrowski H et al 1997 Nucl. Instr. & Meth. A 386 228
- [25] Khoukaz A et al 1999 Eur. Phys. J. D 5 275
-
[26]
Moskal P 2002
Schriften des FZ-Jülich: Matter & Materials 11 27
e-Print Archive: nucl-ex/0110001 - [27] Stepaniak J, Calén H 2004 e-Print Archive: nucl-ex/0412025
- [28] Smyrski J et al 2000 Phys. Lett. B 474 182
-
[29]
Czyżykiewicz R 2002 diploma thesis, Jagellonian University,
Berichte des FZ-Jülich, Jül-4017
available at: http://ikpe1101.ikp.kfa-juelich.de/. - [30] Lacombe M et al 1981 Phys. Lett. 101B 139
- [31] Lacombe M et al 1980 Phys. Rev. C 21 861
-
[32]
Moskal P et al 1998 Phys. Rev. Lett. 80 3202
Moskal P et al 2000 Phys. Lett. B 474 416 - [33] Hibou F et al 1998 Phys. Lett. B 438 41
- [34] Moskal P et al 2003 J. Phys. G 29 2235
- [35] Moskal P 2004 e-Print Archive: hep-ph/0408162, habilitation thesis, Jagellonian U.
- [36] Moskal P et al 2004 Phys. Rev. C 69 025203
-
[37]
Roderburg E, Żuprański P et al 2005
Ann. Rep. 2004, IKP, FZ-Jülich
http://www.fz-juelich.de/ikp/COSY-TOF/publikationen/index_e.html. - [38] Brodowski W et al 2002 Phys. Rev. Lett. 88 192301
- [39] Moskal P et al 2001 Nucl. Instr. Meth. A 466 448
- [40] Wolke M 1998 PhD thesis, University of Bonn; Berichte des FZ-Jülich, Jül-3532, available at: http://ikpe1101.ikp.kfa-juelich.de/.
-
[41]
Przerwa J et al 2005 Ann. Rep. 2004, IKP, FZ-Jülich
available at: http://ikpe1101.ikp.kfa-juelich.de/. - [42] Bass S D 1999 Phys. Lett. B 463 286; Bass S D 2001 Phys. Scripta T 99 96; Bass S D 2001 e-Print Archive: hep-ph/0108187; e-Print Archive: hep-ph/0006348.