The NA49 collaboration
Upper Limit of D0 Production in Central Pb-Pb Collisions
at 158 GeV
Abstract
Results are presented from a search for the decays and in a sample of central Pb-Pb events collected with a beam energy of 158 GeV by NA49 at the CERN SPS. No signal is observed. An upper limit on production is derived and compared to predictions from several models.
pacs:
25.75.DwThe measurement of open charm production in heavy-ion interactions is of considerable interest because charm, due to its large mass, is predominantly created at the early stage of the collision when the energy density is large. Because of the hard scale involved, perturbative QCD (pQCD) calculations can serve as a baseline for the study of the production mechanisms and the dynamical evolution of charm in these collisions.
At present, no direct measurement exists of open charm production in heavy-ion interactions at SPS energies. The NA38/50 experiment has, however, observed a significant enhancement of di-muon production in the intermediate mass range of 1.5–2.5 GeV, compared to di-muon yields expected from the Drell-Yan continuum and semi-leptonic charm decays ref:na3850 . The origin of this enhancement is presently not clear but can be explained by assuming that open charm production in central Pb-Pb collisions is about a factor of 3.5 times larger than predicted by pQCD. This enhancement is currently under investigation by the NA60 experiment ref:na60 .
A variety of models give very different estimates for the open charm yields at the SPS. For instance, for central Pb-Pb interactions at 158 GeV beam energy, a pQCD calculation based on Pythia predicts a yield per event of (the centrality is here characterized by the number of participant nucleons ) ref:pbmcharm . In ref:gorenstein , a yield of 0.5–0.6 quark pairs is calculated, based on the J/ yield measured by NA50 and the statistical coalescence model (). This translates into if one assumes that about one third of the hadronize into and , like in p-p interactions ref:lebc . The ALCOR hadronization model ref:alcor gives a much larger estimate of (). An even larger yield of is predicted by the statistical model of the early stage (SMES) which assumes charm equilibration in a deconfined quark-gluon plasma (QGP) at the early stage of the Pb-Pb interaction () ref:smes .
To discriminate between the different model predictions and to possibly identify the origin of the di-muon enhancement seen by NA38/50, we have performed a search for open charm, using invariant mass reconstruction, in a large data sample of about four million central Pb-Pb events collected at 158 GeV beam energy.
The NA49 detector ref:na49nimpaper is a large acceptance fixed-target hadron spectrometer at the CERN SPS. Tracking is performed by four large-volume TPCs. Two of these are placed one behind the other inside two super-conducting dipole magnets (vertex TPCs). The two other (main) TPCs are placed downstream of the magnets left and right of the beam line. These main TPCs increase the lever arm of the track reconstruction and are optimized for particle identification through a measurement of the specific energy loss () with a relative resolution of about 4%. The combined TPCs provide an accurate measurement of the particle momenta with a resolution of (GeV/)-1. Centrality selection is based on a measurement of the energy deposited by the projectile spectator nucleons in a forward calorimeter.
To measure rare particles like the ref:omegapap and to search for open charm a large sample of central Pb-Pb events was taken in the year 2000 with a beam energy of 158 GeV. In this run events were collected with a centrality selection of 23.5% of the inelastic cross-section (). Also included in the present analysis is a 1996 data set of Pb-Pb events, taken at the same beam energy but with a 10% centrality selection (). To increase the data acquisition speed and decrease the data volume only every second time-sample of the TPCs was read out during the 2000 run (256 instead of 512 time-samples). The reduced sampling did not significantly affect the track reconstruction nor the measurement.
The were reconstructed via their charged particle decays and (4% branching ratio). Because the secondary vertex resolution of about 1 cm is not sufficient to detect the decay vertex ( mm), the candidates were identified by selecting a window around the mass in the invariant mass spectrum of the daughter particles. With a multiplicity of approximately 1400 reconstructed charged tracks, about entries for each event were made in each of the and invariant mass spectra leading to a large combinatorial background. Because of the large multiplicities it was not possible to measure the 3-particle decay even though the background in this channel is suppressed by kinematic constraints.
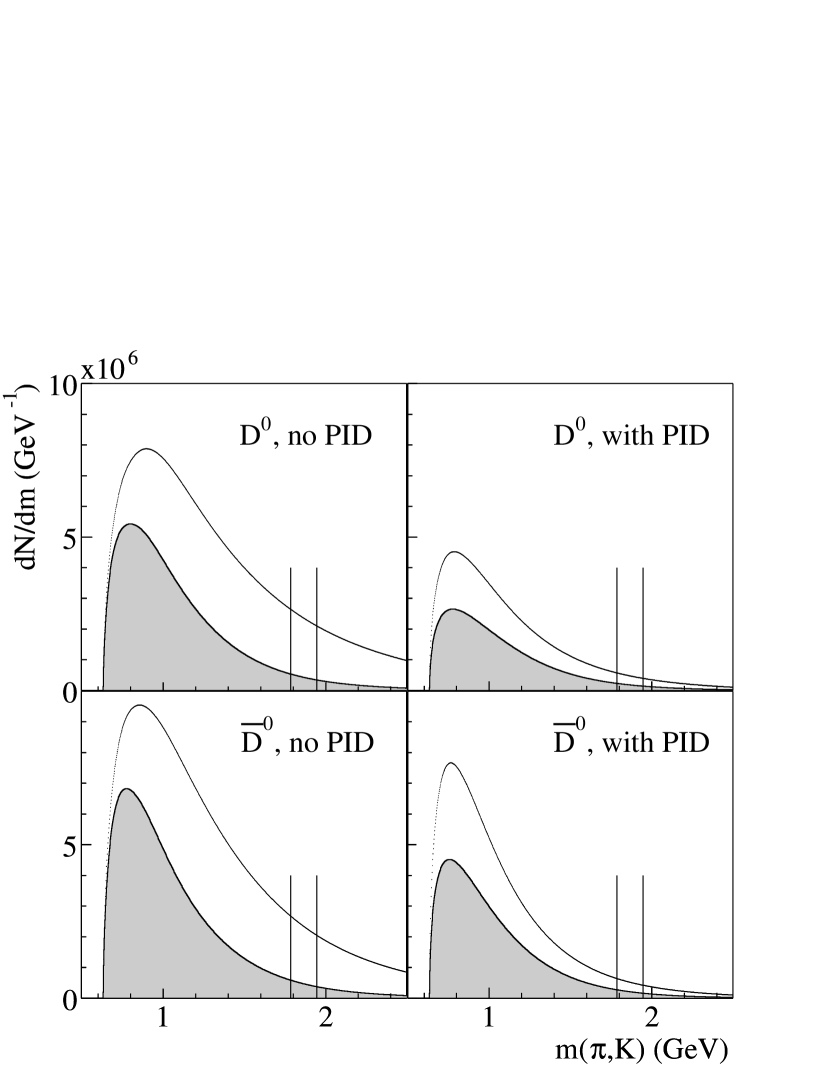
Events for which the primary vertex could not be determined were discarded from the analysis. Several track quality cuts ref:marcothesis were applied to remove non-vertex or badly reconstructed tracks. The remaining sample was sub-divided into two classes. The tracks in the first class have sufficient track length in the main TPCs and low enough momentum so that a significant enrichment of the kaon content could be achieved by suitable cuts on . For tracks in the second class this kaon identification was not possible. Loose cuts on ( around the Bethe-Bloch curve) were applied on the tracks in the first sample to minimize the loss of kaons (and ). The identified kaon tracks were then combined with all oppositely charged tracks and the invariant mass of the pair was calculated assuming that the associated track was a pion. In the second class (without ) the invariant mass of the () candidate was calculated for all pairs of oppositely charged tracks assuming that the positive track was a pion (kaon) and the negative track a kaon (pion). The invariant mass distributions obtained from the and samples with and without kaon identification (corrected for acceptance and efficiency, see below) are shown by the open histograms in Fig. 1.
To further reduce the combinatorial background, decay angle cuts were applied as follows. For each candidate the polar angle and the azimuthal angle of the kaon track were calculated in the rest-frame of the . Here is the angle between the beam direction and the kaon flight direction and the angle between the kaon and the flight direction of the in the plane perpendicular to the beam. In the left-hand side plot of Fig. 2 is shown the distribution of decay angles from simulated decays (see below). The distribution from real events (almost entirely background) is shown in the right-hand side plot. It is clear from this figure that the signal distribution is approximately flat while the background distribution peaks at large values of .
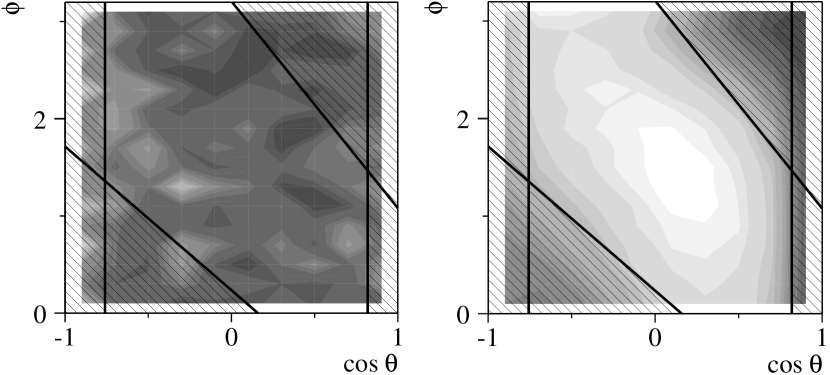
Cuts, like those shown in the figure, were optimized to maximize the significance () of the measurement. Because the decay angle distribution depends on the transverse momentum () of the and is different for the samples with and without particle identification, separate cuts were determined, for each of the two samples, in five bins of 400 MeV width. The decay angle cuts reduced the background by a factor of about 3 (10) in the sample with (without) particle identification. (The signal is reduced by 30–40%.) Cuts on other kinematic variables like rapidity () and were investigated but were found to be ineffective in the separation of signal and background ref:marcothesis . The invariant mass distributions after the decay angle cuts and corrected for acceptance and efficiency (see below) are shown by the shaded histograms in Fig. 1.
To determine acceptance, efficiency and mass resolution a Monte Carlo sample of and mesons was generated with a Gaussian distribution in () and an exponential distribution in transverse mass (300 MeV inverse slope parameter). The () and their decay particles were transported through the NA49 detector geometry using GEANT 3.21 ref:geant , followed by a detailed simulation of the TPC response using dedicated NA49 software. The simulated raw data were added to real events and subjected to the same reconstruction procedure as the experimental data. The acceptance was calculated in bins of and as the fraction of () which are geometrically accepted, survive the reconstruction procedure and pass the analysis cuts. The experimental acceptance covers the range and and is found to be, on average, 8.4 (12.0)% for the sample with (without) kaon identification. It was verified that the amount of accepted particles varied by only 10–20% if reasonable alternatives (e.g. from Pythia ref:pythia ) were chosen for the kinematic distribution of the . The invariant mass distributions shown in Fig. 1 are divided by the acceptance and by the branching ratio for decay.
The simulated data served to determine the shape of the invariant mass distribution of reconstructed as shown in Fig. 3.
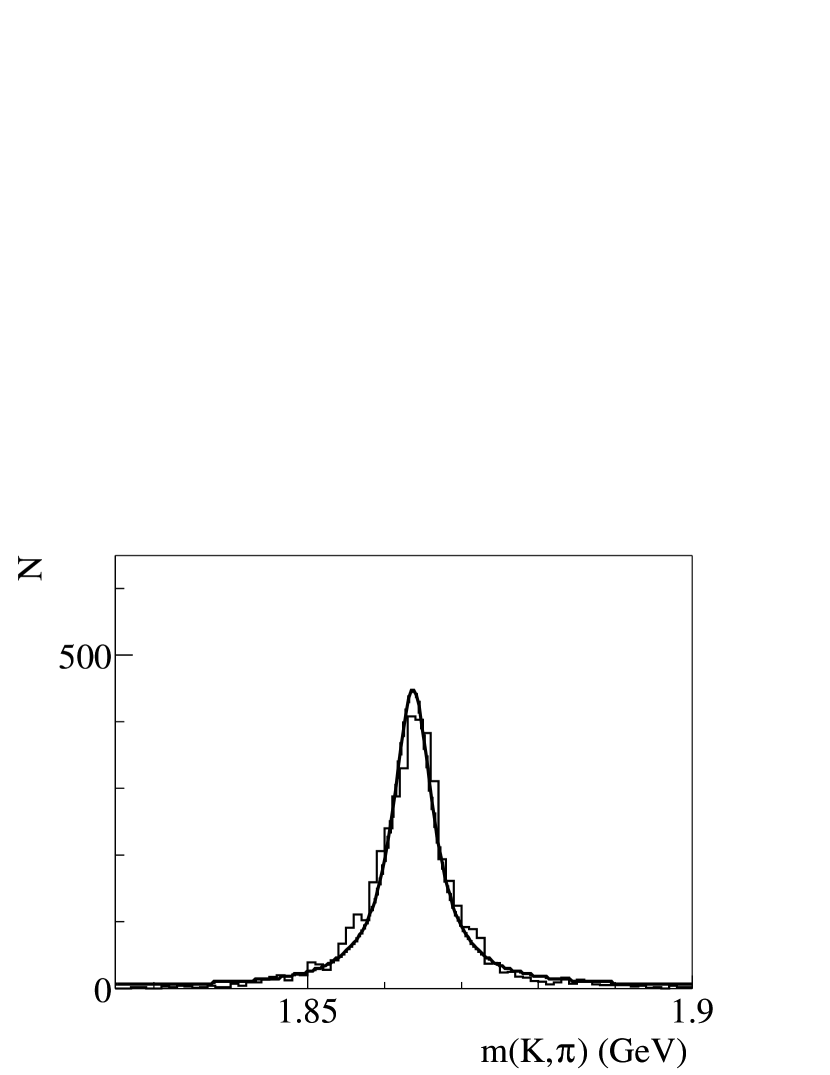
The shape can be well described by a Cauchy distribution (curve in Fig. 3)
| (1) |
where is the total yield per event, the mass and the width of the distribution. This width is almost entirely determined by the detector resolution and is found to be MeV with the mass of the set to MeV ref:pdg .
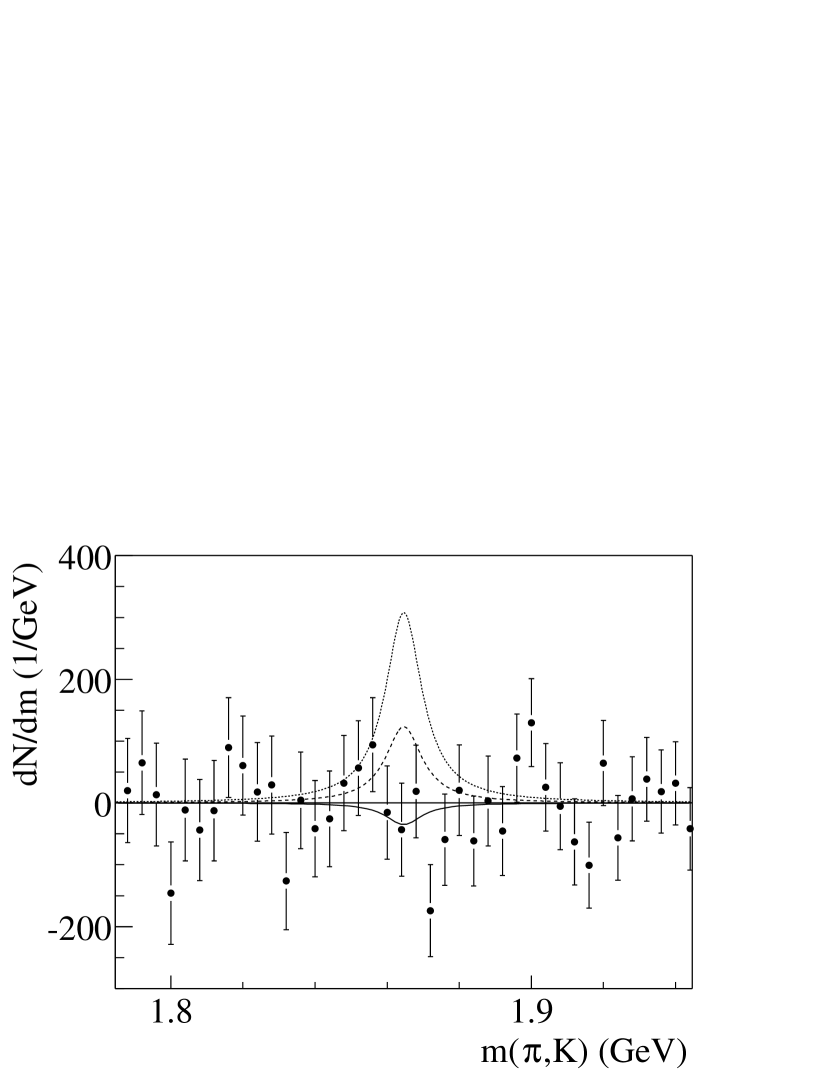
The invariant mass spectra shown in Fig. 1 were fitted (by minimization) in a region of MeV around the nominal mass to the sum of a signal distribution, Eq. (1), and a fourth order polynomial describing the background. The position and width of the signal distribution were kept fixed to the values given above while the normalization was left a free parameter in the fit. This fit results in yields (per event) of and , where the errors are statistical only. In Fig. 4 is shown the invariant mass distribution of the candidates after background subtraction. Clearly no signal is observed. The fit gave for the total yield a value of per event (full line in Fig. 4).
An upper limit for the number of per event is estimated in a Bayesian approach ref:sivia . Here the likelihood (i.e. the conditional probability density distribution of the data, given per event) is parameterized as a Gaussian
| (2) |
with mean and width as obtained from the fit. Using Bayes’ theorem the posterior distribution is calculated by multiplying the likelihood with an assumed prior probability distribution of which is taken here to be zero for and uniform for .
This prior distribution forces to be positive, as it should be. Integration of the posterior distribution gives for the confidence level
| (3) |
where is the upper limit of corresponding to the confidence level CL. The denominator on the right-hand side of Eq. (3) accounts for the proper normalization of . Using the fitted values of and , the upper limit for the total yield is found to be per event at 98% CL.
Because no signal has been observed it is not possible to directly verify the Monte Carlo prediction of the signal shape. To investigate the sensitivity of the upper limit to the width of the mass peak the fits were repeated with MeV. This resulted in , , and an upper limit of per event at 98% CL. We remark that increasing the Monte Carlo estimate of the width by a factor of two should be considered a very generous error on .
Taking as a standard for comparison the pQCD estimate of mentioned in the introduction, we conclude that an enhancement of charm production by more than a factor of 5–10 at the SPS is very unlikely. Due to the large combinatorial background it is not possible to confirm, nor exclude, a charm enhancement by a factor of three allowed by the NA38/50 measurement. However, the upper limit from this analysis is only marginally compatible with the yield estimated by the ALCOR model (dashed curve in Fig. 4) and clearly incompatible with the equilibrium yield of charm in a QGP as predicted by the SMES (dotted curve in Fig. 4). The latter observation does not necessarily exclude QGP formation at SPS energies provided that the QGP life time is shorter than the equilibration time of charm.
Acknowledgements.
This work was supported by the US Department of Energy Grant DE-FG03-97ER41020/A000, the Bundesministerium fur Bildung und Forschung, Germany, the Virtual Institute VI-146 of Helmholtz Gemeinschaft, Germany, the Polish State Committee for Scientific Research (2 P03B 130 23, SPB/CERN/P-03/Dz 446/2002-2004, 2 P03B 04123), the Hungarian Scientific Research Foundation (T032648, T032293, T043514), the Hungarian National Science Foundation, OTKA, (F034707), the Polish-German Foundation, and the Korea Research Foundation Grant (KRF-2003-070-C00015).References
- (1) M.C. Abreu et al. (NA38 and NA50 Collaboration), Eur. Phys. J. C 14, 443 (2000).
- (2) A. Baldit et al. (NA60 Collaboration), CERN/SPSC-2000-010 (2000).
- (3) P. Braun-Munziger et al., Eur. Phys. J. C 1, 123 (1998); P. Braun-Munziger and J. Stachel, Phys. Lett. B490, 196 (2000).
- (4) M.I. Gorenstein et al., Phys. Lett. B509, 277 (2001).
- (5) M. Aguilar-Benitez et al. (LEBC-EHS Collaboration), Z. Phys. C 40, 321 (1988).
- (6) P. Lévai et al., J. Phys. G 27, 703 (2001).
- (7) M. Gaździcki and M.I. Gorenstein, Acta Phys. Pol. B 30, 2705 (1999); M. Gaździcki and C. Markert, Acta Phys. Pol. B 31, 965 (2000).
- (8) S. Afanasiev et al. (NA49 Collaboration), Nucl. Instrum. Methods A 430, 210 (1999).
- (9) C. Alt et al. (NA49 Collaboration), Phys. Rev. Lett. 94, 192301 (2005).
- (10) M. van Leeuwen, Ph. D. thesis, University of Utrecht, 2003. Available from http://na49info.cern.ch.
- (11) R. Brun et al., Geant User Guide and Reference Manual, CERN-DD-78-2-REV (1978).
- (12) T. Sjöstrand et al., Comput. Phys. Commun. 135, 238 (2001).
- (13) K. Hagiwara et al. (Particle Data Group), Phys. Rev. D 66, 010001 (2002).
- (14) D.S. Sivia, Data Analysis—a Bayesian Tutorial, (Oxford University Press, Oxford, 1997).