ICANS-XVII
17th Meeting of the International Collaboration on Advanced Neutron Sources
April 25-29, 2005
Santa Fe, New Mexico
The NPDGamma Experiment at LANSCE
Abstract
The NPDGamma collaboration has constructed and commissioned an apparatus to determine the size of the pion-nucleon coupling constant in the parity non conserving pion exchange weak potential for N-N interactions. This coupling constant is directly proportional to the parity violating up-down asymmetry in the angular distribution of -rays with respect to the neutron spin direction in the capture of polarized cold neutrons on protons. The measurement of the weak coupling will provide a test for the effective theory, describing the nucleon-nucleon interaction as mediated by the exchange of mesons, and provide results against which to compare models describing QCD at low energy. NPDGamma is located at the Los Alamos Neutron Science Center (LANSCE) and utilizes the special features of cold spallation neutrons to make it possible to measure very small -ray asymmetries. In this paper, we present the motivation for the experiment and report on experimental setup as well as the current status of the project and the results obtained during the 2004 commissioning run including parity violation asymmetry measurements on Al, , In, , and Cu.
aLos Alamos National Laboratory, Los Alamos, New Mexico 87545, USA
bIndiana University, Bloomington, Indiana 47405, USA
cUniversity of Manitoba, Winnipeg, Manitoba R3T 2N2, Canada
dUniversity of New Hampshire, Durham, NH 03824, USA
eTRIUMF, 4004 Wesbrook Mall, Vancouver, British Columbia V6T 2A3, Canada
fOak Ridge National Laboratory, Oak Ridge, TN 37831, USA
gUniversity of Tennessee, Knoxville, TN 37996, USA
hUniversity of Michigan, Ann Arbor, MI 48104, USA
iUniversity of Dayton, Dayton, OH 45469, USA
jThomas Jefferson National Accelerator Facility, Newport News VA 23606,USA
kHigh Energy Accelerator Research Organization (KEK), Tukubash-shi, 305-0801, Japan
lUniversity of California at Berkeley, Berkeley CA 94720-7300, USA
mNational Institute of Standards and Technology, Gaithersburg, MD 20899-0001, USA
nHamilton College, Clinton, NY 13323, USA
oJoint Institute for Nuclear Research, Dubna, Russia
pNorth Carolina State University, Raleigh, NC 27695, USA
1 Introduction
Since 1980, the weak parity-violating nucleon-nucleon interaction has typically been described by a meson-exchange potential involving seven weak meson-nucleon coupling constants [1]. The weak interaction changes the parity and isospin () of the nucleon-nucleon pair and perturbatively introduces parity violating admixtures in nuclear wave functions. The study of the hadronic weak interaction is of great relevance for low energy, non-perturbative QCD. The hadronic weak couplings probe short range correlations between quarks because the quark-quark weak interaction occurs when the distance between quarks is . The electro-weak Standard Model predicts that charged current contributions to the weak N-N interaction are suppressed and that, therefore, the measurement of a zero asymmetry in the reaction would suggest that neither neutral currents nor the strange quark pair sea contribute significantly to the hadronic weak interaction. A non-zero asymmetry, on the other hand, would then establish weak neutral currents as the dominant factor with possibly significant contributions from strange quarks.
The NPDGamma experiment is under commissioning at the Los Alamos Neutron Scattering Center (LANSCE). It is the first experiment designed for the new pulsed high flux cold beam line, flight path 12, at LANSCE. NPDGamma will determine the very small weak pion-nucleon coupling constant in the nucleon-nucleon interaction [2, 3, 4, 5]. This coupling constant is directly proportional to the parity-violating up-down asymmetry in the angular distribution of 2.2-MeV -rays with respect to the neutron spin direction (eqn. 1) in the reaction .
| (1) |
The asymmetry has a predicted size of and our goal is to measure it to 10% accuracy. The small size of the asymmetry and the high proposed measurement precision impose heavy requirements on the performance of the beam line and apparatus. It is necessary to achieve high counting statistics while at the same time suppressing any systematic errors below the statistical limit. The experiment was designed to satisfy these requirements [2].
During commissioning the radiative neutron capture on various target materials was investigated to look for any asymmetry which may enter as a systematic effect while taking data with the hydrogen target. The measurements concentrated on materials that can be found within the experimental apparatus and which are interacting with the neutrons. The targets included Al, Cu, In, and . In addition, the known asymmetry in was used to demonstrate that the array functions as designed and is capable of measuring non-zero asymmetries. Boron is used throughout the experiment, for neutron shielding and to collimate the beam. Aluminum is used in most of the equipment and the beam encounters several millimeter of it, primarily in the windows of the hydrogen target. Cu and In are also used in the target. It is therefore necessary to establish the size of the -asymmetry due to neutron capture on each of these elements.
2 The Experiment
The NPDGamma experiment is located on flight path 12 at the Manuel Lujan Jr. Neutron Scattering Center at LANSCE. The statistical accuracy that can be reached in the NPDGamma experiment at LANSCE is limited by the available cold neutron flux. In a spallation neutron source, the neutron flux depends on the proton current, the energy incident on the spallation target, the moderator performance (brightness) and the neutron guide performance [6]. The LANSCE linear accelerator delivers MeV protons to a proton storage ring, which compresses the beam to ns wide pulses at the base, at a rate of Hz. The protons from the storage ring are incident on a split Tungsten target and the resulting spallation neutrons are cooled by and backscattered from a cold moderator with a surface area of .
2.1 Beam Line
Figure (1) illustrates the flight path and experiment cave. The distance between the moderator and target is about meters. The flight path 12 beam line is m long and consists of m of in pile guide, a m long shutter, a frame overlap beam chopper and meters of neutron guide. The pulsed neutron source allows us to know the neutron time of flight or energy and the installed beam chopper allows us to select a range of neutron energies. In the experiment cave, the beam is transversely polarized by transmission through a polarized 3He cell. Three 3He ion chambers are used to monitor beam intensity and measure beam
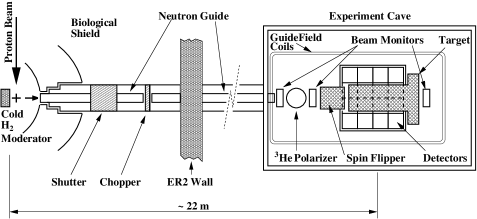
polarization through transmission ratios. A radio frequency spin flipper is used to reverse the neutron spin direction on a pulse by pulse basis. For the production experiment the neutrons will capture in a 21 liter liquid para-hydrogen target. The -rays from the capture are detected by an array of 48 CsI(Tl) detectors operated in current mode [7, 8]. The entire apparatus is located in a homogeneous 10 Gauss with a field gradient of less than mG/cm which is required to maintain the neutron spin downstream of the polarizer.
For the ideal experiment, with 100% beam polarization, 100% spin flip efficiency, point sources and detectors, and no systematic effects resulting in background asymmetries or beam depolarization, the yield from a single detector is given by Eqn. 1, with the intensity essentially determined by the neutron flux. However, the actual signal in the detectors is more closely related to the number of neutrons that capture on the target, the target size, the neutron capture location in the target along the beam direction and the average detector solid angle. All components between the guide exit and the target have been optimized to ensure that they can properly function while attenuating the beam as little as possible. This includes optimization of the monitor and spin filter thicknesses, reduction of the aluminum windows on the monitors and the spin flipper and the overall reduction of the experiment length to reduce beam divergence. In addition to maximizing the number of captured neutrons, a successful asymmetry measurement requires a stable, polarized beam and the ability to reverse the beam polarization without significant losses. The emitted -rays have to be detected with high efficiency and with reasonably good angular resolution, which is limited by the finite size of the detectors and targets [9].
The FP12 beam guide was installed to deliver the maximum possible number of low energy neutrons to the experimental apparatus. FP12 uses an m=3 guide with a cross-sectional area. The guide is coated with hundreds of layers of and . It allows neutrons with 3 times the normal perpendicular velocity to be transmitted, resulting in a large increase in neutron flux as compared to standard guides which employ only coating. A detailed description of our measurement of the FP12 moderator brightness and performance of the neutron guide is given in [6]. The measured brightness has a maximum of for neutrons with an energy of meV.
2.2 Beam Chopper
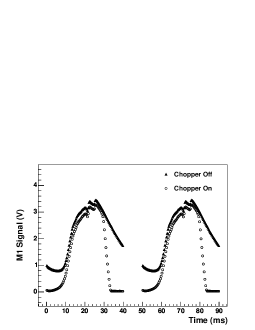
The beam chopper incorporates two blades which rotate independently at up to rpm. The chopper is located m from the surface of the moderator. Since the flight path is about m long and the pulse period is ms the slowest neutrons that reach the end of the guide in each pulse have an energy of about meV. The blades are coated with a layer of which was determined to be fully absorbing for neutron energies up to meV. This is used to block the slow neutrons at the tail end of the time-of-flight spectrum when either one or both of the blades cover the beam opening. The diameter of the blades is m and each blade covers radians of a full circle. The ability to select only part of the neutron spectrum is an important tool to control systematic errors since it provides the ability to effectively polarize, spin-flip and capture the neutrons. It prevents the overlapping of very slow neutrons from a previous pulse with the faster ones from the following pulse. At a distance of about m from the moderator, the time required to fully open or close the beam aperture is ms. During the 2004 commissioning run, the chopper rotation was phased with the beam pulses such that it began opening at each pulse onset , was fully open ms after pulse onset, began closing about ms after pulse onset and was completely closed about ms later (Fig. 2). This allowed us to take beam-off (pedestal) data for ms at the end of each neutron pulse, which is needed for pedestal and background studies. The chopper control feedback loop kept the chopper in phase with the beam pulse to within .
2.3 Beam Monitors
The experiment uses three parallel plate ion chambers, each with a active area as beam monitors. The first (upstream) monitor is located immediately after the neutron guide exit. The second monitor is located downstream of the polarizer to allow in situ absolute beam polarization measurements to be made. The third monitor is located downstream of the target and detector array. It was used during the 2004 commissioning run to study the spin flipper efficiency and will be used to monitor neutron depolarization in the hydrogen target.
2.4 Neutron Spin Filter
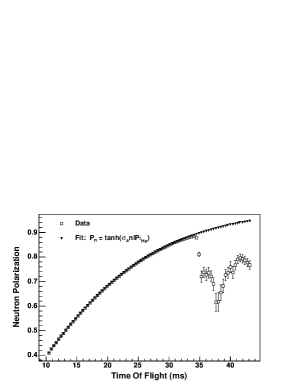
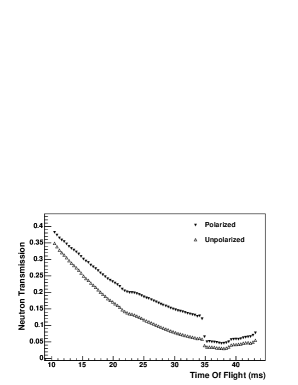
After exiting the neutron guide, the neutrons are spin filtered by passing through a 12 cm diameter glass cell containing polarized . spin filters have a number of desirable features [10]. They have large acceptance angles, do not require high magnetic fields as is the case with supermirrors and neutron capture on does not create a -ray background. The polarization and therefore the neutron polarization can be reversed without changing the direction of the holding field, by adiabatic fast passage of the spin. The neutron polarization can be measured with % accruracy and without introducing large magnetic field gradients. The cross-section for capture of neutrons with spin parallel to the nuclear spin has been measured to be of the total absorption cross-section [11], but is assumed to be zero on theoretical grounds. So neutrons with spin anti-parallel to the nuclear spin are absorbed while those with spin parallel are mostly transmitted. If the time of flight (energy) of the neutrons is known, then the neutron polarization can be determined directly from the neutron transmission measurements [12]. For NPDGamma, the figure of merit is the statistical accuracy that can be reached for a certain running time, which is a product of both, the neutron transmission and polarization . The neutron transmission increases as a function of energy (decreases as a function of time of flight), whereas the neutron polarization decreases as a function of energy (Fig. (3)). In the analysis of the data taken during the 2004 commissioning run the neutron polarization was calculated for each run. The transmission spectrum obtained for each run was fitted with , using a thickness of , which was measured with an unpolarized cell, during the commissioning run. For each run the polarization was extracted as a fit parameter.
2.5 Spin Flipper
In this experiment the asymmetry is measured continuously since the signals from opposite detectors in a pair are measured simultaneously for each spin state. However, the efficiency of the -ray detectors will change slowly due to a number of effects including temperature and crystal activation and the detector gains cannot be matched to an accuracy that would allow an asymmetry measurement to be made for each individual neutron pulse. In addition, an asymmetry measurement cannot be made to the required level of accuracy by simply measuring the signal in a given detector for one spin state and the corresponding signal in the same detector for the opposing spin state, made some time later after the neutron spin has been reversed using the neutron spin filter. This possibility is precluded because of pulse-to-pulse fluctuations in the beam current. Both situations lead to false asymmetries.
The primary technique for reducing false asymmetries generated by gain non-uniformities, slow efficiency changes and beam fluctuations is fast neutron spin reversal. This allows asymmetry measurements to be made for opposing detectors, removing sensitivity to beam fluctuations, and for consecutive pulses with different spin states, removing the sensitivity to detector gain differences, drifts, and fluctuations. The asymmetries can then be measured very close together in time, before significant drift occurs. By carefully choosing the sequence of spin reversal, the effects of drifts up to second order can be further reduced. To achieve this fast neutron spin reversal, the experiment employs a radio frequency neutron spin flipper (RFSF) [13] which operates according to the principles of NMR, using a kHz magnetic field with an amplitude of a few Gauss. The neutron spin direction is reversed when the RFSF is on and is unaffected when it is off. During the 2004 commissioning run the spin flip efficiency was measured to be about 95% averaged over the beam cross-section.
2.6 Liquid Hydrogen Target
The NPDGamma liquid hydrogen target consists of a cylindrical l target vessel containing the liquid hydrogen, surrounded by a vacuum chamber. The hydrogen itself and the heat radiation shield, located around the vessel, are cooled by two cryogenic refrigerators. In the cooling process, the hydrogen is converted to liquid para-hydrogen, from its usual state of mostly ortho-hydrogen, to prevent the depolarization of the neutron spin in the target via spin-flip scattering. Monte Carlo calculations indicate that the cm diameter and cm long hydrogen vessel is large enough to capture about 60% of the incident neutron beam. The beam entrance windows in the vacuum chamber, radiation shield, and target vessel are as thin as possible to efficiently transmit the neutron beam and create minimal prompt capture radiation.
2.7 Detector Array
The detector array consists of 48 CsI(Tl) cubes arranged in a cylindrical pattern in 4 rings of 12 detectors each around the liquid hydrogen target. In addition to the conditions set on the detector array by the need to preserve statistical accuracy and suppress systematic effects, the array was also designed to satisfy criteria of sufficient spatial and angular resolution, high efficiency, and large solid angle coverage [7]. To measure to an accuracy of the experiment must detect at least -rays from capture with high efficiency. The average rate of -rays deposited in the detectors for any reasonable run-time is therefore high. Because of the high rates and for a number of other reasons discussed in [7], the detector array uses accurate current mode -ray detection. Current mode detection is performed by converting the scintillation light from CsI(Tl) detectors to current signals using vacuum photo diodes (VPD), and the photocurrents are converted to voltages and amplified by low-noise solid-state electronics [8].
In current mode detection, counting statistics appears as the RMS width in the sample distribution, due to the fluctuation in the number of electrons produced at the photo-cathode of the VPD, as a result of the quasi instantaneous amount of energy deposited in the CsI crystal. During beam on measurements, the shot noise RMS width is given by [14]
| (2) |
where is the amount of charge created by the photo cathode per detected -ray, is the average photo-current per detector and is the sampling bandwidth, set by the ms time bin width in the time of flight spectrum. Figure 4 shows the RMS width for a typical detector, as seen at the preamplifier output. The width from counting statistics is compared to the RMS width seen for beam-off electronic noise.
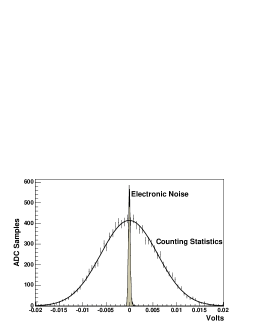
To ensure a timely and accurate measurement of the -ray asymmetry the detector array must operate at counting statistics which requires the RMS width from electronic noise to be significantly smaller than the width observed from real events. For a given and , the RMS width expected from the detector design criteria at the preamplifier output is mV. The error on the expected width is dominated by the accuracy to which we know the efficiency (number of photo-electrons per MeV) of the detector. Using the known proton current and an appropriate Monte Carlo model for neutron capture on the number of photons entering a detector, per time bin, is . The corresponding RMS width expected due to neutron counting statistics is mV.
3 2004 Commissioning Targets Asymmetries
To determine the parity violating asymmetry in neutron-proton capture to the proposed accuracy, any possible false asymmetry from neutron capture on other materials must be measured. These asymmetries form a background which introduces a shift in the measured asymmetry if they are non-zero and, at the very least, produce a dilution of the asymmetry, even if they are zero. The degree of shift or dilution in the asymmetry is proportional to the size of the background signal, relative to the signal of interest. We refer to these false asymmetries as neutron capture related or induced systematic effects. There are also instrumental systematic effects which arise due to changing equipment properties which may be correlated with the neutron spin. Some of the possible instrumental systematic effects have been briefly mentioned earlier and those related to the detector array in particular are discussed in detail in [7]. A more detailed discussion of systematic effects related to neutron capture and scattering is provided in [9]. It is difficult to model or calculate the level of parity-violation in these targets and to establish an upper level of their contribution it must be measured.
3.1 Asymmetry Definition
Due to the G holding field, surrounding the experimental apparatus, the neutrons are polarized vertically after leaving the 3He spin filter. While taking hydrogen data, the parity violating asymmetry in n-p capture is therefore seen in a difference of the number of -rays going up and down. For the ideal experiment, the -ray cross section is proportional to , where is the angle between the neutron polarization and the momentum of the emitted photon. A third term is introduced if a left-right (LR) asymmetry exists . However, as discussed earlier, the basic expression for the -ray yield is modified due to limitations in the properties of the experimental apparatus and interaction of neutrons with elements other than hydrogen. In calculating the final combined asymmetry one asymmetry was calculated for each detector pair and time bin and over any valid sequence of 8 macro pulses with the correct neutron spin state pattern. A so-called valid 8 step sequence of spin states is defined as (). This pattern suppresses first and second order gain drifts within the sequence. The measured (raw) asymmetry for each detector pair can be extracted by forming a ratio of differences between detectors in a pair divided by their sum. After all correction factors have been applied, the final physics asymmetry for a given detector pair, spin sequence , and neutron time of flight is given by
Where the background asymmetries and the relative signal level from the elements that cause them must be measured in auxiliary measurements. The relative, target out, background levels for the various targets were , depending on the shielding collimation and target geometries. Asymmetries from target out runs were measured to be zero. is the gain asymmetry between the detector pair and is the asymmetry from pulse to pulse beam fluctuations. The neutron energy and detection efficiency weighted spatial average detector cosine (up-down asymmetry) with respect to the vertical is given by , while the detector sine (left-right asymmetry) is given by . Also included are the correction factors due to the neutron beam polarization , the spin flip efficiency and the level of beam depolarization in the target . The beam depolarization for the targets we report on here was modeled and values for range from to . It is important to realize that signal fluctuations that are not correlated with the switching of the neutron polarization direction will average out and don’t contribute to any asymmetry. It is, however, essential that these signals have an RMS width that is small compared to the RMS width in the asymmetries of interest (driven by counting statistics) so that they do not dilute the result and are averaged to zero quickly compared to the time it takes to measure the asymmetry to the desired accuracy. The product of the gain and beam fluctuation asymmetries was measured to be consistent with zero with a statistical error that was typically two orders of magnitude smaller than the error on the raw asymmetry (see RMS width in table 1). Possible false asymmetries due to electronic pickup and possible magnetic field induced gain changes in the detector VPDs have previously been measured and are consistent with zero to within [7].
The detector pair physics asymmetries as represented by eqn. LABEL:eqn:TBPHASY can then be combined in error weighted averages over the neutron time of flight spectrum to form a single asymmetry for the entire detector array for a single sequence of beam pulses. If beam intensity levels are monitored to be reasonably stable over the measurement time these sequence asymmetries can be histogrammed. Typical run lengths were minutes and included 10000 beam pulses or 1250 8-step sequences and the asymmetry measurements performed so far usually extended over several hundred runs.
3.2 Results
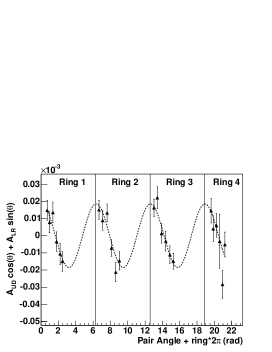
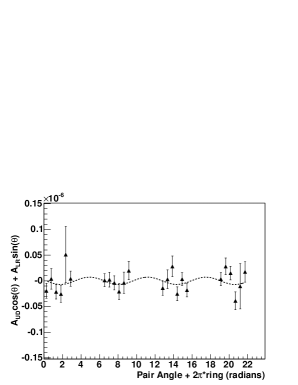
The known asymmetry in was used to verify that a nonzero asymmetry can, in fact, be measured with this experimental setup. The asymmetry was also used to verify the geometrical dependence of the pair asymmetries. For this purpose, each of the 24 pair asymmetries, extracted from the histogrammed 8-step sequence asymmetries from all data obtained with that target, were multiplied by its mean geometry factor and plotted versus its corresponding mean error. The resulting graph is shown in Fig. 5. The fit function used to extract the total array asymmetry is . The asymmetries obtained from the measurements were previously measured by this collaboration and others. M. Avenier and collaborators [15] found an Up-Down asymmetry of . The results of the asymmetry measurements performed during 2004 commissioning run are summarized in table 1. Systematic errors from the correction factors discussed above are less than 10% and are scaled by the asymmetry.
| Up-Down | Left-Right | RMS width (typ.) | |
|---|---|---|---|
| Al | |||
| Cu | |||
| In | |||
| Noise (add.) | |||
| Noise (mult.) | |||
| Beam Gain | 0 | 0 | |
4 Conclusion
The NPDGamma experiment successfully completed a commissioning run in April 2004. It was shown here that each component in the experiment, except the hydrogen target, was commissioned during the 2004 run cycle and each component performed as designed. To establish the level of false asymmetries that may be present for the hydrogen production runs, several measurements were performed. Possible false asymmetries due to instrumental systematic effects involving the detector array and spin flipper were measured to be zero at the level. Asymmetries due to beam fluctuations were measured using the beam monitors. The beam asymmetry enters into the main data asymmetry as a product with the detector pair gain asymmetry with a combined RMS width of , which is negligible. False asymmetries due to neutron capture on materials other than hydrogen were measured for Al, Cu, In and . These asymmetries were found to be consistent with zero. It is clear from the results obtained so far that NPDGamma incorporates a powerful experimental setup that can be used to measure very small parity violating asymmetries and that the experiment meets all criteria needed to perform a successful measurement of the weak parity-violating asymmetry with an accuracy of in the neutron capture reaction .
References
- [1] B. Desplanques, J. F. Donoghue, B. R. Holstein, Annals of Physics 124, (1980) 449.
- [2] J. Bowman et al., Proposal LA-UR-99-5432, Los Alamos National Laboratory (1999).
- [3] M. Snow et al., Nucl. Instr. and Meth. A 440, (2000) 729.
- [4] M. Snow et al., Nucl. Instr. and Meth. A 515, (2003) 563.
- [5] G. S. Mitchell et al., Nucl. Instr. and Meth. A 521 (2004) 468.
- [6] P-N. Seo et al., Nucl. Instr. and Meth. A 517 (2004) 285.
- [7] M. T. Gericke et al., Nucl. Instr. and Meth. A 540 (2005) 328.
- [8] W. S. Willburn, J. D. Bowman, M. T. Gericke, S. I. Penttilä, Nucl. Instr. and Meth. A 540 (2005) 180.
- [9] M. T. Gericke. PhD thesis, Indiana University, 2004.
- [10] T. Gentile, In the proceedings of the International Conference on Precision Measurements with Slow Neutrons, NIST Journal of Research (2005).
- [11] L. Passell and R. I. Schermer, Phys. Rev. 150, (1966) 146.
- [12] G. L. Jones et al., Nucl. Instr. Meth. A 440 (2000) 772.
- [13] P-N. Seo et al., Nucl. Instr. and Meth. to be submitted.
- [14] W. B. Davenport, W. L. Root, An Introduction to the Theory of Random Signals and Noise, John Wiley & Sons, New York, 1987.
- [15] M. Avenier et al. Nucl. Phys. A, 436 (1985) 83.